The Crop Calculators – from Simulation Models to Usable Decision-Support Tools Li, F.Y. 1, P.D. Jamieson 1, R.F. Zyskowski 1, H.E. Brown 1 and A.J. Pearson 2 1
New Zealand Institute for Crop and Food Research Limited, Private Bag 4704, Christchurch, New Zealand 2 Foundation for Arable Research, P.O. Box 80, Lincoln, Canterbury, New Zealand Email:
[email protected]
Keywords: Simulation models, system architecture, crop management, N fertiliser, irrigation fertilisation versus plant N uptake, N leaching and emission) in soil profiles. Crop N demand was calculated as the sum of the N demand for various plant tissue categories. Crop N uptake was driven by the demand, but limited by soil mineral N availability. Effects of drought and N-deficit on crop growth were quantified by reducing leaf area expansion, accelerating leaf senescence, and reducing radiation use efficiency.
EXTENDED ABSTRACT Crop & Food Research has developed a set of simulation-based Crop Calculators as precision management tools for optimising nitrogen (N) and water management of wheat, potato and maize crops. Their main purpose is to provide best practice N-fertiliser and irrigation management schedules for user-specified crops, or to predict the likely consequences of management decisions. Both economic returns and environmental impact (N-leaching) are taken into account. The Calculators have also been very useful in identifying production constraints. In some cases these have been able to be overcome, or in others inputs have been reduced to avoid environmental impacts and unnecessary costs. They provide a rapid method for assessing the effects of changes in management on production, soil resources and profitability.
The Calculators were validated against field-grown crops. Their prediction on crop growth and yield matched measurements from the crops well under various irrigation and N fertiliser applications and across a wide range of weather and soil conditions. Their effectiveness as management tools was demonstrated through significant reductions in fertiliser applications without reducing yield, especially for potato and maize. The features of the systems include: keeping it simple; appropriate compromise between accuracy and convenience; the use of real system constraints together with simulation results for suggesting management.
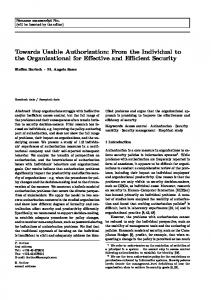
The Calculators are based on daily time-step simulation models. Each Calculator has a unique crop model simulating plant growth and development, with responses to variable water and N conditions, but all interact with a common soil model. The system model has CROP, SOIL, WEATHER and MANAGEMENT modules (Figure 1 ). During each daily time-step, CROP grows to a new state according to current soil state, weather and management conditions; and SOIL changes to a new state according to current crop state, weather and management conditions. MANAGEMENT has details of irrigation and N fertiliser application schedules, which may be specified by users to affect soil conditions in one way, or be generated by the system according to soil state and management rules to advise user for decision support in another way.
Wheat vernalise MANAGEMENT Cultivar Sowing date Population MApplication *Ap ... ...
Potato tuber
CROP CropState* preCState, curCState SoilState* curSoilState Phenological development Canopy developemnt Biomass accumulation Biomass partitioning ...
(1)
WEATHER Date Radiation Temperature Rain Wind Humidity ...
CropState
SoilState
Date LAI Top biomass & yield Root depth & biomass Crop N ... DailyN uptake ...
Date Plant available N Plant available water ...
(3)
Maize milkline
Accum.Water deficit ...
(2) MApplication Irrigation (date, rate) Fertilisation (date, rate) ...
Plant growth potential and the effects of water and N limitations were simulated. The levels of drought and N-deficit were quantified by simulating the changes in plant available water (balance between rainfall and irrigation versus evapotranspiration and drainage) and mineral N (balance of organic N mineralisation and N
SOIL SoilState* preSState, curSState CropState* curCState Water balance (rainfall, ET & drainage) Soil organic matter turnover N uptake, emmision and leaching ...
Figure 1. Simplified system architecture of the crop calculators, showing how (1) CROP and (2) SOIL changes to a new state during a daily timestep, and (3) how irrigation and N fertiliser application schedules affect to, or are generated from soil state.
128
applications) and the price of crop products also may be input for financial analysis.
1. INTRODUCITON The crop calculators are precision crop management tools for optimising nitrogen (N) and water management of crops. Currently, the set includes the Sirius Wheat Calculator (Jamieson et al. 1998; Jamieson & Semenev 2000; Armour et al. 2002), the Potato Calculator (Jamieson et al. 2003; Jamieson et al. 2006) and the AmaizeN Calculator (Li et al. 2006a; Li et al. 2007a). More tools are in the chain to be added for crops such as forage brassicas (Wilson et al. 2004) and peas (Li et al. 2006b). Each crop calculator has been developed as a standalone system, and has a unique crop model simulating plant growth and development under variable water and N conditions, but all the crop models interact with a common soil model. The calculators have similar user interfaces and system architecture, and use the same method in dealing with weather conditions and crop management. In this paper we briefly describe the functionality and operation of the crop calculators, present the merged system architecture that can be used to develop new tools for other crops. The tools may also be deployed in one system for modelling crop rotation and intercropping (Zyskowski et al. 2007a). Description of the underlying crop-soil interaction models is given, with emphasis on how simulated water and N limitations affect crop growth and yield. Finally, we provide the methods and principals we used to convert the simulation models into usable decision support tools.
There are several ways that the crop calculators may be used. At the beginning of the season they may be used to select combinations of cultivar and sowing date, and for planning irrigation and Nfertiliser application regimes. During the crop season irrigation and N-fertiliser schedules may be updated using up-to-date weather, soil and crop conditions. They may recommend the irrigation and N-fertiliser application schedule for best yield based on the site-specific conditions, and assess the likely financial and environmental impact. They may be used to answer “what-if” questions, by calculating the likely consequences of any userspecified management decisions, so can also be used as a rapid method for assessing the effects of changes in management on production, soil resources and profitability. They may also be used as a diagnostic aid in identifying production constraints by comparing crop performance with prediction. In some cases these can be overcome, or in others inputs can be reduced to avoid environmental impacts and unnecessary costs. The outputs of the calculators include a series of tables and graphs showing crop phenological development, canopy expansion, biomass and harvest yield accumulation, and soil N and moisture dynamics to inform users’ decisions.. 3. SYSTEM ARCHITECTURE AND CROP MODELS The engines of the crop calculators are daily time step crop-soil interaction simulation models. Figure 1 is a simplified system architecture diagram, showing the main processes of crop-soil interaction during a daily time-step. Under the WEATHER conditions and control of MANAGEMENT interventions, CROP grows to a new state (daily growth) depending on the SOIL state, and SOIL proceeds to a new state (daily change) depending on the crop state. MANAGEMENT applications (irrigation and fertiliser application rate and date) affects or modifies soil state. Alternatively, soil state and plant demand are used to generate irrigation or nitrogen applications in concert with management rules.
2. SYSTEM FUNCTIONALITY The operation of the crop calculators needs cultivar specific parameters, soil description, and weather data. These data are deployed as a database (files) with the system, and new data can be added easily if they do not exist. Cultivar specification requires numeric growth and development parameters, such as thermal time or photoperiod responses that determine when a cultivar reaches a particular phenological stage. Soil description includes organic N content, waterholding capacity and permeability. Weather inputs are daily solar radiation, rainfall, and maximum and minimum temperature, and optionally wind and humidity. The system is arranged so that a user may select a cultivar, soil type and weather station by name. They must specify sowing date and population, and provide values of initial mineral N contents and moisture deficit in soil profile. The cost of crop management (irrigation and fertiliser
3.1.
Crop models
Each crop calculator contains a unique crop model simulating plant growth and development. Currently , the models are Sirius wheat (Jamieson et al. 1998), Sirius potato (Jamieson et al. 2003) and Amaize (Li et al. 2006a). The crop models all
129
use a similar approach to phenological and canopy development, biomass accumulation and partitioning (Figure 1), and share similar mechanisms for quantifying crop response to water and N limitation. Potential growth and yield is defined according to the product of intercepted solar radiation and radiation use efficiency (RUE), the latter is species specific and responds to temperature. Drought stress and N deficit are quantified by simulating the changes in supply – soil profile plant available water and mineral N (Jamieson et al. 1998), compared with crop demand. Crop N demand is calculated as the sum of the N demand for various plant tissue categories (Sinclair & Amir 1992; Muchow & Sinclair 1994; Jamieson & Semenov 2000; Jamieson et al. 2003). Crop N uptake is driven by demand, but limited by soil mineral N availability. The water and N budgets of the crop system are assessed daily, together with budget of plant assimilates, and the responses quantified via green leaf area index (LAI) and RUE (Figure 2).
model of Addiscott and Whitmore (1991). Within any soil layer, water exists in up to three states – unavailable (below the lower limit of extraction), available immobile (between the lower limit of extraction and the drained upper limit) and mobile (between the drained upper limit and saturation). Available water holding capacity per layer PAWmax) is defined as the capacity of the available immobile phase. Water deficit factors are handled slightly differently in the different models. In the wheat and maize models, a water deficit factor (Wdf) is defined from the ratio of actual PAW (PAWact) to the root zone PAWmax, with a maximum value of 1. If Wdf