Kufa Journal of Engineering Vol. 7, No. 1, January, 2016, P.P. 115-128 Received 8 October 2015, accepted 10 January 2016
THE EFFECT OF FLOW CONDITIONS AND GEOMETRIC PARAMETERS ON THE SCOUR VALUE DOWNSTREAM COMPOSITE STRUCTURES OF WEIR AND GATE Dr. Hassan A. Omran1, Dr. Saleh I. Khassaf 2 and Fadhel Abdulabbas Hassan3 1 Asst.
Professor, University of Technology, Building and Constructions Department, Email:
[email protected] 2 Professor, University of Basrah, College of Engineering, E-mail:
[email protected] 3 Asst. Lecturer, University of Kufa, Faculty of Engineering, E-mail:
[email protected] ABSTRACT In this research, a study was conducted experimentally to investigate the scour hole dimensions downstream the combined structures which consist of weir and gate. Twelve models have been designed and every model is formed from composite weir consists of two geometric shapes and three types of gates which are rectangular, semi-circular and triangular in shape, where multi factors were studied to find out the effect of changing geometry for both weir and gate, discharge flowing in the flume and particle size of bed material on the dimensions of scour hole. The experiments was conducted in a laboratory channel was constructed from blocks and concrete with length of 18 m, 1 m width and 1 m depth. The laboratory models were installed after 7 m from the main gate which is controlling the passage of water from the main reservoir into the flume. At the beginning, the calibration process was conducted to identify the actual discharge values that pass in the flume, then experiments were conducted to calculate the discharge coefficient for each model, which represents one of the studied factors within the dimensional analysis of the variables to derive the empirical formulas to calculate the dimensions of scour hole. Then the experiments were conducted in order to derive formulas to investigate the depth and length of the scour hole which formed in the sand floor spreading as a layer of 30 cm in thickness for a distance 4 m downstream combined structure. Two samples of sand were used in the experiments with different median size of particles ( d50), the first of 0.7 mm and the second of 1 mm. Using the dimensional analysis by π theorem and IBM SPSS 21 program, Four nonlinear relationships were derived to calculate the dimensionless scour depth (SD / d50) and another four nonlinear relationships calculates the dimensionless length of scour (SL / d50) depending on the laboratory results for each of the relative discharge (Qr), Froude number in terms of mean size of particle of bed material (Frd), non-dimensional difference head between upstream and downstream of combined structure (HD / d50), dimensionless distance between the lower edge of the weir and the upper edge of the gate (y3 / d50), dimensionless head over the crest of compound weir (h/d50) and the discharge coefficient (Cd), where the resulted determination coefficients (R2) from these relationships were good. KEY WORDS: Combined structures, Scouring, Compound weir.
Hassan A. Omran et al.
116
تاثير ظروف الجريان والعوامل الهندسية على قيمة االنجراف مؤخر المنشات المركبة من الهدارات والبوابات أ .م .د .حسن علي عمران قسم هندسة البناء واالنشاءات، الجامعة التكنولوجية
أ .د .صالح عيسى خصاف قسم الهندسة المدنية ،كلية الهندسة، جامعة البصرة
م .م .فاضل عبد العباس حسن قسم هندسة المنشات والموارد المائية ،كلية الهندسة ،جامعة الكوفة
المستخلص تمت دراسة خصائص النحر مختبريا ً في هذا البحث مؤخر المنشآت المركبة المتكونة من الهدارات و البوابات ،إذ تضمنت الدراسة قياس اقصى عمق و اقصى طول لحفرة النحر المتكونة مؤخر تلك المنشآت .تم تصميم 21نموذج حيث يتكون كل نموذج من هدار مركب من شكلين هندسيين و ثالثة اشكال من البوابات و هي المستطيلة ،الدائرية و المثلثة ،حيث تمت دراسة تأثير كل من تغير االبعاد الهندسية لشكل الهدار و البوابة ،التصريف المار في القناة و حجم مادة القعر على ابعاد حفرة النحر. لقد تم اجراء التجارب في قناة مختبرية ُ شيِّدَت من البلوك و الخرسانة بطول 21م و عرض 2م و عمق 2م ،حيث تم تثبيت النماذج المختبرية على بعد 7م من البوابة الرئيسية التي تتحكم بمرور الماء من الحوض الرئيسي الى داخل القناة .في بداية العمل المختبري تم اجراء عملية المعايرة لمعرفة التصاريف الفعلية المارة خالل القناة و بعد ذلك تم تجارب باستخدام قيم مختلفة للتصريف داخل القناة بحيث يتغير على اساسها عمق الماء في مقدم و مؤخر المنشآت المركبة و ذلك لفحص االداء الهيدروليكي و قياس معامل التصريف ) (CDلكل نموذج الذي يعتبر احد العوامل المدروسة و التي تدخل ضمن التحليل البعدي للمتغيرات الخاصة باشتقاق معادالت حساب ابعاد حفرة النحر .بعد ذلك تم اجراء تجارب المختبرية لغرض اشتقاق المعادالت الخاص ة بقياس عمق و طول حفرة النحر التي تتشكل في ارضية رملية تمتد بمسافة 4م مؤخر المنشأ المركب و على عرض القناة و بسمك 03سم ،حيث تم استخدام نموذجين من الرمل لمادة القاع بمعدل قطر للنموذج االول )3.7 (D50 ملم و للنموذج الثاني 2ملم. باستخدام نظرية Πللتحليل البعدي و برنامج ، SPSSإشتُق ْ ت اربع عالقات ال خطية خاصة بحساب عمق النحر الالبعدي ) (SD/D50و اربع عالقات اخرى خاصة بحساب طول النحر الالبعدي ) (SL/D50و عالقتهما مع كل من التصريف النسبي ) ، (QRرقم فرويد بداللة متوسط حجم حبيبات مادة القعر ( ، (FRDفرق المنسوب الالبعدي بين مقدم و مؤخر المنشأ المركب ) ، (HD/D50المسافة الالبعدية بين الحافة السفلى للهدار و الحافة العليا للبوابة ) (Y3/D50و معامل التصريف ) (CDحيث كانت قيم معامالت التحديد ) (R2الناتجة من هذه العالقات جيدة.
Kufa Journal of Engineering, Vol. 7, No. 1, 2016
117
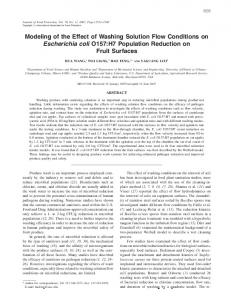
1. INTRODUCTION Weirs and gates are the common and important structures which are used in controlling and adjusting the flow in irrigation channel. Weirs widely used for flow measurements. One of the weirs demerits is they need to be cleaned of sediment and trash periodically. Sluice gates are used extensively for flow control and water measurement for long time. One disadvantage of the sluice gates is they retained the floating materials. In order to maximize their advantages, weirs and gates can be combined together in one device, so that water could pass over the weir and below the gate simultaneously. Fig. 1 shows this structure, this compound device create a new hydraulically condition in compression with weir or gate, each other alone. The combined weir and gate systems can be used in minimizing sedimentations and depositions (Dehghani et al. (2010). The economic aspect is one of the important factors in the creation of such a project and to reduce the cost of any project is the preoccupation with taking into consideration the structure will be run optimally and without causing any damage to the future. The non-use of concrete floor at downstream of the structure, which are designed to dissipate energy flow passing over the edge of the weir is one of the most important methods that will reduce the cost, and it must use the alternative is less expensive and available and ensures the lack of access scour subsequently leads to the occurrence of damage in the structure and keep it fully within the allowable limits. Ahmed (2007) investigated the scour characteristics downstream weirs, gates and combined structures consist of weir and gate had been conducted. The study included the measurement of maximum scour depth (Ds) and the length (Ls) of scour hole downstream these structures. Also, the effects of structure height, under sluice opening height, discharge variation and bed material size (D50) on the depth and length of scour hole. Two empirical relationships were obtained to estimate (Ds/D50) and (Ls/D50) in terms of Froude number (Fr0) , relative water surface fall (ΔHw/P), relative opening height (h0/ΔHt) and relative discharge (qu/qd) for compound gates with high correlation coefficients. Dehghani et al. (2010) studied the scour characteristics of scour hole downstream of combined free over weir and below gate experimentally. The conceptual model of flow field downstream of combine flow over the weir and under the gate indicates that there are interactions between the flows over the weir and under the gate and the scour hole cuts and fills alternatively. By increase of Froude number, the maximum depth of scour (hs), length of scour (l1) and sedimentation length (l2) increase. Sobeih et al. (2012) investigated the scour depth downstream weir with openings. The study was based on an experimental program included 171 runs. These runs were carried in a rectangular flume with openings fixed in the body of weirs. Three cases of opening arrangements were included, no opening, one opening and three openings. Different diameters of openings 1.27 cm, 1.9 cm and 2.54 cm, different heights at 0, 0.25 and 0.5 of weir height were tested under different flow conditions. The experiments showed that for most considered values of openings diameter either case of one opening or three openings, the value of h/p = 0.25 gave the smaller values of scour depth, while the value of h/p = 0.5 gave the higher values of scour depth. Also, it was noticed that for most considered values of openings height, the value d/p = 0.149 gave the smaller values of scour depth for case of one opening but for case of three openings, the value d/p = 0.075 gave the smaller values of scour depth. Finally empirical formula was developed for estimating scour hole depth in terms of downstream flow conditions, Froude number, height of the weir, number of openings, area of openings, diameters and heights of the openings. 2. DIMENSIONAL ANALYSIS By utilizing dimensional analysis for the variables that affecting on length and depth of scour hole, the functional form can be expressed as:
118
Hassan A. Omran et al. SL, SD = f(ρs, g, d50, Qr,Vm, y3,h, HD, Cd,Ɵ1) …(1)
where: SD: scour hole depth SL: scour hole length ρs: mass density for bed material g: gravitational acceleration Qr = relative discharge =
Qw𝑒𝑖𝑟 Qgate
=
𝑄𝑤 𝑄𝑔
=
... (2)
Vm: mean flow velocity y3: the distance between the lower edge of compound weir and upper edge of gate. h: head of water above the crest of compound weir HD: head difference between upstream and downstream of combined structure Cd: discharge coefficient Ɵ1: the angle of triangular or trapezoidal notch f (SL,SD,ρs,g,d50,Qr,Vm, y3, h, HD,Cd,Ɵ1) = 0 …(3)
Buckingham’s π-theorem was used to develop a dimensionless equation, in which repeated variables ρs, g and d50 were selected. The dimensionless forms of equations (3) is: ∴
𝑆𝐷 𝑑50
𝑆𝐿
y
h
HD
, 𝑑 = f (Qr, Frd, 𝑑 3 , d , d , Cd, Ɵ1) …(4) 50
50
50
50
Where Frd is Froude number in terms of particles mean size which is equals to: Frd =
Vm √g d50
… (5)
3. EXPERIMENTAL WORK An experimental work was carried out using a rectangular laboratory flume which was constructed by the researcher from blocks and concrete as shown in Fig. 2. The flume is 18 m long, 1 m wide and 1.1 m deep. The models of combined structures are installed at 7 m from the main gate of the flume. A calibration process was conducted to the flume by using a standard weir which is designed according to USBR limitations (USBR (2001)) for standard sharp crested weir with 90o V notch.
Qw H
h1 hg
D
Qg
h2
Fig. 1. Definition sketch for combined free flow over weirs and under gates
Kufa Journal of Engineering, Vol. 7, No. 1, 2016
119
4 2
12
1
7
6
3
10 5
8 9 11 13
Fig. 2. The Flume Parts and Accessories: 1. The flume, 2. Head basin, 3. Lateral basin, 4. Vertical sluice head gate, 5. Vertical sluice tail gate, 6. Stilling screens, 7. Main pump, 8. Gauge point, 9. Rails, 10. Iron frame, 11. BRC mesh, 12. Overflow valve, 13. Exhausting and cleaning valve
Fifteen models were used in the experimental work to investigate the scouring and to derive formulas describe the relationships between scour hole dimensions and other hydraulic and geometric parameters. The geometrical dimensions for all tested models are listed in Table 1. It should be mentioned that the following geometric parameters are constant for all the tested models: The width (B) = 1 m and the overall height (H) = 0.5 m. for all models. The height of upper part of compound weir (y1) for all models = 0.2 m. Each five models have the same shape of compound weir with different dimensions and different shape of gate which are rectangular, semi-circular and triangular as shown in Fig. 3. 3.1.
Sieve Analysis for Bed Materials Samples
In this study, sand was used as a material for the bed of flume and the samples which were selected, included all the grades of sand from coarse to fine and as classified by the USCS classification (Murthy (2001)). To investigate the effect of sediment size as an effective parameter on the scouring process, two samples were selected to conduct the laboratory experiments with two mean diameter, the first of 1 mm and the second of 0.7 mm.Sieve analysis and preparation of the quantities required was conducted by NSGF Company for production of sand and gravel filters. The results of sieve analysis for both samples mentioned above are as shown in Fig. 4. The geometric standard deviation 𝜎𝑔 of the sand size equals to 2.27 for the first sample and 2.62 for the second sample, which is implies that:
120
Hassan A. Omran et al. 𝒅
𝝈𝒈 = √ 𝟖𝟒.𝟏 𝒅
… … … (6)
𝟏𝟓.𝟗
Table 1. Geometric Properties for Laboratory Models Model No.
y2 (m)
y3 (m)
b1 (m)
b2 (m)
b3 (m)
D (m)
ϴ1o
1
0.15
0.11
0.95
0.72
0.05
0.14
10
2
0.14
0.14
0.9
0.67
0.1
0.14
20
3
0.12
0.15
0.86
0.63
0.14
0.14
30
4
0.11
0.16
0.8
0.57
0.22
0.14
45
5
0.09
0.17
0.76
0.53
0.31
0.14
60
6
0.15
0.1
0.95
0.72
0.05
0.16
10
7
0.14
0.13
0.9
0.67
0.1
0.16
20
8
0.12
0.14
0.86
0.63
0.14
0.16
30
9
0.11
0.15
0.8
0.57
0.22
0.16
45
10
0.09
0.16
0.76
0.53
0.31
0.16
60
11
0.15
0.08
0.95
0.72
0.05
0.2
10
12
0.14
0.11
0.9
0.67
0.1
0.2
20
13
0.12
0.12
0.86
0.63
0.14
0.2
30
14
0.11
0.13
0.8
0.57
0.22
0.2
45
15
0.09
0.14
0.76
0.53
0.31
0.2
60
H
(a
B
B
(b
H
B (c) Fig. 3. General definition sketch for (a) first five models (b) Second five models (c) Third five models
100
100
90
90
80
80
70
70
% Passing
Passing %
Kufa Journal of Engineering, Vol. 7, No. 1, 2016
60 50 40 30
121
60 50 40 30
20
20
10
10 0
0 0.1
1
0.1
10
1
10
Grain Size (mm)
Grain Size (mm)
(a)
(b)
Fig. 4. Sieve analysis of bed material for (a) The first sample (d50 = 0.7 mm) (b) The second sample (d50 = 1 mm)
4. RESULTS AND DISCUSSION 4.1.
Effect of relative discharge (Qr)
For the first five models, the results show that the values of SD/d50 increase when the value of Qr also increase. The maximum value is recorded at model No. 5 with value of 347.1 when Qr equals to 1.46 with d50 equals to 0.7 mm. While the minimum value is recorded at model no. 1 was 96 when Qr equals to 0.011 with d50 equals to 1 mm (Fig. 5). Figure 6 shows that the maximum value of SD/d50 is recorded in the second five models was 358.6 when Qr equals to 1.57 with d50 equals to 0.7 mm in model no. 10, while the minimum value of SD/d50 is recorded was113 for Qr value of 0.02 in model no. 6 with d50 equals to 1 mm. In the third five models, Fig. 8 shows that the maximum value of SD/d50 is recorded was 342.9 when Qr equals to 1.34 with d50 equals to 0.7 mm in model no. 15, while the minimum value of SD/d50 is recorded was 85 for Qr value of 0.01 in model no. 11 with d50 equals to 1 mm. 400
d50 = 0.7 mm
350
d50 = 1 mm
SD/d50
300 250 200 150 100 50 0 0
0.2
0.4
0.6
0.8
1
1.2
1.4
Qr
Fig. 5. Relationship between SD/d50 and Qr for the first five models
1.6
122
Hassan A. Omran et al. 400
d50 = 0.7 mm
350
d50 = 1 mm
SD/d50
300 250 200 150 100 50 0 0
0.2
0.4
0.6
0.8
1
1.2
1.4
1.6
Qr
Fig. 6. Relationship between SD/d50 and Qr for the second five models 400
d50 = 0.7 mm
350
d50 = 1 mm
SD/d50
300 250 200 150 100 50 0 0
0.2
0.4
0.6
0.8
1
1.2
1.4
1.6
1.8
Qr
Fig. 7. Relationship between SD/d50 and Qr for the third five models
4.2.
Effect of Froude number (Frd)
The main hydraulic parameter which govern with the value of local scour is Froude number. Figure 8 and for the first five models, the results show that the values of SD/d50 increase when the value of Frd also increase. The maximum value is recorded at model no. 5 with value of 347.1 when Frd equals to 9.85 with d50 equals to 0.7 mm. While the minimum value is recorded at model no. 1 was 96 when Frd equals to 2.46 with d50 equals to 1 mm. Fig. 9 shows that the maximum value of SD/d50 is recorded was 358.6 when Frd equals to 10.15 with d50 equals to 0.7 mm in model no. 10, while the minimum value of SD/d50 is recorded 113 for Frd value of 2.6 in model no. 6 with d50 equals to 1 mm. In the third five models, Fig. 10 shows that the maximum value of SD/d50 is recorded was 342.9 when Frd equals to 9.7 with d50 equals to 0.7 mm in model no. 15, while the minimum value of SD/d50 is recorded was 85 for Frd value of 2.31 in model no. 11 with d50 equals to 1 mm.
Kufa Journal of Engineering, Vol. 7, No. 1, 2016
123
400 d50 = 0.7 mm
350
d50 = 1 mm
SD/d50
300 250 200 150 100 50 0 3
4
5
6
7
8
9
10
11
12
Frd
Fig. 8. Relationship between SD/d50 and Frd for the first five models
400 d50 = 0.7 mm
350 400
d50 = 1 mm d50 = 0.7 mm
SD/d50 SD/d50
300 350
d50 = 1 mm
250 300 200 250 150 200 100 150 50 100 0 50
3
4
5
6
7
0 3
4
5
6
7
Frd
8
9
10
11
12
8
9
10
11
12
Figure 9: Relationship between SD/d50 and Frd for the second five models Frd
Fig. 10. Relationship between SD/d50 and Frd for the third five models
4.3.
Effect of Head Difference (HD)
The head difference between upstream and downstream of combined structure is one of the parameters which effect on the value of local scour. Fig. 11 and for the first five models, the results show that the values of SD/d50 increase when the value of HD/d50 also increase. The maximum value is recorded at model no. 5 with value of 347.1 when HD/d50 equals to 405.7 with d50 equals to 0.7 mm. While the minimum value is recorded at model no. 1 and was 96 when HD/d50 equals to 213 with d50 equals to 1 mm. Figure 12 shows that the maximum value of SD/d50 is recorded was 358.6 when HD/d50 equals to 407.1 with d50 equals to 0.7 mm in model no. 10, while the minimum value of SD/d50 is recorded was 113 for HD/d50 value of 217 in model no. 6 with d50 equals to 1 mm. In the third five models, Figure 13 shows that the maximum value of SD/d50 is recorded was 342.9 when HD/d50 equals to 404.3 with d50 equals to 0.7 mm in model no. 15, while the
124
Hassan A. Omran et al.
minimum value of SD/d50 is recorded was 85 for HD/d50 value of 211 in model no. 11 with d50 equals to 1 mm.
SD/d50
400 350
d50 = 0.7 mm
300
d50 = 1 mm
250 200 150 100 50 0 200
250
300
350
400
HD/d50
Fig. 11. Relationship between SD/d50 and HD/d50 for the first five models
SD/d50
400 350
d50 = 0.7 mm
300
d50 = 1 mm
250 200 150 100 50 0 200
250
300
350
400
HD/d50
Fig. 12. Relationship between SD/d50 and HD/d50 for the second five models
4.4.
Effect of Head over Weir Crest (h)
Fig. 14 and for the first five models, the results show that the values of SD/d50 increase when the value of h/d50 also increase. The maximum value is recorded at model no. 5 with value of 347.1 when h/d50 equals to 171.4 with d50 equals to 0.7 mm. While the minimum value is recorded at model no. 1 and was 96 when h/d50 equals to 44 with d50 equals to 1 mm. Fig. 15 shows that the maximum value of SD/d50 is recorded was 358.6 when h/d50 equals to 178.6 with d50 equals to 0.7 mm in model no. 10, while the minimum value of SD/d50 is recorded was 113 for h/d50 value of 49 in model no. 6 with d50 equals to 1 mm. In the third five models, Fig. 16 shows that the maximum value of SD/d50 is recorded was 342.9 when h/d50 equals to 167.1 with d50 equals to 0.7 mm in model no. 15, while the minimum value of SD/d50 is recorded was 85 for h/d50 value of 41 in model no. 11 with d50 equals to 1 mm.
Kufa Journal of Engineering, Vol. 7, No. 1, 2016
125
SD/d50
400 350
d50 = 0.7 mm
300
d50 = 1 mm
250 200 150 100 50 0 200
250
300
350
400
HD/d50
Fig. 13. Relationship between SD/d50 and HD/d50 for the third five models 400 d50 = 0.7 mm
350
d50 = 1 mm
SD/d50
300 250 200 150 100 50 0 0
50
100
150
200
250
h/d50
Fig. 14. Relationship between SD/d50 and h/d50 for the first five models
4.5.
Effect of the Discharge Coefficient (Cd)
Results show that when the value of scour depth increases, the value of Cd increases also within the same model when the values of Qact change. While SD values increases when Cd values decrease or increase at the same value of Qact and with different type of gate and same dimensions of compound weir. Fig. 17 and for the first five models, the results show that the values of SD/d50 increase when the value of Cd decreases. The maximum value is recorded at model no. 5 with value of 347.1 when Cd equals to 0.578 with d50 equals to 0.7 mm. While the minimum value is recorded at model no. 1 and was 96 when h/d50 equals to 0.29 with d50 equals to 1 mm. Fig. 18 shows that the maximum value of SD/d50 is recorded was 358.6 when Cd equals to 0.536 with d50 equals to 0.7 mm in model no. 10, while the minimum value of SD/d50 is recorded was 113 for Cd value of 0.279 in model no. 6 with d50 equals to 1 mm. In the third five models, Fig. 19 shows that the maximum value of SD/d50 is recorded was 342.9 when Cd equals to 0.597 with d50 equals to 0.7 mm in model no. 15, while the minimum value of SD/d50 is recorded was 85 for Cd value of 0.286 in model no. 11 with d50 equals to 1 mm.
126
Hassan A. Omran et al. 400
d50 = 0.7 mm
350
d50 = 1 mm
SD/d50
300 250 200 150 100 50 0 0
50
100
150
200
250
300
h/d50
Fig. 15. Relationship between SD/d50 and h/d50 for the second five models 400 d50 = 0.7 mm
350
d50 = 1 mm
SD/d50
300 250 200 150 100 50 0 0.2
0.3
0.4
0.5
0.6
0.7
0.8
0.9
1
1.1
Cd
Fig. 16. Relationship between SD/d50 and h/d50 for the third five models 400 d50 = 0.7 mm
350
d50 = 1 mm
SD/d50
300 250 200 150 100 50 0 0
50
100
150
200
h/d50
Fig. 17. Relationship between SD/d50 and Cd for the first five models
250
Kufa Journal of Engineering, Vol. 7, No. 1, 2016 400
d50 = 0.7 mm
350
d50 = 1 mm
300
SD/d50
127
250 200 150 100 50 0 0.2
0.3
0.4
0.5
0.6
0.7
0.8
0.9
1
1.1
Cd
Fig. 18. Relationship between SD/d50 and Cd for the second five models
400 d50 = 0.7 mm
350
d50 = 1 mm
SD/d50
300 250 200 150 100 50 0 0.2
0.3
0.4
0.5
0.6
0.7
0.8
0.9
1
1.1
Cd
Fig. 19. Relationship between SD/d50 and Cd for the third five models
4.6.
Derivation of New Formulas
Using the data resulted from the experimental work for the parameters of dimensional analysis, the first formula for the first five models is: 𝐒𝐃 𝐝𝟓𝟎
𝟎.𝟒𝟎𝟏
𝐲
= 𝑸𝒓 + 𝐅𝐫𝐝 𝟐.𝟖𝟕 + (𝐝 𝟑 ) 𝟓𝟎
𝐇𝐃 𝟏.𝟑𝟏
+ (𝐝 ) 𝟓𝟎
𝒉
− 𝟒. 𝟑𝟖𝟏 (𝒅 ) + 𝐂𝐝 + (𝛉𝟏 )−𝟎.𝟏𝟔𝟓 𝟓𝟎
… ... … (7)
The coefficient of determination (R2) for this formula is (0.979) For second five and third five models, the relationships are: 𝐒𝐃 𝐝𝟓𝟎
𝐲
−𝟎.𝟔𝟗𝟓
= 𝑸𝒓 + 𝐅𝐫𝐝 𝟐.𝟖𝟐𝟒 + (𝐝 𝟑 ) 𝟓𝟎
𝐇𝐃 𝟏.𝟑𝟏𝟓
+ (𝐝 ) 𝟓𝟎
𝒉
− 𝟐. 𝟓𝟔𝟏 (𝒅 ) + 𝐂𝐝 + (𝛉𝟏 )−𝟎.𝟒𝟏𝟕 𝟓𝟎
The coefficient of determination (R2) for this formula is (0.972)
… ... … (8)
128
Hassan A. Omran et al.
𝐒𝐃 𝐝𝟓𝟎
𝐲
𝟎.𝟖𝟎𝟏
= 𝑸𝒓 + 𝐅𝐫𝐝 𝟐.𝟗𝟔𝟒 + (𝐝 𝟑 ) 𝟓𝟎
𝐇𝐃 𝟏.𝟑𝟎𝟑
+ (𝐝 ) 𝟓𝟎
𝒉
− 𝟒. 𝟗𝟎𝟏 (𝒅 ) + 𝐂𝐝 + (𝛉𝟏 )𝟎.𝟑𝟐𝟔 𝟓𝟎
… ... … (9)
The coefficient of determination (R2) for this formula is (0.979) 5. CONCLUSIONS 1. Laboratory experiments have proved that the maximum depth of the scour hole values were recorded in the second group models in general and particular, these values increase in models with circular gate when compared with the other models with a rectangular and triangular gates. The maximum depth of the scour hole values were is recorded in model no. 10 with maximum value of Qr, Frd, y3/d50, HD/d50 and h/d50. The difference percentage in scour depth values between first five second five is 1.3% while between third five and second five models is 4.1%. 2. The effect of the inner angle (Ɵ1) in non-rectangular part of the compound weir seems ineffective, where values range between 10o to 60o because of changing this angle with the most influential geometric factor, y3, (i.e. the distance between lower edge of compound weir and upper edge of gate). 3. The most control hydraulic factor in the scour hole depth is Froude number in terms of the mean size of bed material (d50) where always the relationship with scour depth is positive for all models. 4. The size of the depositions changes with the depth of the scour hole where whenever the hole depth are increased as a result from the free fall of water from the edge of the compound weir, the deposition of sediments was more, while the flow through the gate is helping to move these sediments away and make the form of deposition seem more flat. 5. Whenever the weir width increased, the scour hole generated becomes more flat even with the increase in the value of discharge passing through it. 6. REFERENCES Dehghani, A. A., Bashiri, H., Dehghani, N., 2010. Downstream Scour of Combined Flow Over Weirs and Below Gates. River Flow – Dittrich, Koll, Aberle & Geisenhainer. Ahmed, A. A., 2007. Experimental study to investigate local scour downstream weirs, gates and combined gates. PhD. Thesis, University of Mousel. Dehghani, A.A., Bashiri, H., Shahmirzadi, M.E.M., 2010. Local Scouring due to Flow Jet at Downstream of Rectangular Sharp – Crested Weirs. WSEAS Press. Sobeih M. F., Helal, E. Y., Nasrallah, T. H., Abdelaziz, A. A., 2012. Scour Depth Downstream Weir with Openings. International Journal of Civil and Structural Engineering, Volume 3, No.1. USBR, 2001. Water Measurement Manual. U. S. Department of the Interior, Bureau of Reclamation, Revised Reprinted of Third Edition. Murthy, V. N. S., 2002. Geotechnical Engineering: Principles and Practices of Soil Mechanics and Foundation Engineering. Marcel Dekker, Inc., First Edition. Chanson, H., 2004. The Hydraulics of Open Channel Flow: An Introduction. Butter Worth Heinemann, Second Edition.