of cores from the Cheyenne River arm of Lake Oahe, South Dakota, U.S.A. ... produced around Lead, South Dakota. ... ited by over two million people annually.
Chemical Geology, 67 (1988) 17-33
17
Elsevier Science Publishers B.V., Amsterdam - - Printed in The Netherlands
THE EFFECT OF MINING ON THE SEDIMENT-TRACE ELEMENT GEOCHEMISTRY OF CORES FROM THE CHEYENNE RIVER ARM OF LAKE OAHE, SOUTH DAKOTA, U.S.A. A R T H U R J. H O R O W I T Z 1, K E N T A. E L R I C K 1 a n d E D W A R D C A L L E N D E R 2 1U.S. Geological Survey, DoraviUe, GA 30360 (U.S.A.) zU.S. Geological Survey, National Headquarters, Mail Stop 432, Reston, VA 22092 (U.S.A.) (Received October 16, 1986; revised and accepted June 17, 1987)
Abstract Horowitz, A.J., Elrick, K.A. and Callender, E., 1988. The effect of mining on the sediment-trace element geochemistry of cores from the Cheyenne River arm of Lake Oahe, South Dakota, U.S.A. Chem. Geol., 67: 17-33. Six cores, ranging in length from 1 to 2 m, were collected in the Cheyenne River arm of Lake Oahe, South Dakota, to investigate potential impacts from gold-mining operations around Lead, South Dakota. Sedimentation rates in the river arm appear to be event-dominated and rapid, on the order of 6-7 cm yr. 1. All the chemical concentrations in the core samples fall within the wide ranges previously reported for the Pierre Shale of Cretaceous age and with the exception of As, generally are similar to bed sediment levels in the Cheyenne River, Lake Oahe and Foster Bay. Based on the downcore distribution of Mn, it appears that reducing conditions exist in the sediment column of the river arm below 2-3 cm. The reducing conditions do not appear to be severe enough to produce differentiation of Fe and Mn throughout the sediment column in the river arm. Cross-correlations for high-level metal-bearing strata within the sediment column can be made for several strata and for several cores; however, cross-correlations for all the high-level metal-bearing strata are not feasible. As is the only element which appears enriched in the core samples compared to surface sediment levels. Wellcrystallized arsenopyrite was found in high-As bearing strata from two cores and probably was transported in that form from reducing sediment-storage sites in the banks or floodplains of Whitewood Creek and the Belle Fourche River. It has not oxidized due to the reducing conditions in the sediment column of the Cheyenne River arm. Some As may also be transported in association with Fe- and Mn-oxides and -hydroxides, remobilized under the reducing conditions in the river arm, and then reprecipitated in authigenic sulfide phases. In either case, the As appears to be relatively immobile in the sediment column.
1. Introduction Beginning with the original discovery of gold at Deadwood Gulch, South Dakota, in 1875, through the present, significant volumes of mining, milling and processing wastes were produced around Lead, South Dakota. Until December 1977, most of this material was dis-
charged directly into Whitewood Creek and its tributaries. From Whitewood Creek, the material was transported to the Belle Fourche River, thence to the Cheyenne River, and finally into the Missouri River. Although the discharge of solid waste ceased in late 1977, large amounts of oxidized and unoxidized waste remain in storage on and in the banks and floodplains of
18
these rivers (Goddard, 1987). It has been estimated that ~ 50-60% of the discharged solid wastes is located in the banks and along the floodplains of Whitewood Creek and the Belle Fourche River (Marron, 1986). Measurements in June 1971 indicated that daily discharge into Whitewood Creek amounted to ~ 2700 t .t of suspended solids (U.S.E.P.A., 1973 ) ; if this is typical of modern mining operations, then ~ 75.106 t of solids have been discharged over the last 80-90 years and 35" 106-45 • 106 t of this material are in storage and are slowly being released to the environment. This area has been the subject of several studies, some quite intensive, dating back to the mid- 1960's, which entailed the analysis of water, sediment and biota (U.S.E.P.A., 1973; Stach et al., 1978; Phillips etal., 1984;U.S.F.W.S., 1985; Marron, 1986; Goddard, 1987). The major elements of concern in the discharged material, and in sediments stored in the banks and floodplains are As, Cd, Se and Hg. The first three are from the ore bodies themselves while the Hg is present due to its use in the gold recovery process. Measurements in 1970 revealed Hg discharges on the order of 5.5-18 kg day -1 (U.S.E.P.A., 1973). The use of Hg ceased in late 1970. Arsenic discharges, until 1977, averaged some 95 t day-1, mostly in the form of arsenopyrite (U.S.E.P.A., 1973; Goddard, 1987). Thus, there are potentially ~ 1.9-10G-2.3 - l0 s t As in storage along the rivers. The Whitewood Creek-Belle Fourche -Cheyenne River system is the subject of a major ongoing study under
has a maximum depth of 62 m, and a shoreline length of 3620 km (U.S.A.C.E., undated). The reservoir is a major recreational site and is vis ited by over two million people annually (U.S.A.C.E., undated). Lake Oahe, and partic~ ularty the Cheyenne River arm of the lake, represents a major receiver of the mining, milling. and processing wastes still being released from theWhitewoodCreek-BelleFourche-Cheyenne River system. Studies have shown elevated Hg, As and Se levels in surficial sediments, iish and birds sampled in the Cheyenne River arm and Lake Oahe (Phillips et al., 1984; U.S.F.W.S_ 1985; Goddard, 1987). As an adjuncl t~) the U.S.G.S.' Whitewood Creek-Belle Fourchc study, investigations were also carried out in the Cheyenne River arm of Lake Oahe. The intent of these studies was to determine both the chemical depositional history in the area and the levels and distribution of metals in the sediment column. If possible, contributions f'rom the Whitewood Creek-Belle Fourche-Cheyenne River system would be identified and quantified.
2. Experimental section 2.1. Sample collection and on-site procedure.~ A series of six cores were obtained along the line of the Old Cheyenne River channel be-
the U.S. Geological Survey's (U.S.G.S.) Surface Water Toxics Program, which was initiated in 1985. Until 1958, unrestricted flow permitted the transport of sediment down the Whitewood Creek-Belle Fourche-Cheyenne River system into the Missouri River. In 1958 the Missouri was dammed just above Pierre, South Dakota; this led to the formation of Lake Oahe. This
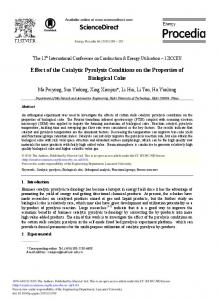
tween the present mouth of the Cheyenne River. through the Cheyenne River arm of Lake Oahe. to the lake proper (Fig. 1. ). The line of the old river channel was located by fathometer and was selected for two reasons: (1) to obtain, if' possible, samples from the channel deposited prior to the closing of the Missouri River by the Oahe Dam in 1958; and (2) to avoid contact with the numerous tree trunks which still extend above the sediment from the former river banks, which were submerged after 1958. Cores were obtained using a Benthos ®'.2 gravity corer with
reservoir, at maximum pool, covers 1300
*~The use o f t r a d e or p r o d u c t n a m e s in t h i s p a p e r is for
• ~ t = 1 m e t r i c t o n n e = 10 3 kg.
k m 2,
identification p u r p o s e s only, a n d does not c o n s t i t u t e e m d o r s e m e n t by t h e U.S. Geological Survey.
19
....,O,0o_30
,~.
.
.
.
.
0.
.
.
.
,.
.
.
--
. ..~ . ~ .
.
i2:o~ /
I
so';
@21
~
~ O uTa~O:ipO....
f-~I~
EXPLANATION
~',\
:~o AHE DAM
\
i
~
A2 CORE SITE AND IDENTIFICATION NUMBER
40, ,YIo ~,0,
m,,,, ,,2~o.ooo,,9~4
.
.
.
.
.
.
J.
O
, ',
,',
' ' 5
.
.
~-10
.
115
'~ .
-20
.
.
.
44 i~'
I 25 KILOMETERS -
-
Fig. 1. Map showJn6 the location of the cores taken in the Cheyenne River arm of Lake Oahe.
either a 4- or 8-ft. ( ~ 122 or ~ 244 cm) plasticlined barrel. Several cores were obtained at each site for different purposes. Those destined for trace-metal analysis were extruded on-site using a series of rubber stoppers into the plastic core liner. Specific sections were excised from each core. Usually the entire core was sampled; care was taken to limit samples to single bands in the cores. Once a section was obtained, it was placed immediately in a large-mouth plastic bottle, chilled on ice to 4°C in a cooler, and shipped to Atlanta, Georgia, for subsequent processing and chemical analysis. Individual
sample bottles were kept refrigerated until processing could begin.
2.2. Laboratory processing and analytical procedures Individual sample bottles were removed from the refrigerator and thoroughly homogenized using acid-rinsed glass rods. Subsamples were then removed, placed in porcelain evaporating dishes, and freeze dried. The remaining sample was returned to the refrigerator for storage. Chemical analyses for Fe, Mn, A1, Ti, Cu, Zn,
20 Cd, Pb, Ni, Co, Cr, As, Sb, Se and Hg were carried out on freeze-dried samples following the procedures of Horowitz and Elrick (1985), and Elrick and Horowitz (1985, 1987 ). For all elements other than As, Sb, Se and Hg, 500-mg samples were digested with a combination of HF-HCIO4-HNOa acids in Teflon * beakers at 200 ~C; the resulting salts were brought into solution with 50 ml of 2% HCt. Quantification was by flame atomic absorption spectrophotometry using a Varian ® model AA-975 and mixed salt standards. The determination of As, Sb and Se used the same digestion but final solutions were made up in 50% HC1. Quantification was by hydride generation and atomic absorption spectrophotometry using a Varian ® VGA-76 hydride generator and the AA-975. Hg was determined using a 500-mg sample digested with LeFort aqua regia at 100°C with quantification by a cold vapor technique using the VGA-76 '~ systern in conjunction with the AA-975 ~. Precision and bias (generally better than +_10%) were monitored by replicate analyses of selected samples and by the concomitant digestion and analysis of National Bureau of Standards sediment and U.S.G.S. rock standards. Total volatile solids (loss on ignition) was used as a measure of the organic carbon, sulfur and water of hydration in each sample and was determined following the procedures outlined in Skougstad et al. (1979). This entailed the ignition of pre-weighed samples and their subsequent re-weighing after 1 hr. at 550 ° C in a muffle furnace. Analytical results for all the samples are given in Table I; Cd has been omitted because almost all the samples had concentrations below the detection limit of 0.5 ppm. 3. R e s u l t s a n d d i s c u s s i o n
3.1. Core descriptions With slightly slightly banded
the exception of core 5, which was over 2 m in length, the cores were all longer t h a n 1 m, All cores a r e heavily with large sections being buff or dark-
olive gray. Thin-black or mottled-black sections were interspersed throughout the cores. Visual inspection of these black bands indicates the presence of large pieces of organic d e tritus including leaf, plant and wood f r a g m e n t s Microscopic examination of this material con firmed this finding and also revealed ~ha~ ~he finer organic matter present was trapping in organic sediment particles. Confirmatio~ of this was obtained when the organic matrix was destroyed with 30% H202, leaving behind a large number of sediment grains. A number ~f the grains were black; these could be detrital or a~ thigenic sulfides. Some of the cores have as many as 40 clearly recognizable and distinct color bands. Several sections within each core appear to contain gas pockets (possibly m e t h a n e ) . These seem t:o be associated with the darker colored bands m the cores, predominantly the dark-olive gray and mottled sections. When some of' the cores were extruded from their liners, a slight odor af H2S (hydrogen sulfide) could be detected. 3.2. Chemical data and initial downcor~ patterns All the chemical concentrations for the cores, as well as those for LOI (loss on ignition, lot al volatile solids ) , fall within the fairly wide ranges previously reported for the Pierre Shale ( B a r nett, 1961; Radar and Grimaldi, 1961; T o u r t e lot, 1962; Schultz, 1964; Schultz et al., 1980; see Table II). The As and Se values are similar to those reported by the U.S.F.W. (1975) for Foster Bay (within the Cheyenne River arm) but the Hg levels found in the present study are an order of magnitude lower (Table II). On the other hand, Se and Hg averages and ranges reported by Phillips et al. (1984); for Lake Oahe sediments are similar to those reported here (Table II). Finally, the core values are similar to those found for three bottom sediments cotlected in the Cheyenne River earlier in the year ( Table II ). Of the metals cited in Section I ( As,
21 TABLE I
Chemical composition of core samples from the Cheyenne River arm of Lake Oahe Sample interval (cm)
(ppm)
(wt.% I
Cu
Zn
Pb
Ni
Co
Cr
As
Sb
Se
Hg
Fe
Mn
AI
Ti
LOI*
32 29 34 27 29 30 29 32 34 32 30 30 28 27 31 29 29
124 117 121 105 123 134 124 126 131 126 132 132 130 117 132 142 146
15 14 17 17 12 18 9 14 15 12 16 14 12 14 12 15 20
40 32 37 25 46 42 30 38 45 40 40 40 40 33 42 45 48
14 15 14 13 18 14 16 14 15 14 16 13 16 15 15 14 16
89 81 82 57 81 86 91 90 87 92 85 90 84 67 84 96 97
28 30 120 27 32 29 20 74 50 36 37 22 11 21 25 10 6,6
1.6 1.0 1.6 1.2 2.0 1.1 1.1 0.9 1.6 1.6 1.1 1.1 1.1 1.0 1.1 1.0 1.1
1.2 0.9 1.1 0.5 0.8 0.9 1.2 1.1 1.1 0.9 0.9 0.9 1.0 0,7 1.0 1.0 1.1
0.02 0.09 0.12 0.04 0.06 0.06 0.05 0.11 0.06 0.06 0.07 0.06 0.04 0.09 0.14 0.06 0.06
3.8 3.9 4.5 3.9 3.8 4.2 3.8 4.7 4.3 4.6 4.2 4.1 3.8 3.8 4.0 4.2 3.9
0.30 0.08 0.06 0.07 0.06 0.10 0.11 0.10 0.09 0.08 0.08 0.08 0.05 0.08 0.{)6 0.05 0.05
7.9 7.8 8.0 7.5 8.4 7.6 7.5 8.2 8.0 7.8 8.4 7.7 8.2 8.0 8.0 8.4 8.3
0.38 0.43 I).38 0.35 0.36 0.38 0.40 0.43 0.37 0.37 0.43 0.41 0.41 0.38 0.42 0.43 0.44
11.2 8.0 10.6 10.3 13.2 6.3 7.9 8.5 9.1 10.8 8.t} 7.:~ 7.1} 7.5 6.7 7.7 6.4
31 28 26 27 25 28 32 31 29 27 29 28 28 28 28 28
118 110 115 121 104 122 119 120 129 119 114 114 125 126 127 125
19 12 19 19 18 18 14 21 22 20 21 23 20 22 19 18
38 31 28 34 24 33 37 39 38 28 34 35 37 37 35 32
14 14 12 12 15 12 14 13 14 15 11 12 13 14 13 16
82 80 61 72 50 65 80 77 81 56 78 70 69 74 73 69
20 14 12 32 24 33 45 20 19 17 18 15 19 19 14 17
1.6 1.2 0.9 0.9 1.2 0.9 1.2 1.2 0.9 0.9 1.2 1.2 0.9 0.8 0.9 0,9
1.3 0.9 0.6 0.6 0.3 0.7 0.9 0.8 0.8 0.4 0.7 0,6 0.5 0.6 0.5 0.5
0.02 0.06 0.05 0.07 0.04 0.08 0.04 0.05 0.06 0.03 0.04 0,16 0.07 0.50 0.26 0.05
3.8 3.8 3.8 4.0 3,9 4.0 4.2 4.1 4.1 4.0 4.1 4.2 4.0 4.1 4.0 4.1
0.09 0.07 0.07 0.06 0.06 0.07 (}.05 0.04 0.05 0.06 0.04 0.05 0.05 0.05 0.05 0.05
7.4 7.4 7.0 8.0 7.5 7.7 7.8 8.3 8.3 8.0 8.3 7.8 8.5 8.7 8.2 8.4
0.38 0.33 0.33 0.41 0.33 0.40 0.38 0.37 0.42 0.38 0.37 0.34 0.40 0.40 0.40 0.39
10.8 10,4 7,3 11.,4 9,0 8.5 7.3 11.3 7.3 7.8 9.4 9.3 7.6 7.3 7.8 8.6
34 35 35 35 36 27 33 32 35
140 145 138 141 145 108 151 156 140
14 13 18 20 19 24 10 15 19
48 47 49 50 50 29 47 49 49
15 16 12 14 13 10 16 15 13
90 82 91 90 86 51 98 95 92
11 8 12 11 19 14 10 7.7 13
1.2 1.2 1.6 1,2 1.6 1.2 1.2 1.1 1.6
1.1 1.3 1,3 1.2 1.2 0.4 1.3 1.1 1.2
0.02 0.06 0.09 0.06 0.04 0.14 0.06 0.05 0.07
4.0 3.7 4.3 4.1 4.2 4.0 4.1 4.0 4.0
0,13 0.06 0.09 0.10 0.07 0.06 0.07 0.09 0.07
7.6 8.0 7.0 7.9 7.5 7.4 7.7 7.5 7.4
0.37 0.40 0.37 0.37 0.38 0.34 0.42 0.40 0.38
12.2 8.8 9.4 9.8 9.6 11.2 6.5 6.8 8.7
Core 1: 0 1 4 8 11 12.5 16.5- 21 22,5- 23 23 - 25 27.5- 31 35 - 38 46 - ,19 53.5- 55 59 - 63 67 - 71 75 79 83 87 91 95 99 103 107 -111
Core 2: 0 3 9 12 17 27 37 44 47 55 65 70 80 90 100 105
-
3 6 11 14 20 30 42 47 52 60 70 75 85 95 -105 -110
Core 3: 0 - 2 4 - 7 10 - 13 13 - 16 20 - 23 28 - 32 35 - 39 46 - 50 58 - 62
22 T A B L E I (continued) Sample interval (cm)
(ppm) Cu
(wt.%) Zn
Pb
Ni
Co
Cr
33 32 33 31 33 34 37 32 32
160 150 145 141 158 146 157 155 154
16 12 17 17 13 18 18 16 17
51 46 52 45 51 50 52 48 50
14 16 15 18 17 11 15 14 14
89 89 80 77 83 97 95 88 87
27 29 29 26 30 29 27 34 31 31 34 30 26 26
103 115 116 106 115 111 112 130 114 123 142 129 113 115
19 21 20 21 18 23 23 19 17 23 16 18 21 16
20 26 26 27 29 26 25 43 40 39 42 38 30 30
tt 16 15 15 16 16 16 19 11 13 17 13 13 9
31 30 32 31 27 32 31 32 37 31 31 30 32 36 30 30 32 32 32 31 30 31 28
135 133 132 131 121 117 119 126 124 134 125 130 134 123 127 132 128 120 126 141 133 120 121
10 9 15 12 15 17 16 14 26 22 18 16 19 19 21 20 19 20 19 13 17 18 19
44 43 43 38 33 37 45 46 36 42 37 37 39 37 40 49 42 34 36 45 53 30 37
10 9 10 11 10 14 14 14 12 9 11 11 10 13 10 11 11 14 14 11 17 12 17
As
Sb
Se
Hg
Fe
Mn
AI
't'~
LOF
15 11 10 14 11 8 7.9 6 6
1.2 1.2 1.3 1.3 1.2 1.2 1.3 1.2 1.2
1.2 1.3 1.4 1.3 1.1 1.2 1.2 1.2 1.2
0.06 0.05 0.06 0,05 0.06 0.06 0.04 0.06 0.05
4.6 4.2 3.9 3.5 4.2 4.3 4.0 4.2 4.1
0.09 0.09 0.09 0.08 0.09 0.07 0.08 0.08 0.08
7.4 7.8 6.4 7.4 8.4 6.8 8.4 7.3 7.2
().i~ (L4} t~.l~; (}.~(~ 0.4:~
6.2 6~3 6,4 6,:~ ,L,=
(),3,~;
9.'2
(1.4() ().5(~ o/~7
83) 5,? 5.5
45 43 52 52 59 38 43 85 83 79 94 83 62 43
12 13 11 14 25 13 13 56 78 27 44 37 26 22
0.8 1.0 1.0 0.9 1.0 1.0 1.0 1.2 1.2 1.1 1.1 1.0 0.9 0.9
0.3 0.3 0.2 0.3 0.5 0.2 0.2 0.9 1.1 0.7 0.8 1.0 0.6 0.4
0.06 0.02 0.02 0.03 0.04 0.02 0.02 0.09 0.05 0.06 0.07 0.08 0.05 0.05
3.5 3.8 3.7 3.5 3.8 3.8 3.8 4.2 4.2 3.9 4.3 4.2 3.9 3.9
0.06 0.06 0.06 0.06 0.07 0.06 0.06 0.07 0.06 0.07 0.07 0.07 0.07 0.07
7.3 7.4 7.6 7.2 7.2 7.4 7.6 8.3 7.6 7.7 8.3 7.2 7.4 7.1
0.:~7 :.:C 0.4} ().5~ 0.39 ()~5~ 0.4() 0.42 !)S; (t.41 0.42 ().3, ~ 0::~;-; 0.33
/5.0 11.6 11.4 9.3 i0.] it.1 9.3 7.8 9.(~ 6,8 7.8 6.9 8.i 7.{5
77 84 84 82 67 82 83 89 80 87 80 71 86 77 86 72 80 79 84 81 60 75 66
20 15 45 76 35 35 29 32 170 27 25 64 41 180 22 38 90 90 68 27 29 80 44
1.1 1.1 1.0 1.0 0.9 1.2 1.2 1.2 1.6 1.6 1.2 1.0 1.2 1.2 1.2 1.6 1.2 1.2 1.2 1.1 1.6 1.2 1.2
0.8 0.8 0.8 0,9 0.5 0.8 0.8 1.0 0.9 1.1 0,7 0.6 0.9 0.9 0.9 1.0 1.0 0.7 0.8 0.9 1.2 0.6 0.';
0.07 0.06 0.14 0.14 0.07 0.07 0.06 0.04 0.14 0.03 0.05 0.14 0.12 0.62 0.21 0.08 0.15 0.40 0.30 0.07 0.06 0.31 0.08
3.9 3.8 4,2 4.3 4.1 3.9 3.5 3.8 4.8 3.8 3.8 4.3 4,1 4.8 3.9 3.7 3.8 4.7 4.3 4.0 3.8 4.2 3.7
0.13 0.10 0.09 0.09 0.10 0.08 0.10 0.10 0.15 0.09 0.10 0.11 0,08 0.12 0.07 0.06 0.07 0.09 0.07 0.06 0.10 0.09 0.06
6.9 6.9 7.6 8.0 7.4 7.3 "7.0 7.9 7.5 7.5 7.5 7,3 8.3 7.8 7.7 7.7 7.6 8.2 8.3 7.0 7.4 8.0 8.6
0.~5 0.33 0.~4 0.36 0.33 (3.;38 ().3~'; 0.38 0.37 0.39 0.37 0.35 0.41 0.38 0.37 0.35 0.36 0.38 0.39 0.35 0,35 0.3'7 0.,3~:~
8.0 7.9 8.7 7.8 8.6 ! 1.(~ 11.2 10.5 11.4 9.7 }0.6 9.0 1(i}.8 10.3 10.1 12.5 1:I.0 11.5 11.5 8.9 t2.3 10.8 13.2
Core 3 (cont.): 66 65 70 72 80 88 96 108 112
- 70 - 69 - 74 - 76 - 84 - 92 -100 -112 -116
Core 4." 0 6 15 26 35 44 53 62 71 80 91 100 110 112
- 3 - 9 - 18 - 30 - 39 - 48 - 57 - 66 - 75 - 84 - 95 -104 -112 -114
Core 5. 0 2 -
2 4 4 6 6 - 8 8 - 10 10.5- 15 31 - 32 32 - 37 50 - 53 53 - 58 58 - 63.5 63,5- 67.5 67.5- 72 72 - 76 76 - 82.5 83 - 85 91.5- 99 95 -101 101 -106.5 106.5-107.5 114.5-116.5 123.5-127 138.5-139
23 TABLE I (continued) Sample interval (cm)
(ppm) Cu
(wt.%) Zn
Pb
Ni
Co
Cr
As
Sb
Se
Hg
Fe
Mn
A1
Ti
LOI*
29 32 29 36 35
119 120 136 121 131
21 17 14 17 16
34 33 43 35 39
13 12 8 14 15
83 75 58 78 89
52 100 140 100 68
1.2 1.2 1.0 1.2 1.2
0.7 0.6 0.7 0.9 1.2
0.08 0.32 0.28 0.52 0.30
4.0 4.6 4.4 4.7 4.6
0.04 0.07 0.06 0.08 0.07
8.3 7.9 6.6 8.0 8.3
0.39 0.38 0.30 0.37 0.38
10.1 9.0 9.3 8.3 8.4
32 34 33 33 35 31 36 38 32 30 34 35 18 17 20 19
122 135 124 124 140 121 108 145 122 115 113 109 79 87 101 85
18 16 15 18 18 19 24 16 18 20 23 17 17 17 17 20
37 39 44 45 45 49 34 43 44 41 35 32 25 26 31 31
14 16 12 10 16 12 11 15 12 12 12 10 11 12 16 14
75 83 84 85 81 80 61 90 74 70 72 67 47 47 54 51
30 60 32 26 68 44 150 125 44 42 106 260 44 28 9.8 9.7
1.2 1.1 1.2 1.2 1.2 1.4 1.4 1.2 1.4 1.4 1.2 1.2 1.0 1.0 1.0 1.1
0.9 0.7 1.0 0.8 0.8 1.2 1.0 0.7 1.3 1.5 0.8 1.0 0.8 0.5 0.6 0.5
0.05 0.08 0.08 0.10 0.12 0.12 0.34 0.41 0.11 0.12 0.24 0.29 0.05 0.05 0.04 0.03
3.9 4.3 4.1 4.2 4.3 4.0 4.5 4.4 4.2 4.1 4.3 5.1 2.8 2.9 3.2 2.8
0.12 0.09 0.11 0.10 0.09 0.06 0.10 0.09 0.06 0.06 0.06 0.10 0.05 0.08 0.06 0.06
7.8 8.3 8.0 7.7 7.9 7.6 7.2 9.1 7.6 8.0 7.8 6.9 4.7 5.2 5.9 5.3
0.40 0.41 0.35 0.34 0.41 0.33 0.30 0.42 0.32 0.33 0.36 0.34 0.33 0.36 0.36 0.35
12.5 9.9 12.6 11.4 10.0 12.2 9.8 11.5 10.5 12.4 8.5 7.6 6.8 5.1 6.1 4.8
Core 5 (cont.):
147 152.5 165.5-170.5 178 -179 179 188 195 201 Core 6:
0 - 2 4 - 6 10 - 13 17 - 23.5 28.5- 35 38 - 40.5 43 - 44.5 48.5- 49.5 54.5- 57.5 60 - 61 66 - 74.5 74.5- 84 84 - 87 95 -103 111 -119 127 -133
*LOI = loss on ignition, total volatile solids. Cd, S e a n d H g ) , o n l y t h e A s a n d a f e w o f t h e Hg values appear to be elevated, D o w n c o r e p a t t e r n s f o r F e , A1, T i , C u , P b , C o and Sb are fairly constant except for core 6 (bel o w 84 c m ) w h i c h w i l l b e d i s c u s s e d l a t e r ( t h i s page); the patterns for Zn, Ni, Cr and Se display more variability (Table I). The distributions of Hg and As are highly variable with the f o r m e r r a n g i n g f r o m 0.02 t o 0.62 p p m a n d t h e l a t t e r f r o m 6 t o 260 p p m ( T a b l e I ) . L O I a l s o d i s p l a y s m a r k e d v a r i a b i l i t y r a n g i n g f r o m 5% t o 15 % ( T a b l e I ). T h e h i g h e s t L O I v a l u e s t e n d t o o c c u r i n t h e s u r f i c i a l s e d i m e n t s ( c o r e 5 is a n exception), M n is a l m o s t a l w a y s h i g h e s t , s o m e t i m e s sign i f i c a n t l y so, w i t h i n t h e t o p 2 - 3 c m o f t h e c o r e s a n d t h e n d e c r e a s e s ( T a b l e I ) . T h i s is a c l a s s i c pattern for a change from oxidizing (top of core) to reducing (below 2-3 cm) conditions
a n d is d u e t o d i s s o l u t i o n o f M n O 2 a n d i t s s u b sequent upward diffusion; reprecipitation of MnO2 occurs when oxidizing conditions are ree n c o u n t e r e d (e.g., K r a u s k o p f , 1 9 5 7 ) . T h e loc a t i o n o f t h e o x i c - a n o x i c b o u n d a r y is s u p ported by the chemical data from the interstitial water. The patterns of post-depositional remobilization of the Mn are particularly noticea b l e i n c o r e s 1 a n d 3. T h e e x c e p t i o n t o t h i s p a t t e r n is c o r e 4 w h i c h w a s o b t a i n e d a t t h e Cheyenne River end of the Cheyenne River arm w h e r e M n is e s s e n t i a l l y c o n s t a n t t h r o u g h o u t t h e length of the core (Table I). The high physical energy at this site (when the Cheyenne River first enters the lake) may have prevented the formation and/or deposition of a thin surficial oxidizing band of sediment typical of the other cores. C o r e 6, a l t h o u g h n o t t h e l o n g e s t c o r e i n t h e
24
TABLE
II
Means and ranges for metal concentrations for rocks and sediments in the area of the Cheyenne River arm Unit
Ele-
This study
Pierre Shale "~
Cheyenne River "2
merit
(n=92)
(n=80)
(r~=3}
wt.~;
Fe Mn AI Ti
ppm
('u Zn Pb Ni (io Cr As Sb Se Hg
wt.% "~From "'~From ":~From "~From
( ) M "'~
4.(i) ( 0.08( 7.7 ( 0.38 ( 31 125 18 38 14 76 40 1.2 0.9 0.11
2.8 0.04 4.7 0.30
5.1 )'~' 0.30) 9.1 ) 0.44)
(17 - 38 (79 158 ( 9 - 26 (20 53 9 19 38 98 7 260 0.8 2.0 0.2 1.5 0.02 0.62
9.5
4.8 - 15.0 )
3.2 ( 0.07( 7.6 ( 0.35 ( 34 106 22 35 12 75 14 3.7
-(
1.4 0.01 3.3 0.05-
7.2 ) 5.0 ) 9.5 ) 0.50)
{ 3 (10 ( 3 ( 5 ( 5 ( 1 ( 3
100 -400 40 500 - 50 500 100
( 1
-200
0.2 - 15
)
3.4 ( 0.05( 8.6 ( 0.31 ( 22 97 14 26 15 57 28 1.0 0.8 0.05
3.3 0.057.3 0.30
L a k e O a h e "~ (r~=41)
F o s t e r B a y "~ (n=22)
3.5 ) 0.06) 9.8 ) 0.32)
(21 -22 ) (95 -98 } (11 15 ) (23 -28 ) (13 16 ) (53 -63 ) (23 35 ) ( 1.0} ( 0.6 -- 1.1 ) ( 0.04- 0 . 0 7 )
16 0.64 ( 0 . 1 8 1.55) 0.06 ( 0 . 0 2 0 . 0 9 )
0.7 10
2.2 65 63
17 5 7 6 4 5 57
Totals
101
As (ppm) 150 200 290 280 190 160 160
Core 6 (74.5-84 cm) fraction cont.* 1 (ppm) 26 10 20 17 8 8 1 180 (180) 2
sample (%) 12 9 12 25 14 9 19 100
As (ppm)
fraction cont.* (ppm)
100 120 170 440 ,110 170 200
12 11 20 110 57 15 38 263 ( 260 ) ~
"~Fraction c o n t r i b u t i o n - - obtained by multiplying t h e chemical concentration in t h a t fraction by the percent t h a t the size fraction represents in the sample; values in the row marked "totals" are the sum of all the size fraction contributions. *The numbers in parentheses are the concentrations in the original u n f r a c t i o n a t e d samples.
of the As is due to the presence of arsenopyrite which came from storage sites in the bed and banks of Whitewood Creek and the Belle Fourche River. Transport of the arsenopyrite could occur during major storm/runoff events into the river arm. Although arsenophyrite is metastable under oxidizing conditions, which are likely during transport, it does exist in the bed and bank material (Goddard, 1986; Marron, 1986). If the transport to the River arm was rapid, and sedimentation rates were high, which appears to be the case, some of the arsenopyrite could be preserved in the sediment column. This is especially true if burial was rapid and reducing conditions prevailed soon after deposition. Whether the As is associated with detrital arsenopyrite, or authigenic sultides, it appears to be relatively immobile under the existing reducing conditions in the sediment column. This view could be supported by the As concentration gradients in the interstitial water which tend to increase with depth from the ppb range near the surface to the ppm range further downcore. The interstitial water pattern for As is similar to that reported for Loch Lomon in Scotland, U.K. (Farmer and Lovell, 1986) where the majority of the As is
associated with Fe- and Mn-oxides. However, the surficial sediment layers in the Loch are enriched in As while those collected in this study are not. This further supports the view that the As in Lake Oahe sediments appears relatively immobile. It could be argued that the pattern in the river arm interstitial water and sediments could also occur if As was diffusing and migrating out of the sediment column into the overlying water. However, this seems unlikely as diffusing As would likely redeposit, in association with Fe~ and Mn-oxides, in surficial sediments. The surficial lake sediments do not contain significant As levels. Sampling and analysis of the water column in the river arm may further clarify this point and are planned for the future (summer of 1986). The Fe and Mn correlations cited above are more problematic as they do not appear to support the view that reducing conditions exist within the sediment column; in other words, the classical pattern of Fe and Mn differentiation under reducing conditions has not occurred throughout the river arm (Krauskopf, 1957; Bonatti et al., 1971). However, work by Duchart et al. (1973), in Loch Fyne, Scotland, has shown that Fe and Mn may coexist under re-
28 ducing conditions. In strongly reducing environments, the classical differentiation pattern tends to occur; however, when reducing conditions are less severe, Fe and Mn can precipitate contemporaneously as carbonates (Duchart et al., 1973; Berner, 1981 ). It is possible t h a t oxidizing pockets may exist in some of the cores, in which case both Fe- and Mn-oxides could coexist, or t h a t although reducing conditions prevail, complete solubilization of the Mn-oxides has not occurred as yet.
3.6. Normalized downcorepatterns Based on the differences between the correlations for the entire data set, and those for individual cores, it appears t h a t some downcore variations may be obscured or missed by using correlation coefficients and the entire data set. To further clarify downcore metal patterns, and interelement relations, individual plots of the doubly normalized data, vs. depth, were prepared for each core (Figs. 2 and 3 are examples and are for cores 1 and 5, respectively). Examination of these plots reveals t h a t all the cores, even core 4, show evidence of Mn remobilization with high, or the highest Mn "levels" (bear in mind t h a t the plots are of ratios, not concentration) appearing in the surficiat sediment. Based upon the behavior of Mn, the cores can be divided into two groups. Group l conrains cores 1-4 (e.g., Fig. 2) and group 2 contains cores 5 and 6 (e.g., Fig. 3). In the group1 cores, the highest Mn levels are found in the surficial sediment and downcore levels never approach the surficial ones (Fig. 2 fbr core 1 as an example). In the group-2 cores, Mn is also high in the surficial sediment and decreases downcore; however, there are downcore Mn "pockets" which are as high, or higher, t h a n the surficial levels (Fig. 3 for core 5 as an example). This may imply t h a t reducing conditions in group 1 are stronger t h a n in group 2, or t h a t there may be oxidizing pockets within some parts of the latter group, All the cores display very distinct metal max-
ima. Usually there is one dominant peak and several secondary ones (Figs. 2 and 3 ~. Almosl all the metal peaks are associated with the black bands, or with bands which contain black inclu sions or mottling. The metal maxima appear t~ be associated with peaks in both Fe and M~I Occasional exceptions to this pattern ~ccur for As and Hg in t h a t they display peaks slightly higher in certain cores, than the other metals~ For example, in core 2, a metal maxima occur,~ at ~ 45 cm, the As maxima occurs one ~ampte higher at ~ 40 cm; in core 4, a metal maxim~i occurs at ~ 73 cm, the Hg maxima ~;ccurs one sample higher at ~ 64 cm. Attempts t(J identif, equivalent chemical strata between cores, using the metal maxima as markers, do not work very well, especially for the entire core set. For ex ample, cores I and 2 have peaks between l [ and 14 cm, which are not found in the ~ther tt~ur cores. In addition, the dominant metal peak m core 2 occurs between 44-47 cm while that m core 1 occurs between 22.5.~23 cm. C~res 2-5 have metal peaks at ~ 70-75 cm, only some ~,; these are d o m i n a n t for individual c~res: however, these peaks are lacking in cores [ and ~'. Some offset of strata may be expected becaus~ of the location of the core sites in relat~o~ to the m o u t h of the Cheyenne River arm and the Cheyenne River, the primary source of sediment for the river arm. Offsets might also occur due to differential compaction during deposb tion or from the coring process. Even allowin~ for this, it is still impossible to cross--correlate the metal peaks in all the cores. Based on t h~ sample intervals (Table I). it might appear as if the selection of sample points within each core would prevent cross-correlations. However. this is unlikely as sample selection was governed by the distinct color banding in the cores, and ever} a t t e m p t was made to limit each sample interval to a single discrete band. The inability to crosscorrelate all the metal-maxima strata may be due to insufficient sampling but also may be due to differences in postdepositional alterations al the coring sites a n d / o r to differential deposition within the river arm.
•
~
.
~,¢~
"" ~" ~
= ~.o"
~~
~-=
~ , . ~
~=-~
-
~
~
=
~
~
o
~
~
~.
~"
~,~
~
""
~
'~"
~
~
~-
~.
~'5 ~
~
!
~,/,.~
i
"~
i
~
~
DEPTH, IN CENTIMETERS
~ -
~;
~
41 o
~o°
~
~
~
""
'
~
E" ~
~~.
~
~
~-'S'
~
'
,
L~ '
!
~
V
•
~
~
'
.
_
~
.
-~
__.____
' - ~
~
--~
--
~..~______.
- ~
"
_
~
DEPTH, IN CENTIMETERS
'
'
~
.
~
~ . . . . . . . ~
'
V
~.
jo°
1~
~"
o
-
z
30
River arm ( Tables I and II ). Some of the downcore As levels are an order of magnitude higher. Two questions regarding As in the River arm cores need to be addressed: (1) how was the As transported to the River arm - - was it as arsenopyrite and/or associated with Fe- and Mn-oxides and -hydroxides; and (2) how, or in what form is the As held in the sediment column? In an attempt to address these questions, several of the high-As samples were subjected to X-ray diffraction, and scanning electron microscopy ( SEM ), to see if a specific As-bearing phase could be detected. Initial scans showed that the major mineral phases were quartz, plagioclase, feldspar, calcite, and various clay minerals, but no specific As-bearing phase. The lack of specific As-bearing phases initially was confirmed by SEM used in conjunction with an energy-dispersive X-ray analysis (EDAX) system. These results could imply: ( 1 ) n o specific As-bearing phase(s) exists in the sample, (2) the As-bearing phase(s) is so diffuse as to be undetectable with the equipment used, or ( 3 ) the As is held in a non-crystaUine form and is, therefore, undetectable by the techniques employed. When the initial results proved negative, an attempt was made to upgrade the As concentrations, and thus, the As-bearing phase (s). This entailed particle sizing of two high As-bearing samples (core 5, 72-76 cm, 180 ppm; and core 6, 74.5-84 cm, 260 p p m ) . This would not help if the As was in a non-crystalline form, but could if the As phase(s) was too diffuse. The two freeze-dried samples were broken down into standard size fractions, up to 63 #m, using air elutriation and analyzed for As (Table IV). The data show that the sample from core 5 is significantly coarser than the one from core 6. The highest As-bearing size fractions are quite finegrained, 4-16 ttm in core 5, and 8-32 ~tm in core 6 (Table IV). Additional X-ray scans of the 8-16 and 16-32 ttm fractions from core 6 again failed to identify any As-bearing phase(s), sultides, or Fe- and Mn-carbonates. The sample phases which were identified in the unfraction-
:
i ] ~
"
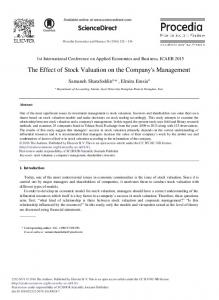
Fig. 4. Scanning electron micrograph of arsenopyrite grain from core 6 (74.5-84-cm interval). The arrow indicates the arsenopyrite grain. Magnification is 400 times; the bar rep~ resents 10 t~m.
ated samples dominated the high-As tractions as well. Subsequent SEM coupled with an EDAX system was again used to examine the high-As bearing size fractions. This work revealed the presence of both well-crystallized ar~ senopyrite (Fig. 4) and an amorphous (possibly framboidal) F e - s u l t i d e l o w i n A s t < ] 0 0 p p m ) o Thermodynamic calculations, based on the low concentrations of Fe and As in the interstitial water, and the reducing environment, m d i c a ~ that it is unlikely that the arsenopyrite is authigenic (J. Hem, pers. commun., 1986 i. This, plus the well-crystallized and large size i > 20 /2m) of the mineral (Fig. 4) imply that the arsenopyrite is probably detrital rather than authigenic in origin. Simple chemical calculations, using an As content of 55% (based on the EDAX analysis) for arsenopyrite, indicate that only~470 mg of the mineral, in 1 kg o[ sediment with no other As-bearing material could account for all the As in the core 6 s a m ple; ~ 330 mg could account for the As in the core-5 sample. Because As probably is present in forms other than just arsenopyrite, the weights cited above should be viewed as an up per limit for arsenopyrite concentrations. Analyses of suspended sediment samples collected at Cherry Creek, ~ 16 km from the mouth
31
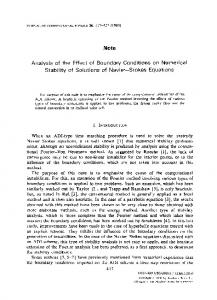
._______ Fig. 5. Scanning electron micrograph of pyrite grain from a suspended sediment sample collected at Cherry Creek on April 29, 1986 (16-32-#m fraction). Magnification is 915
times; the bar represents 10 zm. of the Cheyenne River arm, showed As concentrations ranging from 12 to 36 ppm. The highest As concentration, 36 ppm, was for a sample collected on April 29, 1986 when discharge was measured at 257 m 3 s -1 (9060 ft. 3 s - l ) . This sample was size fractioned in the same way as the core samples. The highest As levels, 50 ppm, were found in the 8-16- and 16-32-ttm fractions. It is interesting to note that these size fractions are the same ones that contained the highest As in the core samples. Subsequent S E M inspection and E D A X analysis revealed the presence of arsenopyrite. Chemical calculations indicate that only ~ 65 mg of arsenopyrite would be required to produce the 36 ppm As concentration in 1 kg of the whole suspended sediment sample. In addition, significantly smaller but detectable levels of As were found associated with Fe- and Mn-oxide coatings on several sediment grains. The differences in As concentration between the arsenopyrite and the coatings would indicate that the majority of the As in the sample is probably due to the arsenopyrite present. The same sample also contained octahedral pyrite grains (Fig. 5). Octahedral pyrite normally is associated with hydrothermal deposits and is not likely to be authigenic (Barton, 1974). The sharp cleavageplanes, and
well-preserved nature of the pyrite, would indicate rapid transport from its point of origin, which was probably the banks or floodplains of the Whitewood Creek-Belle Fourche River system, because discharge from the mining operations at Lead ceased in 1978. An additional suspended sediment sample was collected from the Cheyenne River at Wasta. This site ia above the confluence of the Belle Fourche and Cheyenne Rivers. The As concentration was 8.5 ppm. It is estimated that the As concentration in suspended sediment in the Belle Fourche River is ~ 100 ppm and this r e p r e s e n t s ~ 2 5 % of the suspended sediment load in the Cheyenne River during periods of high flow as encountered during the April 29, 1986 sampling ( K.E. Goddard, pers. commun., 1986). If that is the case, then the Belle Fourche would contribute ~ 25 ppm As and the Cheyenne would contribute ~ 6 ppm. The total calculated As concentration would then be 31-32 ppm which compares favorably with the 36 ppm As concentration for the April 29 Cherry Creek sample. Thus, the majority of the As in suspended sediments collected above the Cheyenne River arm of Lake Oahe appears to come from the Whitewood Creek-Belle Fourche River system and significant amounts of As appear to be in the form of arsenopyrite. 4. C o n c l u s i o n s Based on the work to date, several conclusions about the concentration and distribution of sediments and associated metals in the sediment column of the Cheyenne River arm of Lake Oahe can be made: (1) Sedimentation in the river arm appears to be event-dominated and quite rapid, on the order of 6-7 cm y r . - 1. (2) All of the chemical concentrations in the cores fall within the fairly wide ranges previously reported for the Pierre Shale. However, the As concentrations in a number of downcore samples appear elevated in comparison with previous findings for surficial b o t t o m sedi-
32
ments from the Cheyenne River, the Cheyenne River arm and Lake Oahe. Based on the data for core 6, which appeared to contact the old Cheyenne River bed or alluvium, the closing of Oahe Dam in 1958 has resulted in an increase in both sedimentation rates and to the metal levels in the sediment column of the river arm. (3) Based on the distribution of Mn, it appears as if reducing conditions exist in the sediment column of the river arm below 2-3 cm. (4) Interelement relations, and downcore metal patterns for this site and these cores are significantly clarified by the use of a double normalization procedure which entails ratioing various metal concentrations to Ti/LOI. The doubly normalized downcore patterns support the view that reducing conditions exist below the surface of the sediment column and further, show that the classic differentiation of Fe and Mn typical of these conditions while occurring in certain areas, has not occurred throughout the sediment column in the river arm. (5) Cross-correlations for high-level metalbearing strata within the sediment column can be made for several strata and for several cores; however, cross-correlations for all the high-level metal-bearing strata in all the cores are not fedsible at present. (6) The elevated As levels in the cores appear to be associated with elevated Fe and Mn concentrations. The As is concentrated in the fine-to-medium silt fraction (4-32 p m ) in the samples and appears to be associated with detrital arsenopyrite. This mineral is stable under the reducing conditions below 2-3 cm and would thus a p p e a r t o be relatively immobile in the sediment column.
(7) Transport of As into Lake Oahe occurs in association with Fe- and Mn-oxides and d r senopyrite. However, As transport appears to be dominated by arsenopyrite whose apparent provenance is the Whitewood Creek-Belle Fourche River system.
( 8 ) The effect of relatively small concentrat i o n s of arsenopyrite on sediment As levels in the Whitewood Creek-Belle Fourche-Cheyenne
River-Lake Oahe system is apparent. The resuits of this study emphasize the fact that in mineralized areas very small concentrations of selected minerals (e.g., arsenopyrite) can have a significant impact on sediment chemical levels over large geographical areas. The combination of elevated metal levels with low concentrations of mineral source material as occurred in this system, may require the application of unconventional techniques such as size fractionation followed by S E M / E D A X to explain the observed distributions. Finally, this study points out that even when uncontrolled point discharges of mineral-processing or rain ing wastes may have ceased, as occurred m this area in 1978, the banks and/or floodplains may contain material in storage that can afi'ect local sediment chemical levels for years t() ('~)me. Acknowledgments The authors thank Jerome J. Paulm and At len Angel of the Center for Advanced Ultrastructural Research, University of G e o r g i a . Athens. Georgia, for the S E M / E D A X analyses on the core samples and the Cherry Creek sample. The authors also thank Dennis Eberl. [ L~. Geological Survey, Denver, Colorado. for the Xray diffraction analyses. References April, R, and Newton, R., 1985. Influence of geology on lake acidification in the ILWAS watersheds. Water Air S()il
Pollut., 26: 373-386.
Barnett, P.R., 1961. Spectrographic analysis ior selected minor elements in Pierre Shale. It.S. Geol. Surv. Pr,)t. Paper, 391-B: B1-B10. Barton, Jr., P., 1074. Sulfidepetrology. In: Notes,)n Sulfide Mineralogy Short Course, 1. Mineral. S()c. Am.. Washington, D.C., Nov. 1974, pp. B - l - B - 1] Berner, R.A., 1981. A new geochemical classification ~I
sedimentaryenvironments. J. Sediment. Petrol.. 51: 359-365. Bonatti, E., Fisher, D., Joensuu, O. and Rydelt, H., 1971 Postdepositional mobility of some transition elements. phosphorus, uranium, and thorium in deep sea sediments. Geochim. Comochim. Acta, 35: 189-201. Bruland, K.W., Bertine, K., Koide, M. and Goldberg, E.I)..
1974. History of metal pollution in the southern California coastal zone. Environ. Sci. Technol., 8: 425-432. Duchart, P., Calvert, S.E. and Price, N.B., 1973. Distribution of trace metals in the pore waters of shallow water marine sediments. Limnol. Oceanogr., 18: 605-610. Elrick, K.A. and Horowitz, A.J., 1985. Analysis of rocks and sediments for arsenic, antimony, and selenium, by wet digestion and hydride generation atomic absorption. U.S. Geol. Sure., Open-File Rep., 85-497, 14 pp. Elrick, K.A. and Horowitz, A.J., 1987. Analysis of rocks and sediments for mercury by wet digestion and flameless cold vapor atomic absorption. In: Varian Instruments at Work., AA-72, 5 pp. Farmer, J. and Lovell, M., 1986. Natural enrichment of arsenic in Loch Lomond sediments. Geochim. Cosmochim, Acta, 50: 2059-2067. Forstner, U. and Wittmann, G.T.W., 1981. Metal Pollution in the Aquatic Environment. Springer, New York, N.Y., 2nd rev. ed., 486 pp. (see especially p. 129). Goddard, K.E., 1987. Composition, distribution, and hydrologic effects of contaminated sediments resulting from the discharge of gold milling wastes to Whitewood Creek at Lead and Deadwood, South Dakota. U.S. Geol. Sure.. Water Resour. Invest. Rep., 87-4051, 75 pp. Horowitz, A.J., 1985. A primer on trace metal-sediment chemistry. U.S. Geol. Surv. Water-Supply Pap. 2277, 58 pp. Horowitz, A.J. and Elrick, K.E., 1985. Multielement analysis of rocks and sediments by wet digestion and atomic absorption spectroscopy. Varian Instruments at Work, AA-47, 7 pp. Horowitz, A.J. and Elrick, K.A., 1986. An evaluation of air elutration for sediment particle size separation and subsequent chemical analysis. Environ. Technol. Lett., 7: 17-26. Krauskopf, K.B., 1957. Separation of Fe and Mn in sedimentary processes. Geochim. Cosmochim. Acta, 12: 61-84. Marron, D.C., 1986. Floodplain storage of mine tailings near Lead, South Dakota. Geol. Soc. Am., Annu. Meet., Abstr. Prog., San Antonio, Texas, p. 682. Phillips, G.R., Medvick, P.A., Skaar, D.R. and Knight, D.E., 1984. Factors affecting mobilization, transport, and bioavailability of mercury in reservoirs of the upper Missouri River basin. Rep. by Mont. Coop. Fish. Res.
Unit to U.S. Environ. Prot. Agency, Contr. No. 14-160009-80-015, 116 pp. Radar, L.F. and Grimaldi, F.S., 1961. Chemical analysis for selected minor elements in Pierre Shale. U.S. Geol. Surv., Prof. Pap. 341-A: A1-A45. Schultz, L.G., 1964. Quantitative interpretation of mineralogical composition from X-ray and chemical data fl~r the Pierre Shale. U.S. Geol. Surv., Prof. Pap. 391-C: C1-C31. Schultz, L.G., Tourtelot, H.A., Gill, J.R. and Boerngen, J.G., 1980. Composition and properties of the Pierre Shale and equivalent rocks, northern Great Plains region. U.S. Geol. Surv., Prof. Pap., 2064-B: B1-B84. Skougstad, M.W., Fishman, M.J., Friedman, L.C., Erdmann, D.E. and Duncan, S.S., 1979. Methods for determination of inorganic substances in water and fluvial sediments. U.S, Geol. Sure., Tech. Water Resour. Invest., Book 5, Ch. A1, p. 561. Stach, R.L., Helgerson, R.N., Bretz, R.F., Tipton, M.J., Beissel, D.R. and Harksen, J.C., 1978. Arsenic levels in the surface and groundwaters along Whitewood Creek, Belle Fourche River, and a portion of the Cheyenne River, South Dakota. Water Resour. Inst., South Dakota State Univ., Brookings, S.D., Proj. No. A-054SDAK, 42 pp. Tourtelot, H.A., 1962. Preliminary investigation of the geologic setting and chemical composition of the Pierre Shale Great Plains region. U.S. Geol. Surv., Prof. Paper 390, 74 pp. U.S.A.C.E. (U.S. Army Corps of Engineers), U.S. Corps of Engineers, undated. Lake Oahe, South Dakota North Dakota. Pamphlet, Omaha Distr., Missouri River Div., U.S. Army Corps Eng., 10 pp. U.S.E.P.A. (U.S. Environmental Protection Agency), 1973. Mercury, zinc, copper, arsenic, selenium, and cyanide content of selected waters and sediment collected along Whitewood Creek, the Belle Fourche River, and the Cheyenne River in western South Dakota. U.S. Environ. Prot. Agency, Surveill. Anal. Div., Tech. Support Branch, Reg. VIII, Springfield, Va., SA/TSB-17, 96 p. U.S.F.W.S. (U.S. Fish and Wildlife Service), 1985. Results of the South Dakota field office ecological services, Fish and Wildlife Service 1984 Resource Contaminant Assessment Program. Ecol. Serv., Fish Wildlife Serv., Pierre, S.D., 14 pp.