Apr 4, 2007 - Abstract. Distances to well-observed Type II-P SNe are determined from an updated version of the Expanding Photosphere Method (EPM), ...
The Expanding Photosphere Method: Progress and Problems
arXiv:0704.0552v1 [astro-ph] 4 Apr 2007
József Vinkó and Katalin Takáts Department of Optics & Quantum Electronics, University of Szeged, Hungary Abstract. Distances to well-observed Type II-P SNe are determined from an updated version of the Expanding Photosphere Method (EPM), based on recent theoretical models. The new EPM distances show good agreement with other independent distances to the host galaxies without any significant systematic bias, contrary to earlier results in the literature. The accuracy of the method is comparable with that of the distance measurements for Type Ia SNe. Keywords: supernovae; core-collapse; distances PACS: 97.10.Vm, 97.60.Bw
INTRODUCTION Distance is one of the most fundamental quantities in astrophysics, and it is especially true for supernovae. Type Ia SNe are thought to be the most reliable distance indicators, even up to z ∼ 1.5 redshift, and they play major role in determining the expansion of the Universe as well as the cosmic equation of state. On the other hand, accurate distances to SNe are crucial in understanding not only their physical properties, but also revealing their progenitor objects and the possible explosion mechanisms. The Expanding Photosphere Method (EPM) is a tool for measuring distances to SNe that have large amount of ejected material [1]. The concept of EPM is based on a few assumptions about the general physics of the expanding ejecta. These are the followings: 1. The expansion of the ejected material is spherically symmetric. 2. The ejecta is expanding homologously, i.e. R(t) = v(R) · (t − te ), where R(t) is the time-dependent radius of a particular layer in the ejecta, v(R) is the (constant) expansion velocity of this layer and t − te is the time elapsed since the moment of explosion (te). 3. The ejecta is optically thick, i.e. there exists a layer where the optical depth τλ ∼ 1. This layer is the „photosphere” (R phot ). Because of the expansion, the location of the photosphere moves inward the ejecta, so its velocity (v phot ) is decreasing with time. 4. The photosphere radiates as a blackbody, so the shape of the emergent flux spectrum is Planckian with a well-defined effective temperature Te f f . However, the absolute flux value differs from that of the blackbody due to the dominance of scattering opacity over true absorption in the ejecta. The deviation from the blackbody can be described with a simple scaling, i.e. Fλ = ζ 2 π Bλ (T ). where Fλ is the surface flux, Bλ (T ) is the Planck function and ζ is the correction (or “dilution”) factor.
These assumptions are most likely to be valid in Type II-P SNe. These eject a massive, hydrogen-rich envelope that remains optically thick for ∼ 100 days after explosion, and the emergent spectrum is indeed close to be Planckian. Thus, EPM is expected to work best for such SNe. Based on the assumptions, the instantaneous radius of the photosphere can be expressed as R phot = v phot (t) · (t − te ) (the radius of the progenitor is usually neglected). Meantime, the observed flux is fλ = θ 2 · ζ 2π Bλ (T ), where θ = R phot /D is the angular radius of the photosphere from distance D. Combining these two equations, one gets the basic equation of EPM [2, 3]: � � θ . (1) t = te + D · v phot Since θ and v phot can be determined from observations, te and D are the only unknowns in Eq.1. These can be derived via least-squares fitting to the observed quantities. If the SNe under study are at high redshifts, the equations should be slightly modified [4]. The definition of the angular radius is connected with the angular distance DA , while in the expression of the observed flux the luminosity distance DL enters. At high z DL = (1 + z)2 DA , so the angular radius of the photosphere can be inferred from s 1 fλ (1 + z) , (2) θ = ζ π Bλ ′ (T ) where λ ′ = λ /(1 + z). One particular advantage of EPM is that it does not require initial calibration, i.e. a sample of objects with a priori known distances. However, the computation of the ζ correction factors needs detailed model atmospheres, which makes the method essentially model-dependent. Currently, there are two independent sets of model atmospheres of Type II-P SNe in the literature, which were used to compute correction factors as a function of Te f f [5, 6]. The former one was used in detailed studies of SN 1999em (the most extensively studied SN II-P so far) that resulted in DEPM ≈ 8±1 Mpc [2, 3, 7] . This is in significant disagreement with the Cepheid distance to the host galaxy NGC 1637 being DCep = 11.7 ± 1 Mpc [8]. This problem has been solved in [9] by using a new set of correction factors based on the NLTE radiative transfer code CMFGEN which gave DEPM = 11.5 ± 1.0 Mpc for SN 1999em.
NEW EPM DISTANCES TO SNE II-P The method outlined above has been implemented in a new code that needs observed BV RI light curves, radial velocities (determined from the absorption minima of certain spectral features, see below) and reddening information (typically E(B − V )) as input. As in any method based on photometry, the magnitudes must be dereddened, but fortunately the results of EPM are quite insensitive to reddening errors, compared with other methods [5].
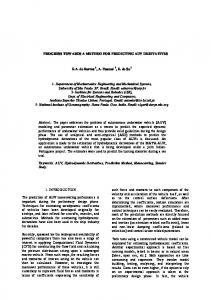
10
Tbb = 16862 K ζBVI
1
1
Flux (10
−14
2
erg/s/cm /Å)
SN 1999em (+8 d)
0.1 3000
0.1 4000
5000 6000 7000 Wavelength (Å)
8000
9000
4
6
8
10
12
14
16
18
20
3
T (10 K)
FIGURE 1. Left panel: Result of fitting a blackbody (solid line) to broadband BV I fluxes (filled symbols) of SN 1999em [3]. The R−band flux is also in good agreement with the fitted blackbody. The flux-calibrated spectrum obtained simultaneously (dotted line) is shown for comparison. Right panel: The correction factor as a function of Te f f from [6] (filled circles) and [5] (open circles).
At each epoch, the angular radius has been computed by a simultaneous fitting to the dereddened B, V and I fluxes, as described in [2]. The corresponding effective temperature has been derived by fitting a blackbody curve to the broadband fluxes converted from the dereddened magnitudes. Our experience shows that the best results can be achieved by considering all optical+NIR (i.e. BV RI) fluxes simultaneously. Earlier studies were sometimes limited to the usage of B and V bands only, which may result in increased systematic errors due to the large deviation of the B-band fluxes from the blackbody curve at later phases. The left panel of Fig.1 illustrates the optimum fitting of a blackbody to either photometric, or precisely calibrated spectroscopic fluxes. From the resulting Te f f , the correction factor ζ has been computed from the ζBV I (T ) function of Dessart & Hillier [6] for data obtained less than 40 days after explosion. For data measured between 40 - 60 days after explosion, the function given by Eastman et al. [5] was applied. As noted above, the usage of the function of Dessart & Hillier produces better distances, but their models are valid only during the first month after explosion, before the hydrogen starts to recombine. The ζBV I (T ) functions are plotted in the right panel of Fig.1. Beside the correction factors, the other important quantity is the photospheric velocity v phot , because the resulting distance is very sensitive to the velocities that appear in the denominator in Eq.1. Thus, the problem of finding an optimum method to infer v phot from Type II-P SNe spectra has been addressed in several studies (see [2, 3, 6]). We have studied this problem by computing model spectra with the parametrized spectral synthesis code SYNOW [10]. SYNOW computes the emergent spectrum in a homologously expanding atmosphere assuming LTE and pure scattering line formation. The input parameters are the velocity and the blackbody temperature at the photosphere (v phot and Te f f ), the exponent of the atmospheric structure, the list of ions contributing to the spectral features, and the optical depth of one strong line for each ion. Four sets of spectra have been defined corresponding to phases +10, +15, +50 and +95 days after explosion, respectively. The list of ions contained H, He I, Na I, Fe II, Sc
2.5 2 1.5
Hγ HeI 5876 FeII 4924 FeII 5018 FeII 5169 ScII 5526
1.08 1.06
1
vphot / vobs
log flux + const
1.1
+10 d +15 d +50 d +95 d
0.5 0 −0.5
1.04 1.02 1 0.98
−1 0.96 −1.5 3000
4000
5000 6000 Wavelength (Å)
7000
8000
2
4
6 8 10 12 3 vobs (10 km/s)
14
16
FIGURE 2. Left panel: SYNOW model spectra of Type II-P SNe. The phase of each spectrum (expressed in days after explosion) is indicated. Right panel: The ratio of the true photospheric velocity (an input parameter of a SYNOW model) to the „observed” velocity (derived from the absorption minimum of P Cygni lines) as a function of the „observed” velocity. Different symbols mean different photospheric lines indicated on the righ-hand side.
II, Ti II and Ba II, because these ions are thought to be responsible for the strongest lines in the optical [3]. The input parameters except v phot were tuned to match real Type II-P SNe spectra. Then, several model spectra were synthesized with different input v phot for each phase. The left panel of Fig.2 shows representative spectra of all phases. The synthesized spectra were used to compute “observed” radial velocities by measuring the Doppler-shift of the absorption minima of selected lines. For P Cygni line profiles, this should give exactly v phot if the line is isolated and optically thin. However, in reality the features in a SN spectrum are all blends and may not be optically thin. Therefore, vobs will differ from v phot . In the right panel of Fig.2 the ratio of v phot /vobs is plotted as a function of vobs for the features shown. It is seen that in almost all cases v phot is slightly underestimated. The explanation of such a phenomenon is discussed in [6] for the H α line. However, the relative difference is below 5 %, thus, these lines are expected to represent v phot with 2 4 % accuracy. Motivated by these results, we have selected the He I λ 5876 and the Fe II λ 5169 features to infer v phot from early-phase (< +20 days) and late-phase spectra of real SNe, respectively. In order to apply the method to real SNe, we have collected the available data of Type II-P SNe from the literature (details and references will be published in a forthcoming paper). Eq.1 was fitted to the observed data via least squares using either t or θ /v phot as the independent variable. The two results for D and te were averaged to obtain their final value. Whenever possible, the fit was restricted to data obtained between +5 – +40 days after explosion, and the angular radii were calculated using the Dessart & Hillier correction factors (see above). In a few cases only late-phase (t ∼ 40 − 60 days) data were available. The Eastman et al. correction factors were applied for those SNe. The EPM distances are plotted against the “reference” distances to their host galaxies (mostly Tully-Fisher or SBF-distances for the nearby ones and Hubble-flow distances for the more distant ones) in the left panel of Fig.3. As a comparison, the distances coming
1000
1
0.5
µL - µref
D (Mpc)
100 0
10 -0.5
1
-1 1
10
100
1000
26
28
30
32
34
36
38
µref
Dref (Mpc)
FIGURE 3. Left panel: the comparison of EPM (filled circles) and SCM (open triangles) distances with the reference distances of the host galaxies. Right panel: residuals of the distance moduli of Type II-P SNe from EPM (filled symbols) and Type Ia SNe (see text).
from the „Standard Candle Method” (SCM) [11] for nearly the same observational sample are also shown. The scattering is very similar for both EPM and SCM. It is concluded that these two methods provide distances to Type II-P SNe with ∼ 15 − 20 % accuracy. The accuracy of the new EPM distances is also similar to that of individual SNe Ia distances. This is illustrated in the right panel of Fig.3, where the difference between the distance moduli of Type II-P SNe (from this paper) and the low-redshift subsample of Type Ia SNe (from [12]) are plotted against the reference distance moduli (adopting Dre f = cz/H0 for Type Ia SNe). Again, the scattering of the data is similar for the two samples. Thus, the concept of EPM combined with the present knowledge of Type II-P SNe atmospheres may provide consistent and reliable distances, which may be extended toward higher redshifts in the future. This could be a very important, independent test of the Type Ia SNe distance scale. This work was supported by Hungarian OTKA Grants No. T 042509 and TS 049872.
REFERENCES 1. Kirshner R.P., Kwan J., ApJ 193, 27 (1974) 2. Hamuy M. et al., ApJ, 558, 615 (2001) 3. Leonard D.C. et al., PASP 114, 35 (2002) 4. Schmidt, B.P. et al., AJ 107, 1444 (1994) 5. Eastman, R.G., Schmidt, B.P., & Kirshner, R., ApJ 466, 911 (1996) 6. Dessart, L. and Hillier, D. J., Astronomy & Astrophysics 439, 671 (2005) 7. Elmhamdi, A. et al. MNRAS 338, 939 (2003) 8. Leonard, D.C., Kanbur, S.M., Ngeow, C.C., Tanvir, N.R. ApJ 594, 247 (2003) 9. Dessart, L. and Hillier, D. J., Astronomy & Astrophysics 447, 691 (2006) 10. Baron E. et al., ApJ 545, 444 (2000) 11. Hamuy, M., in Cosmic Explosions - IAU Colloquium 192, edited by J. M. Marcaide and K. W. Weiler, Springer Proceedings in Physics 99, Springer-Verlag, Berlin, Heidelberg, 2005, pp. 535–541. 12. http://braeburn.pha.jhu.edu/~ariess/R06/Davis07_R07_WV07.dat
40