The Impact of Web Service Integration on Grid Performance Franc¸ois Ta¨ıani1 Computing Department Lancaster University Lancaster LA1 4WA, UK
[email protected]
Matti Hiltunen and Rick Schlichting AT&T Labs - Research 180 Park Avenue Florham Park, NJ 07932, USA {hiltunen, rick}@research.att.com
(c) 2005 IEEE. Personal use of this material is permitted. However, permission to reprint/republish this material for advertising or promotional purposes or for creating new collective works for resale or redistribution to servers or lists, or to reuse any copyrighted component of this work in other works must be obtained from the IEEE. This material is presented to ensure timely dissemination of scholarly and technical work. Copyright and all rights therein are retained by authors or by other copyright holders. All persons copying this information are expected to adhere to the terms and constraints invoked by each author’s copyright. In most cases, these works may not be reposted without the explicit permission of the copyright holder. This article was presented at the 14th IEEE International Symposium on High Performance Distributed Computing (HPDC-14), held in Research Triangle Park, NC, USA, 24-27 July, 2005. It has been published in the proceedings of the aforementioned conference under the following reference: Franc¸ois Ta¨ıani, Matti Hiltunen, Rick Schlichting, The Impact of Web Service Integration on Grid Performance, The 14th IEEE International Symposium on High Performance Distributed Computing (HPDC-14), Research Triangle Park, NC, USA, 24-27 July, 2005, pp.14-23
1
The Impact of Web Service Integration on Grid Performance Franc¸ois Ta¨ıani1 Computing Department Lancaster University Lancaster LA1 4WA, UK
[email protected]
Abstract The past few years have seen an increasingly tight link between grid computing and web services, with the latest standards defining a grid computing architecture as a set of services built using web services standards and protocols. However, the reputation of these technologies (SOAP, XML, WSDL, HTTP) is that they are heavyweight and slow, something that is potentially a concern given the current and anticipated application mix for high performance grid architectures. This paper reports the results of a performance evaluation carried out on Globus 3.9.4, a reference implementation of the new GGF standards that are built on the Web Services Resource Framework (WSRF). The evaluation approach combines low interference measurement (black box) techniques with more sophisticated samplingbased profiling (gray box) techniques. The results indicate possible opportunities for optimization, as well as provide useful input for the designers of grid services.
1. Introduction Grid computing is increasingly evolving towards a Service-Oriented Architecture (SOA). The recent addition of the new Web Services Resource Framework (WSRF) [3] for modeling and accessing stateful resources is in many ways the final step needed to transition grid computing fully into an SOA, with service interactions and other functionality implemented using a web services foundation. With this transition, everything built using the OGSA (Open Grid Services Architecture) specifications becomes a collection of services [2]. These include both infrastructure services provided by the underlying grid computing environment, and application services built on this infrastructure. For example, the OGSA architecture defines infrastructure services 1 This work was performed while Franc ¸ ois Ta¨ıani was visiting AT&T Shannon laboratory on the INRIA Postdoc Scholarship Program.
Matti Hiltunen and Rick Schlichting AT&T Labs - Research 180 Park Avenue Florham Park, NJ 07932, USA {hiltunen, rick}@research.att.com
such as an Execution Planning Service and an Authorization Service, while users of this architecture can implement their own applications as services such as perhaps a Simulation Service. While there are many appealing aspects of SOAs in general and WSRF in particular, web services standards and their associated protocols have the reputation of being slow and heavyweight. This expectation stems from a number of factors, but the ones most commonly cited are a reliance on XML and the inherent execution penalty that results when multiple layers of software are needed to realize functionality as is the case here. Grid computing, on the other hand, focuses on sharing computing resources in contexts where maximum performance is often the goal. The fundamental tension between these two argues, at the very least, for a close examination of the performance impact of the use of web services for grid computing applications. In this paper, we explore these potential performance issues by evaluating Globus 3.9.4, a reference implementation of this new grid computing architecture. To do this, we apply a two step approach: • Black box testing. We first measure end-to-end latencies on the client for a number of different remote operations. Much of our effort in this first step focuses on selecting appropriate initial conditions to evaluate the importance of delayed (“lazy”) initialization, both at the Globus container (i.e., server) and at the client. • Gray box testing. In the second step, we use Java profiling capabilities to obtain a more detailed picture of the container’s behavior. The main challenge here is to find an appropriate way to relate the performance data to the unknown structure of the container, and to represent it in a useful and intuitive way. The choice of a two-step approach is motivated by the inherent tension between granularity and accuracy in performance profiling. By adopting a progressive approach moving from black box to gray box profiling, we are able to
14th IEEE Int. Symp. on High Perf. Dist. Computing (HPDC), Research Triangle Park, NC, USA, 24-27 July, 2005 (c) IEEE 2005
2
2. Black Box Experiments
clock instrumentation create subscribe
client
add 3
container
notify 3 destroy
averaging
control the interference caused by the observation, and correlate the results obtained by the different stages of our experiments. The remainder of this paper is organized as follows. Section 2 presents the results from our series of black box experiments. Section 3 then focuses on the sampling-based profiling experiments. Finally, section 4 offers conclusions and plans for future research.
×5 ×5 ×5
influence of resource init influence of client init influence of container init
×50 (total: 10 000 invocations)
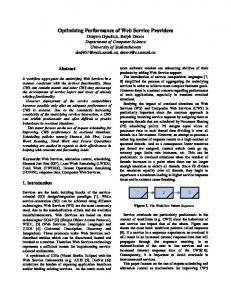
2.1. Overview Figure 1. Experimental Sequences The Globus Java implementation provides a client/server architecture based on the concept of containers, where a container hosts grid services that clients can invoke through a SOAP/WSDL interface. As described above, Globus uses the new Web Services Resource Framework (WSRF). WSRF allows grid services to create, manipulate, and delete resources, i.e., stateful objects. Globus also offers a number of mechanisms associated with resources, e.g., notifications that alert subscribers each time the state of a given resource is modified. The Java implementations of Globus, and more generally the web services framework, are characterized by their extreme flexibility. Service implementations are loaded on demand in the Globus container using numerous customization files (e.g., deployment files, service description files) that are written in various XML dialects, such as the Web Service Definition Language, the Web Service Deployment Descriptor language, and the Resource Specification Language. Because of this flexibility, many initialization steps do not occur until they are actually required. As a consequence, the first execution of an operation usually takes much more time than its successors. An additional related issue is that, because of the numerous layers of initialization involved on both the client and the container, even the notion of being the “first” can be complex, with numerous sub-cases. For example, a request can be the first one that a client sends and the first one that a Globus container receives if the client and the container have just been started, or it can be the first one sent by a client while being the tenth received by a container. In general, three “entities” have to be created: the container, the client, and the resource. Each of these can incur its own on-demand initialization cost, which is reflected in longer latencies.
2.2. Experiment Description Our results are based on the example CounterService provided with Globus to illustrate the use of WSRF. This service maintains Counter resources, which can be created,
incremented by a specified number, queried, and destroyed. We use the unmodified CounterService implementation, but instrument the provided client code to record execution latencies for different operations related to accessing the service. To evaluate the influence of the different initialization steps, we measure end-to-end latencies for a number of different invocation sequences (figure 1). These sequences have been constructed as variants of the following series of interactions: 1. A Globus container process is started. This corresponds to the right box in figure 1. 2. A client process is started (the left box). 3. The client requests the container to create a counter resource (the circle inside the container). This step involves a number of smaller steps that are specific to Globus and the underlying SOAP protocol (creating an endpoint, creating a locator, invoking the locator, sending the actual create request, and eventually retrieving the counter port). 4. The client subscribes to changes that might occur in the new resource using the WSRF notification service (subscribe). We measure both the preparation of the subscription request—creating the request and initializing a client side notification manager—and the round-trip time needed by the container to process the subscription. 5. A series of five add requests on the resource are sent to the container. The client waits for each request to complete and for the change notification to arrive before issuing the next request. Both the request and notification latencies are measured from the point the add request is sent. 6. The resource is destroyed by the client. 7. The client is stopped. 8. The container is stopped.
14th IEEE Int. Symp. on High Perf. Dist. Computing (HPDC), Research Triangle Park, NC, USA, 24-27 July, 2005 (c) IEEE 2005
3
Case 1. All 3 entities (container/client/resource) are new. Case 2. Only the client and the resource are new. Case 3. Only the resource is new. Case 4. No entity is new (stabilized latencies). Thus, these cases provide the different combinations that are needed to apportion the startup overhead among the container, the clients, and the resources. These experiments also allow us to evaluate the initialization effect on each basic operation involved in the sequence (resource creation, notification management, remote invocation). All latencies are round-trip latencies measured at the client. The experiments were carried out on a standalone SMP machine running four 1.60GHz Intel Xeon processors. The reported times do not contain any actual network cost—they reflect only the local processing cost of Globus invocations.
2.3. Results and Discussion Resource Set Up Latency Figure 2 shows the latencies measured when setting up a resource, including creation and subscription, in situations covered by the first three cases mentioned above. Averaged times are shown for five successive clients interacting with the same container (numbered 0 to 4) when each client successively initializes five resources (numbered 1 to 5).
Case 1: container initialization overhead
Case2: client initialization overhead
35000 30000
Time (ms)
In this basic sequence, the repetition of the add operation in step 5 serves two purposes. First, it makes it possible to determine that lazy initialization is in fact used by verifying that the latency of the first request differs substantially from the remaining ones. Second, it allows the corresponding overhead to be calculated by subtracting from the latency of the first request the stabilized latency of the remaining requests. Just using the above sequence is not sufficient, however. Because the container, client, and resource are all new when the first add request is issued, it is not possible to tell what proportion of the measured initialization cost is caused by the container, the client, or the resource, respectively. To assess the relative influence of each of these entities, we extend this original sequence in the following manner. First, steps 3 to 6 are repeated five times by having the same client successively create five resources, and sending multiple add requests to each of them. Then, steps 2 to 7 are also repeated five times by creating five successive clients, which interact with the same container (see figure 1). Finally, because latencies are not deterministic, we repeat the whole sequence 50 times—hence, successively launching 50 containers—to obtained averaged data. By nesting these repeated sequences, our different experiments cover four essential cases:
25000 20000 15000 10000 5000 0 0
Case 3: C 1 stabilized lient P 2 3 roc latencies ess
4
5
4
3
1
2
ce
ur
o es
R
Figure 2. Resource set up latency In this figure, the unstabilized latencies of Cases 1 and 2 definitely stand out when compared with the stabilized latencies of Case 3. Whereas the average stabilized initialization latency is 384 ms, the first resource of the first client (Case 1) requires more than 33 s to be initialized and the first resources of the other clients (Case 2) require 25 s. Clients send creation requests only after both they and the container have completed their initialization, i.e., both UNIX process are idle. As a result, the discrepancy in the observed latencies can only be explained by work associated with lazy initialization occurring inside the client and the container. From the three different cases, we can also infer the relative influence of the container and the client on the lazy initialization effect. Table 1 presents a more detailed breakdown of the time spent in each individual step of the resource initialization for the three different cases. By subtracting Case 3 (stabilized latencies) from Case 2 where the client is new but the container is not, we can determine how much of the overhead is caused by the client being new. Similarly, by subtracting Case 2 from Case 1 where the client and container are both new, we obtain a measure of overhead caused by the container having just been instantiated. Because the times shown are averaged, overheads that are below 10 ms and/or roughly below 10% of the highest value are not statistically significant, since they fall below the standard deviation of the averaged values. Note that there are certain things that we can not conclude from these measurements. For example, it would be incorrect to conclude that the container spends 8236 ms executing initialization code when it creates a resource for the
14th IEEE Int. Symp. on High Perf. Dist. Computing (HPDC), Research Triangle Park, NC, USA, 24-27 July, 2005 (c) IEEE 2005
4
Creating Endpoint Creating Locator Invoking Locator Sending Create Request Obtaining Counter Port Preparing Subscription Sending Subscription Request Total
New Client New Container Case 1 44 1509 343 30273 1 711 541 33425
New Client Old Container Case 2 46 1489 348 22382 1 705 213 25189
Stabilized Latencies Case 3
Container Init Client Init Overhead Overhead
0 14 0 159 0 38 168 384
-2 20 -5 7891 0 6 328 8236
46 1475 348 22223 1 667 45 24805
Table 1. Detailed resource init latencies (ms), with an evaluation of the lazy evaluation overheads caused by the container and the clients (rounded results)
Case 1: container initialization overhead Case 2: no apparent client overhead
700 600
Time (ms)
first time, even though this figure is listed as the container initialization overhead in Table 1. It might be, for instance, that the client has to carry out some extra work because the container is new. The table also highlights the relative weights of the creation and subscription operations in the latencies and in the lazy optimization overheads. Under the surface, a subscription causes the subscriber to be turned into a web service provider (i.e., a server). A valid assumption would be that some of the observed lazy initialization caused by the client is in fact triggered by the subscription. Looking at the table, this is indeed the case, since the subscription preparation takes up to 667 ms longer—more that 17 times the stabilized value—when the client is new and the container has essentially no influence on it. However, 97% of the observed initialization overhead (31997 ms) is caused by the first five steps of the resource initiation, which is not concerned with the notification subscription. 25% of this overhead (7904 ms) can be attributed to the client, while the remaining 75% (24093 ms) is attributable to the container.
500 400 300 200 100 0
0 Case 3: 1 resources Clie nt P 2 3 are new roc ess
4
5
4
2
1
e
c ur so
3
Re
Figure 3. Latency of the first add command
Request Latency Figures 3 and 4 show measured latencies for add operations on the resource. Figure 3 illustrates the same combinations as figure 2 for the first add request on each of the 25 resources (i.e., 5 resources for each of the 5 clients). This figure covers Cases 1 to 3. Figure 4 shows the latencies of the 25 add requests made by the first client only (i.e., 5 requests on each of the 5 resources the client creates). This second figure covers Cases 1, 3, and 4. Note that the data in the figures overlap: the Client 0 row of the Case 3 area in figure 3 is duplicated in figure 4. As with resource latencies, we can infer from figure 3 that some lazy initialization is triggered by the container when an add request is executed for the first time, the effect being roughly 421 ms. On the other hand and contrary to
resource initialization, the clients do not seem to cause any significant lazy initialization; the computed overhead here is 66 ms, which is not statistically significant. This figure does not cover Case 4 of our classification, and hence, does not yield any information about resource-related initialization. Figure 4 covers this case, and shows that there is no resource related overhead for add requests. A valid question is whether the time distribution shown in figure 4 for Client 0 holds for the other clients. In fact, it does, as table 2 shows. This table summarizes the average latencies for the add requests and change notification across all experiments for the four cases mentioned in section 2.2. In this table, the stabilized latencies for add requests take all clients into account and are similar to the latency measured for Client 0 only (159 ms). The last three columns of
14th IEEE Int. Symp. on High Perf. Dist. Computing (HPDC), Research Triangle Park, NC, USA, 24-27 July, 2005 (c) IEEE 2005
5
Add latency Notification
New Cont. New Client New Res. Case 1 682 3029
Old Cont. New Client New Res. Case 2 261 2597
Old Cont. Old Client New Res. Case 3 194 1110
Old Cont. Old Client Old Res. Case 4 (stable) 159 176
Cont. Init Overhead
Client Init Overhead
421 432
Res. Init Overhead
66 1487
36 934
Table 2. Request and notification latencies (ms), with an evaluation of the lazy evaluation overheads caused by the container, the clients, and the resources (rounded results) larly, the creation of a resource takes 8700% longer the first time it is invoked compared to when the system has stabilized (33425 ms compared to 384 ms). As already noted, all latencies are measured after the container and client have completed their initial set up, meaning that the overhead must be caused by this delayed initialization activity. In addition, the experiments show that even the stabilized latencies are quite high: 159 ms for a round-trip add request and 176 ms for a notification message. We point out again that these figures do not include any network delays since both the client and the service are on the same machine.
Case 1: container initialization overhead 700
Case 4: stabilized latencies
Time (ms)
600 500 400 300 200 100
3. Gray Box Profiling Experiments
0
Case 3: no 1 2 apparent Add 3 Req 4 resource ues overhead t
4 5
5
3
1
2
e rc
ou
s Re
Figure 4. All add requests of Client 0 the table attempt to evaluate how much lazy initialization is triggered by each of the entities. These numbers clearly illustrate the lazy-initialization effect related to resources for change notifications. Specifically, while the average stabilized latency for notification is 176 ms (Case 4), the first notifications for Resources 2 to 5 (Case 3) take an average of 1110 ms. Hence, the overhead is approximately 934 ms. Quite surprisingly, the second highest overhead (934ms) seems to happen when resources have just been created. This hints that much of the initialization work such as deployment and hot-plugging occurs when a resource is actually instantiated, and is repeated regardless of the use of prior resources of the same type.
2.4. Summary As demonstrated above, the latencies experienced by the client are heavily influenced by the initialization state of the different entities involved. The first notification sent by a container experiences a 1700% overhead (3029 ms) over the stabilized latencies for the same operation (176 ms). Simi-
3.1. Overview To better identify the nature of the lazy initialization steps, we conducted a series of experiments in which the Globus container was examined using sampling-based profiling. The objective of these experiments was to relate the externally-observed latencies with the software structure of the Globus container. To do this, we used a well-known profiling method based on sampling and also adapted known visualization techniques to represent our results. This process was challenging, however, largely because Globus and all the required infrastructure needed to execute it constitute a large and complex collection of software that is difficult to analyze. In the following, we first describe our experiments, including how the sampling-based profiling is performed and the results visualized. We then present results from initial tests.
3.2. Experiment Description Sampling-based profiling consists of periodically stopping a program’s execution to capture its current control state [11, 1]. The granularity of the obtained data is usually coarser than with approaches based on an exhaustive instrumentation of the source code, but such sampling-based approaches are easier to deploy and impose far less overhead. The motivation for using this approach in this case stemmed
14th IEEE Int. Symp. on High Perf. Dist. Computing (HPDC), Research Triangle Park, NC, USA, 24-27 July, 2005 (c) IEEE 2005
6
lib1.Whale .breath lib1.Mammal.inhale lib2.Lung .inhale lib2.Muscle.contract lib2.Nerve .transmit lib3.Signal.travel
×3
lib2.Muscle.stop lib2.Nerve .transmit lib3.Blood .flow lib3.Pressure.foo
×1
lib3.Signal.travel
×2
Figure 5. An example sampling result
Figure 6. Graphical projection of figure 5 from early experiments that showed that a sequence like the one used for our black box experiments (section 2.2) causes several million local Java invocations in the client and the container. In particular, using the same sequence described there but with only three add invocations, we traced 1,544,734 local Java invocations at the client, and 6,466,652 at the server using the Java Debugging Interface API [10]. For our profiling experiments, we used SUN’s free Java profiler hprof [5]. When run in sampling mode, hprof regularly interrupts the JVM and captures the stack trace of the current active thread. When the JVM terminates, hprof outputs a set of weighted stack traces. The weight of each stack represents the number of times hprof found the active thread executing this given stack. Figure 5 illustrates how sampling-based profiling works on a small example. In this figure, the program has been sampled six times, and three different stacks have been captured (the stacks are shown in a call graph for clarity). In 3 out of the 6 samples, the active thread of the program was executing the first stack; in one sample, it was executing the second; and in two samples, the third. As can be seen, using stacks to capture the program’s execution state indicates which methods the program is actually executing. Here, this means lib3.Signal.travel in half of the samples, lib3.Pressure.foo in one sixth of the samples, and
create subscribe
client
add 3
container
notify 3
destroy
hprof
Java VM
×5 ×5
profiling data
Figure 7. Experimental sequences lib3.Signal.travel is one third of the samples. Most importantly, it also indicates on behalf of whom these methods are being executed. This allows the computation for each method of an exclusive execution time—the time spent in the method, exclusive of any nested calls—and an inclusive execution time—the sum of the exclusive execution time for the method and the time spent in each of the nested calls made by the method [4]. Once the experiment is run, the second issue is to represent the results in such a way that they can be used to provide useful insight about the software. The primary
14th IEEE Int. Symp. on High Perf. Dist. Computing (HPDC), Research Triangle Park, NC, USA, 24-27 July, 2005 (c) IEEE 2005
7
challenge is dealing with the volume of data. For example, in the experiments reported below, we ran the workload shown in figure 7 on the Globus container and obtained 2896 samples from hprof, including 1745 individual stack traces. These stacks total more than 55550 individual stack frames (a frame in a call stack represents a method invocation). They cover the activity of 32 threads, and contain references to 1861 methods, 724 classes, and 182 different Java packages. While these results are far less dramatic than the millions of invocations uncovered by our first tracing attempt, the amount of data generated is still significant. Our approach is to adapt visualization techniques proposed for software visualization [7, 6, 8] to this context. Specifically, our approach is inspired by one of the techniques proposed in J INSIGHT [7], where an execution trace is represented on a stack-depth × time-line diagram in which stack frames are color-coded according to their class. We adapted this representation in two major ways: Package-Level Granularity. Due to the large number of classes present in our traces (724), our representation uses package-based rather than class-based color codes. This is quite flexible since nested packages might be grouped together with their parent depending on the level of granularity required. Depth × Weight Projection. Since sample-based profiling does not provide ordering information on the observed stack traces, a time-line representation is not appropriate. Instead, to make the internal layering of the Globus container apparent, we represent each Globus package according to the frequency and the stack depths at which it occurs in the sampled traces. Figure 6 illustrates our presentation technique based on the toy example of figure 5. The diagrams indicate how often a given package was encountered in the samples at a given stack depth. Two diagrams are shown. The first represents exclusive weights, i.e., only the last invocation of each stack is considered. Here, only the library lib3 appears, since in all six samples of figure 5, the active thread is executing inside lib3 at a call depth of 6. As mentioned above, this diagram fails to capture on behalf of which higher-level packages lib3 is executed. The right hand diagram does just that. It takes into consideration all the frames of all sampled stacks, and presents the packages according to their depth and to the weight of the individual stacks. In this second diagram, the surface of each library in the diagram is proportional to the time spent by the processor in the library or in code called by this library at execution time.
3.3. Results We profiled Globus by having 5 successive resources receive 5 successive remote invocations from the same client,
package/class java.* java.net.* java.net.PlainSocketImpl.socketAccept java.net.SocketInputStream.socketRead0 java.lang.* java.lang.StringBuffer.* java.lang.String.* java.lang.ClassLoader.* java.lang.Class.* java.lang.Throwable.* java.util.* java.util.zip.* java.util.Hash* java.math.* java.math.BigInteger.* java.io.* org.* org.apache.* org.apache.axis.* org.apache.xerces.* org.bouncycastle.* org.globus.* sun.* cryptix.* com.* javax.* total
count 2625 1974 1326 639 290 101 54 51 43 24 218 85 108 94 86 30 210 162 111 35 23 22 34 11 15 1 2896
% 90% 68% 46% 22% 10% 3% 2% 2% 1% 1% 8% 3% 4% 3% 3% 1% 7% 6% 4% 1% 1% 1% 1% 0.5% 0.5% 0% 100%
Table 3. Breakdown of captured samples according to topmost stack frame as shown in figure 7. Table 3 shows the breakdown of the samples according to their topmost stack frame, which illustrates where the container spends its execution time. Quite strikingly, most of the container execution time (90%) is spent inside Java standard libraries, with java.net making up most of it (68%). In this library, however, most of the time is accounted for by java.net.PlainSocketImpl.socketAccept, which is used to wait for client connections rather than being part of the execution path for a client request. For this reason, we removed the corresponding samples from our profiling data in subsequent analysis. Figure 8 shows the results of container profiling without the socketAccept samples using the approach described above in section 3.2; a curve is used rather than a bar diagram for readability reasons. The diagram shows a clear split at stack depth 13 (area 1 in the figure). Nearly 40% of the sampled stacks stop at length 13, which means the program spends 40% of its execution time at this level. Depth 13 is also where we find most of the network activity (java.net), i.e., most of the socketRead0 invocations. On the other side, the remaining stacks have a far more regular and widespread distribution along the stack depth (area 2).
14th IEEE Int. Symp. on High Perf. Dist. Computing (HPDC), Research Triangle Park, NC, USA, 24-27 July, 2005 (c) IEEE 2005
8
1800
1600
1 1400
Frequency
1200
1000
sun.misc
java.util
org.apache.naming
org.globus.bootstrap
org.apache.xerces
java.lang
java.math
xjava.security
COM.claymoresystems.provider
COM.claymoresystems.ptls
org.globus.gsi
org.oasis.wsrf
java.security
javax.security.auth
org.globus.axis
org.globus.wsrf
java.lang.reflect
sun.reflect
org.apache.axis
others
java.net
java.io
800
600
400
2
200
0 1
3
5
7
9 11 13 15 17 19 21 23 25 27 29 31 33 35 37 39 41 43 45 47 49 51 53 55 57 59 61 63 65 67 69 71 73 75
Stack-Depth
Figure 8. Performance sampling of the Globus container (inclusive) Note that the package org.apache.axis, an open source JavaSOAP engine, is particularly prominent in the two areas as well, although it is found at essentially all stack depths. It also constitutes most of the container activity at stack depths of 60 and beyond. A closer analysis of the profiling data related to area 1 reveals that the traces that end in socketRead0 are involved in the handling of the resource state change notifications. As noted above, when sending a notification, the container acts as a client and sends a request to the subscriber of the notification. When in socketRead0, the container has already sent this notification and is blocked waiting for the client’s answer. Since these notifications are sent asynchronously with respect to client processing, however, the time spent in socketRead0 is outside the critical path of client requests. Interestingly, the code used to send notifications in the container is the same as that used in the client to send requests. This suggests that the client probably exhibits the same behavior when waiting for replies from the container. Profiling the client using the same technique confirms this hypothesis, with the results revealing that 62% of the client execution time is spent in java.net. Of that time, 40% is spent in socketAccept and 21% in socketRead0. Since the
size of each SOAP message is only a few kilobytes and the whole experiment executes on a single machine, these high costs are most likely due to time spent waiting for notification messages and responses to requests. To evaluate the behavior of the container beyond the blocking time in socketRead0, we ran the same experiments as in figure 7 but without change notifications. We also split org.apache.axis into its subcomponents to obtain more detailed information on its role in the container. The graph corresponding to this second set of experiments is shown in figure 9. These results confirm our observations about notifications, since the shape of the graph closely matches that of the earlier figure without the split at stack depth 13. Two additional observations can also be made, as follows. Packages. Only a subset of the 182 packages found in the sampling data seem to have an actual effect on the execution time. Among them, only three Globus packages are present: org.globus.axis, org.globus.wsrf, and org.globus.gsi. These three account for 27% of the stack frames represented on the diagram, but disappear after stack depth 27. A look at the distribution of the topmost stack frames confirms that
14th IEEE Int. Symp. on High Perf. Dist. Computing (HPDC), Research Triangle Park, NC, USA, 24-27 July, 2005 (c) IEEE 2005
9
sun.misc org.apache.naming org.apache.xerces xjava.security java.math org.globus.gsi javax.security.auth org.oasis.wsrf java.lang.reflect org.apache.axis.wsdl.symbolTable org.apache.axis.AxisEngine org.apache.axis.utils org.apache.axis.SimpleChain org.apache.axis.client org.apache.axis.transport.http java.io
1200
1000
Frequency
800
java.util org.globus.bootstrap java.lang COM.claymoresystems.ptls COM.claymoresystems.provider java.security org.globus.axis org.globus.wsrf sun.reflect org.apache.axis.server org.apache.axis.configuration org.apache.axis.encoding org.apache.axis.deployment.wsdd org.apache.axis (others) others java.net
600
400
200
0 1
4
7
10
13
16
19
22
25
28
31
34
37
40
43
46
49
52
55
58
61
64
67
70
73
Stack Depth
Figure 9. Performance sampling without change notification and org.apache.axis split up the Globus packages account for less than 2% of the direct (“exclusive”) execution time. This means that the poor performance observed in section 2 cannot be attributed directly to the Globus code, but rather is related more to the underlying libraries used by the platform. Package Structure. The diagram shows a clear layered structure for stack depths less than 28, with most packages spanning less that a few depth levels. From depth 28 on however, the relative weight of each package remains quite regular, and as the decreasing slope of the total number of samples for each depth suggests, stacks have been sampled regularly at all lengths from 28 to 75. In this part of the diagram, no strong software structure seems to be reflected in the distribution of the packages across the stack depth. However, the package org.apache.axis.wsdl.symbolTable is quite prominent, which upon closer inspection corresponds to recursive invocations of the method symbolTable.SymbolTable.setTypeReferences. This hints at some algorithmic issues in WSDL symbol management. Table 4 gives the package breakdown of samples after removing low-level packages to obtain a higher
level view of the execution cost. This table confirms that org.apache.axis.wsdl takes a significant amount of execution time (21%). It also shows that SOAP and XML processing—org.apache.axis as a whole and org.apache.xerces—have a strong impact on performance (44%). Finally, enforcing security has a non-trivial cost, since the Globus Security Infrastructure (GSI) together with the encryption library rsa together account for 30% of the samples. Package org.apache.axis.wsdl org.apache.axis.encoding org.apache.axis (others) org.globus.gsi org.globus.wsrf cryptix.provider.rsa org.apache.xerces org.bouncycastle.asn1 others Total
count 231 66 113 249 49 82 78 57 180 1105
% 21% 6% 10% 23% 4% 7% 7% 5% 16% 100%
Table 4. Breakdown of samples
14th IEEE Int. Symp. on High Perf. Dist. Computing (HPDC), Research Triangle Park, NC, USA, 24-27 July, 2005 (c) IEEE 2005
10
4. Conclusions and Future Work The trend toward integrating aspects of web services into grid computing undoubtedly has performance and usability implications, the full impact of which is yet to be determined. In this paper, however, we have tried to address at least a portion of these issues by reporting on the results of a performance evaluation carried out on Globus 3.9.4, a very recent reference implementation of the new standards. The main conclusions of our study are twofold. First, the performance of Globus is strongly impacted by lazy initialization, which is used uniformly for multiple types of software abstractions. Second, even the stabilized latencies are quite high, on the order of 160 ms for a simple invocation on a single machine. Overall, these numbers paint a rather pessimistic picture of the performance of Globus and suggest a significant impact from the trend towards web services integration. While a cause for concern, these conclusions must be viewed both as tentative and as coming with caveats. For one thing, the version of Globus tested is still categorized as an alpha-quality development release and is only the third such release of the major revision of Globus that added web services integration. As a result, that performance is less than optimal is not surprising. Indeed, the overall improvement between the first version we tested (3.9.2) and this one (3.9.4) was noticeable, with a reduction in round-trip time from 460 ms to 160 ms. Whether substantial improvements can still be made, however, remains to be seen. Furthermore, it is important to note that the main use of Globus to date has been to provide a middleware layer to support the scheduling and coordination of high performance computing jobs across large area networks. From this perspective, overheads on the order of hundreds of milliseconds for stabilized round-trip times or seconds for startup times may not matter if a job runs for minutes, hours, or even days. However, if Globus is to be used as a coordination platform for applications having tighter timing constraints such as would be found for stock trading, health care monitoring, or gaming, then our experiments suggest that such an architectural choice should be considered carefully. The performance impact might also be unacceptable even for high performance grid applications if they need to repeatedly invoke another grid service such as a logging service. Our future work will focus on deeper investigations into the issues raised in this paper. For example, an important question is whether the measured latencies might be due at least partially to some inherent inefficiencies in underlying technologies such as XML, SOAP, or HTTP. If so, then some major technological shift such as fast XML technology [9] might be needed to improve the situation. Beyond this, our hope is that this work on identifying sources of ex-
ecution overhead can serve as a guide to developers of grid services, as well as suggest areas in which optimization efforts might be profitable.
References [1] J. M. Anderson, L. M. Berc, J. Dean, S. Ghemawat, M. R. Henzinger, S.-T. A. Leung, R. L. Sites, M. T. Vandevoorde, C. A. Waldspurger, and W. E. Weihl. Continuous profiling: Where have all the cycles gone? ACM Transactions on Computer Systems, 15(4):357–390, Nov. 1997. [2] I. Foster, H. Kishimoto, A. Savva, D. Berry, A. Djaoui, A. Grimshaw, B. Horni, F. Macieli, F. Siebenlist, R. Subramaniam, J. Treadwell, and J. V. Reich. The open grid services architecture, version 1.0. http://www.ggf.org/documents/GWD-I-E/GFD-I.030.pdf, Jan 2005. [3] S. Graham, A. Karmarkar, J. Mischinsky, I. Robinson, and I. Sedukhin. Web services resource 1.2 (wsresource). http://docs.oasis-open.org/wsrf/2004/11/wsrfWS-Resources-1.2-draft-02.pdf, Dec 2004. Document Identifier: wsrf-WS-Resource-1.2-draft-02. [4] S. Graham, P. Kessler, and M. McKusick. Execution profiler for modular programs. Software - Practice and Experience, 13:671–685, 1983. [5] S. Halloway. Use hprof to tune performance. Java developper connection (jdc) tech tips, SUN Microsystems Inc., Jan. 2000. http://developer.java.sun.com/developer/TechTips/2000/tt0124.html#tip2. [6] W. D. Pauw, R. Helm, D. Kimelman, and J. Vlissides. Visualizing the behavior of object-oriented systems. In Proceedings of the eighth annual conference on Object-oriented programming systems, languages, and applications (OOPSLA’93), pages 326–337. ACM Press, 1993. [7] W. D. Pauw, E. Jensen, N. Mitchell, G. Sevitsky, J. M. Vlissides, and J. Yang. Visualizing the execution of java programs. In Software Visualization: International Seminar, Dagstuhl, volume 2269 of LNCS, pages 151–162. SpringerVerlag, 2002. [8] S. P. Reiss and M. Renieris. Generating java trace data. In Java Grande Conference (ACM 2000 conference on Java Grande), pages 71–77, San Francisco, CA, USA, 2000. ACM. [9] P. Sandoz, S. Pericas-Geertsen, K. Kawaguchi, M. Hadley, and E. Pelegri-Llopart. Fast web services. http://java.sun.com/developer/technicalArticles/WebServices/fastWS/, Aug 2003. [10] JavaTM platform debugger architecture (JPDA). Technical Report Java SDK 1.4.2, Sun Microsystems, Inc., 2002. http://java.sun.com/j2se/1.4.2/docs/guide/jpda/. [11] C. X. Zhang, Z. Wang, N. C. Gloy, J. B. Chen, and M. D. Smith. System support for automated profiling and optimization. In Symposium on Operating Systems Principles, pages 15–26, 1997.
14th IEEE Int. Symp. on High Perf. Dist. Computing (HPDC), Research Triangle Park, NC, USA, 24-27 July, 2005 (c) IEEE 2005
11