The implementation of LiveWire approach and volume estimation was applied on 31 data sets showing the left ... segmentation method based on a graph representation and dynamic programming. .... and Fitzpatrick [8], pages 609â674. [4] Paul R. ... [12] Thomas H. Cormen, Charles E. Leiserson, and Ronald L. Rivest.
The LiveWire Approach for the Segmentation of Left Ventricle Electron-Beam CT Images
1) 2)
Martin Urschler, Heinz Mayer, Regine Bolter, Franz Leberl Institute for Computer Graphics and Vision Graz, University of Technology Inffeldgasse 16, A-8010 Graz E-Mail: {urschler, leberl}@icg.tu-graz.ac.at
Abstract: Measuring the volume of heart ventricles is an important issue in heart disease diagnosis. Therefore many radiologists investigate computer tomographic images, searching for representative projections of the left ventricle. They use parametric models by measuring ellipse parameters in certain images under the assumption that the left ventricle has an ellipsoid shape. This paper describes the application of the LiveWire approach, an interactive segmentation technique which can be used as an alternative volume estimation method. The implementation of LiveWire approach and volume estimation was applied on 31 data sets showing the left ventricle in long-axis configuration from EBCT movie-mode images. We found an excellent correlation of 97% between volumes from an expert’s manually drawn ventricle contours and the contours produced with the LiveWire tool. The comparison of the LiveWire volumes with the parametric model shows a correlation of 84% lying in the same range as the manually drawn contours vs. the parametric model (86%). We conclude that LiveWire is an excellent tool for left ventricle segmentation in the hands of a radiologist.
1
Introduction
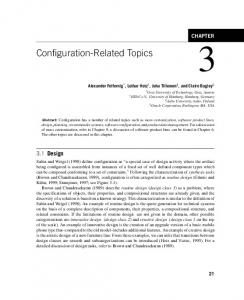
Measuring the volume of left and right ventricle is an important issue in heart disease diagnosis. The ventricles are the two larger chambers of the heart, which are responsible for pumping blood through the body during a heart beat (see Fig. 1a). It is vital to detect diseases affecting both ventricles’ abilities to contract and relax efficiently. Physicians are able to diagnose people with such kinds of diseases by determining the left-ventricular volume at two certain points of time (end-diastolic and end-systolic volumes). For this reason it is necessary to visualize the heart and its geometry. With the introduction of non-invasive techniques 1)
This work was supported by o.Univ.-Prof. Dr. Rainer Rienm¨ uller, Univ. Klinik f. Radiologie, KarlFranzens Universit¨at Graz. 2) This work was partly supported by the Austrian Science Foundation (FWF) under grant P14897.
Figure 1: The four cardiac chambers in a long axis view. The arrows in a) and b) indicate the direction of blood flow. Fig a) shows the location of the left ventricle (LV). Fig. b) indicates the ellipse contour of the parametric model with its long and short axis. (From [3].)
like computer-tomographic [1, 2] and magnetic-resonance imaging [1] into the field of cardiac visualization far more depictive results can be achieved compared to former techniques. In case of cardiac volume estimation one way to benefit from computer-tomographic imaging is the Two-Axes Method by Greene [4]. Physicians investigate computer-tomographic images, looking for representative projections of the left ventricle. After selecting the image showing the left ventricle with maximum projected area, a parametric model is established by measuring width and height of the left ventricle shape from the chosen projection. These parameters are used to approximate the contour of the ventricle with an ellipse (see Fig. 1b). The ellipse is used as the base for a rotational ellipsoid model whose volume can easily be calculated. This paper summarizes the evaluation of an alternative technique for left ventricle volume estimation based on interactive segmentation of the medical images. The method is compared with the parametric model and a segmentation from manually drawn contours [5]. In our case the modality-dependent image acquisition problems (low signal to noise ratio and partial volume effect) are accompanied by problems with muscle tissue reaching into the left ventricle. Furthermore there are many cases where left and right ventricle chambers have grown together. With these problems in mind we have implemented the LiveWire approach, an interactive segmentation method based on a graph representation and dynamic programming. After discussing related work in the following paragraph we present the medical image data and the imaging modality in Section 2. The LiveWire algorithm is explained in Section 3. Section 4 shows our experiments and results and Section 5 gives a conclusion.
Related Work There are many applications of image segmentation techniques in medical image analysis. Most of the researchers in the field use deformable models like e.g. active
contour models [6] or one of its many specializations for segmentation. A collection of papers on deformable models can be found in [7]. Another excellent resource for finding work on medical image segmentation is [8]. More recent approaches incorporate high-level knowledge from training images by e.g. Active Appearance Models [9]. Graph-theoretic approaches for border detection were mainly investigated by two groups in the 1990’s. Falcao et al. [10] proposed the LiveWire segmentation paradigm and at the same time Mortensen et al. [11] presented a similar principle called Intelligent Scissors.
2
Medical Image Data
We used medical image data sets acquired with an Electron-Beam CT (EBCT) located at the Department of Radiology, University Hospital Graz. It is an Imatron Inc. C150 scanner consisting of mechanically fixed x-ray source and detector units. An electron beam is deflected and focused to hit a tungsten target ring. The emitting x-ray energy gets absorbed by detector arrays after passing through the patient. A special mode of the EBCT allows nearly concurrent acquisition of 8 slices of the heart at 10 distinct points of time in the cardiac cycle. Thus, triggered by an ECG, it is possible to acquire image stacks showing the beating heart due to the short exposition time of only 50 ms per slice. To separate different tissues with similar absorption coefficients, i.e. heart muscle and blood, iodinated contrast medium is used. Iodine is capable of absorbing approximately 6 times more x-ray energy than blood or muscle tissue. With a certain concentration of iodine contained in blood an easy distinction of iodinated blood and muscle tissue is possible. Our images are taken in the long axis configuration (see Fig. 2a). This configuration is capable of showing all 4 heart chambers in the images. The images consist of 360x360 pixels with each pixel representing a physical distance of 0.83 mm in x- and y-direction. In z-direction the voxel size is 8 mm. We have a radiometric resolution of 4096 distinct grey values. Fig. 2b shows a data set of adjacent slices at a certain point of time. The most important restriction coming from the tomographic image reconstruction technique is the partial volume effect. Due to the fact that all tissues contained in a finite volume (voxel) are mapped to a single discrete value during scanning it is impossible to determine details in the volume which are smaller than the voxel size.
3
LiveWire Segmentation
In medical image segmentation there are often situations when automatic segmentation techniques fail or lead to a suboptimal solution. As a consequence an expert has to correct results in a manual fashion. Providing the expert with a tool that supports manual segmentation
Figure 2: a) illustrates the long axis slicing configuration. b) shows 5 adjacent slices of the heart region at a certain point of time. Manually drawn contours locate the left ventricle.
but at the same time speeds up this tedious process, gives immediate feedback, and makes the results repeatable, is a far better choice in such a case. For interactive segmentation an effective strategy is to exploit the synergy between a human operator who is superior in object recognition and an algorithm which is better in exact object delineation. The interactive LiveWire [10] algorithm utilizes methods from graph theory for achieving these abilities. An image constitutes a directed graph where the pixel vertices are graph nodes and oriented pixel edges represent edges of the graph. Graph edges are weighted with costs which are derived from image gradient magnitude and direction information. The basic problem of finding a boundary segment is therefore converted to finding a minimum-cost path between start and end vertex of the segment. To find this optimal path dynamic programming is used. Implementation - Intelligent Scissors Algorithm Our implementation is based on the paper by Mortensen et al. [11]. They define graph edges as the connection of two 8-adjacent image pixels. A local cost function is assigned to the graph edges to weight their probability of being included in an optimal path. We use three static feature components to form this cost function. The Laplacian of Gaussian (LoG) fZ at three different scales (5x5, 9x9 and 15x15 LoG kernel) is calculated to detect zero crossings. The gradient magnitude fG at each pixel is calculated by filtering with horizontal and vertical Sobel kernels. This feature performs a distinction between stronger and weaker edges. Finally, the gradient direction fD is calculated to add a smoothness term to the boundary definition by assigning high costs to sharp changes. These three static features are properly normalized and combined by weighted summation (ωZ , ωG and ωD ) to form a single static local cost
function lS : lS = ωZ ∗ fZ + ωG ∗ fG + ωD ∗ fD
Shortest path searching After representing each image pixel as a graph vertex and assigning the local cost function to the graph edges between pixel, we can perform segment detection by finding shortest paths in the graph representation. The solution to this problem is given by Dijkstra’s algorithm [12] which solves the single-source shortest-path problem on a weighted, directed graph for the special case where edge weights are non-negative. The result of Dijkstra’s algorithm is a pre-calculated map of shortest paths with respect to a specified start vertex. This start point has to be placed by the user on the boundary. Now while moving the mouse cursor around, the globally optimal path connecting initial and current point gets looked up in the shortest path map and displayed. As a consequence by moving the mouse cursor close to a boundary the LiveWire snaps onto it. Fig. 3 shows some steps of this procedure. An important feature of our implementation is path cooling. It means that the contour is saved after a certain length has been reached and a new shortest path map is calculated with the previous contours’ end point as initial vertex. This feature is useful to outline connected segments spanning over a larger area.
Figure 3: Example for drawing a LiveWire contour. The leftmost image shows the seed point, afterwards we drag the mouse cursor along the ventricle border. On the left side of the border it becomes necessary to set some additional start points (path cooling).
4
Experiments & Results
For the evaluation of the LiveWire algorithm 31 medical image data sets were provided by the Department of Radiology, University Hospital Graz. Prof. Rienm¨ uller segmented the contours manually to provide a reference segmentation. Furthermore the parametric model which is used at the Department of Radiology for volume calculation was applied to the data sets. We found a correlation between volumes from manually drawn contours and volumes calculated with the parametric model of 86% in the end-diastolic and 82% in the end-systolic case. To
perform the actual LiveWire segmentation we tried to reproduce the manually drawn expert contours. In this way our lack of radiological experience didn’t lead to a selection of obviously wrong regions. Figure 4 shows a comparison of the volumes from the LiveWire contours and the volumes from the manually drawn contours. All 31 data sets were used for this evaluation.
Figure 4: Evaluation of volumes by means of LiveWire segmentation compared to the results from the manually drawn contours.
We can see that there is an excellent correlation of 97% with a nearly linear regression between the two methods. Obviously the consequence of this result is that it is possible to imitate the contour definition of an experienced radiologist by simply looking at his contours and drawing the LiveWire contour. So it can be assumed that LiveWire would be a very powerful tool to speed up accurate processing if used by an experienced radiologist. The tedious manual segmentation of our images takes a radiologist about 15 seconds per slice on average provided that he doesn’t have to delete segments due to a segmentation error. With the LiveWire tool it is possible to segment an image by defining 3-5 points which takes about 5 seconds on average. Despite this speed-up compared to manual processing segmentation of a data-set still takes long because every image of the data set has to be processed. Another disadvantage is that automation of LiveWire is not easily possible. The comparison of the LiveWire volumes with the parametric model leads to a correlation of 84% and 78%. This result (see Fig. 5) lies in the same range as the comparison of parametric model and manually drawn contours. Finally Fig. 6 shows an example for the segmentation capabilities of the algorithm, which demonstrates the high accuracy and flexibility of the method.
5
Conclusion
In this work we presented a highly interactive graph-theoretic segmentation algorithm and its application to medical image data sets showing the left heart ventricle. To speed up volume
Figure 5: Evaluation of volumes by means of LiveWire segmentation compared to the results from the volume estimation using the parametric model.
Figure 6: Example for a successful LiveWire segmentation.
calculation of the heart chamber from Electron Beam CT data it is necessary to quickly draw ventricle contours in a reproducible manner. We found that the LiveWire segmentation paradigm is well suited for the purpose of left
ventricle segmentation by comparing it with manually drawn contours of 31 data sets. An excellent correlation of 97% compared to manual segmentation and an average speed-up of factor 3 demonstrates this issue. Future work can lead to further speed-up by utilizing 3D LiveWire methods, which learn information from adjacent image slices. We conclude that the LiveWire tool is very powerful in the hands of an experienced radiologist, while producing the same accuracy and reproducibility as a manual segmentation.
References [1] Raj Acharja, Richard Wasserman, Jeffrey Stevens, and Carlos Hinojosa. Biomedical Imaging Modalities: An Overview. In Singh et al. [7], pages 20–44. [2] William Stanford and John A. Rumberger. Ultrafast Computed Tomography in Cardiac Imaging: Principles and Practice. Futura Publishing Company, Inc., Mount Kisco, NY, USA, 1992. [3] Florence Sheehan, David C. Wilson, David Shavelle, and Edward A. Geiser. Echocardiography. In Sonka and Fitzpatrick [8], pages 609–674. [4] Paul R. Lichtlen. Beitr¨ age zur Kardiologie: Band 11: Koronarangiographie. Perimed Verlag Dr. med. D. Straube, Erlangen, Deutschland, 1979. [5] Martin Urschler. Image-Based Verification of Parametric Models in Heart-Ventricle Volumetry. Master’s thesis, University of Technology Graz, 2001. [6] M. Kass, A. Witkin, and D. Terzopoulos. SNAKES: Active Contour Models. International Journal of Computer Vision, 1(4):321–332, January 1988. [7] Ajit Singh, Dmitry Goldgof, and Demetri Terzopoulos, editors. Deformable Models in Medical Image Analysis. IEEE Computer Society Press, Los Alamitos, CA, USA, 1998. [8] Milan Sonka and J. Michael Fitzpatrick, editors. Handbook of Medical Imaging: Volume 2 - Medical Image Processing and Analysis. SPIE - The International Society for Optical Engineering, 2000. [9] Steven C. Mitchell, Boudewijn P. F. Lelieveldt, Rob J. van der Geest, Hans G. Bosch, Johan H. C. Reiber, and Milan Sonka. Multistage Hybrid Active Appearance Model Matching: Segmentation of Left and Right Ventricles in Cardiac MR Images. 20(5):415–423, 2001. [10] A.X. Falcao, J.K. Udupa, S. Samarasekera, S. Sharma, B.E. Hirsch, and R.D.A. Lotufo. User-steered Image Segmentation Paradigms - Live Wire and Live Lane. Graphical Models and Image Processing, 60(4):233–260, 1998. [11] E.N. Mortensen and W.A. Barrett. Interactive Segmentation with Intelligent Scissors. Graphical Models and Image Processing, 60(5):349–384, September 1998. [12] Thomas H. Cormen, Charles E. Leiserson, and Ronald L. Rivest. Introduction to Algorithms. MIT Electrical and Computer Science Series. MIT Press, 1992.