Livewire based single still image segmentation Jun Zhanga, Rong Yang*a, Xiaomao Liub, Hao Yuea, Hao Zhua, Dandan Tiana, Shu Chenc, Yiquan Lic, Jinwen Tiana a National Key Labrotary of Science & Technology on Multi-spectral Information Processing, Huazhong University of Science and Technology, Wuhan 430074, P. R. China; b School of Mathematics and Statistics, Huazhong University of Science and Technology, Wuhan 430074, P. R. China; c China Nuclear Power Operation Technology Corporation LTD, Wuhan 430223, P. R. China ABSTRACT In the application of the video contactless measurement, the quality of the image taken from underwater is not very well. It is well known that automatic image segmental method cannot provide acceptable segmentation result with low quality single still image. Snake algorithm can provide better result in this case with the aiding of human. However, sometimes the segmental result of Snake may far from the initial segmental contour drawn by user. Livewire algorithm can keep the location of the seed points that user selected nailed from the beginning to the end. But the contour may have burrs when the image’s noise is quite high and the contrast is low. In this paper, we modified the cost function of Livewire algorithm and proposed a new segmentation method that can be used for single still image segmentation with high noise and low contrast. Key words: Semi-automatic image segmentation, LiveWire, Snake, Enhanced LiveWire
1. INTRODUCTION Computer vision technology is playing an increasingly important role in the industrial image defect detection. It has been widely used in many areas such as X-ray weld inspection, precision machined parts’ surface defect detection, and so on. In the application of the video contactless measurement, the quality of the image taken from underwater is not very well. These images have high noise and low contrast. Our video inspection equipment can inspect the defect clearly, but cannot measure the size of the defects accurately. It is well known that automatic image segmental method cannot provide an acceptable segmentation result with low quality single still image. In recent years, interactive edge detection has been getting more and more attention in medical image edge detection. There are two basic goals in the research of the interactive edge detection. The first one is to guarantee the final result always fits user’s demand. The second one is to reduce the frequency of the aiding of human, as well as the time of aiding. Snake algorithm can provide better result in this case by the aiding of human. However, sometimes the segmental result of Snake may far from the initial segmental contour draw by user. So, Snake algorithm cannot guarantee the final result always fits user’s demand. However, sometimes the segmental result of Snake may far from the initial segmental contour drawn by user. So, Snake algorithm cannot guarantee the final result always fits user’s demand. Livewire algorithm can keep the location of the seed points that user selected nailed from the beginning to the end. From this point of view, Livewire algorithm can guarantee the final result fits user’s demand. But the cost function used in Livewire algorithm is easily affected by noise. We cannot use Livewire algorithm directly for our single still image segmentation with high noise. In this paper, we modified the cost function of Livewire algorithm and proposed a new segmentation method that can be used for single still image segmentation. In our method, the cost function is consisted of two parts. One is interrelated with the gradients. Another part is interrelated with Canny operator. Both parts of the cost function can be obtained from a single *
[email protected]
MIPPR 2011: Multispectral Image Acquisition, Processing, and Analysis, edited by Zhiguo Cao, Aaron Fenster, Laszlo G. Nyul, Chao Cai, Proc. of SPIE Vol. 8002, 80021M · © 2011 SPIE · CCC code: 0277-786X/11/$18 · doi: 10.1117/12.902224 Proc. of SPIE Vol. 8002 80021M-1 Downloaded from SPIE Digital Library on 04 Jan 2012 to 202.114.10.246. Terms of Use: http://spiedl.org/terms
still image. Experimental results show that the new method can provide the segmentation results that fit the user’s demand even with the low quality single still image. We present an overview of Snake algorithm in section 2.1. The basic idea of LiveWire is discussed in section 2.2 and 2.3. Our new segmentation method is then provided in sections 3. Experimental results are shown in section 4, and following by is our conclusion.
2. METHODS 2.1 Snake Algorithm Parametric active contour model, or classical Snake model, is a curve v(s) = [x(s), y(s)], s ∈ [0, 1], that moves through the spatial domain of an image to minimize the energy functional[1]
Esnake(V ( s )) =
1
∫ Esnake(ν( s )) = 0
1
∫E 0
int
(ν( s )) + Eimage(ν( s )) + Econ(ν( s )) ds ,
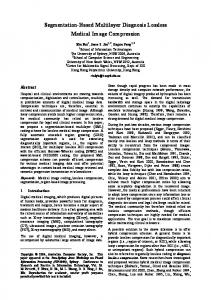
where Eint represents the internal energy of the spline due to bending, Eimage gives rise to the image forces, and Econ gives rise to the external constraint forces. It can convert to get the minimum curve of the functional problem. Then we can use Euler equation or other optimization methods to solve it. With the finite difference, we can discrete the Euler equation and get the local optimal solution. There are three difficulties to be solved in image segmentation with Snake model. The first one is that we have to place the initial contour near the ROI’s contour and the segmental result is related with the location and the shape of the initial contour. The second one is that we can hardly get the contour of the recessed area. The third one is that the curve is tended to converge to the local maximum gradient or isolated edges. In order to solve the problem of convergence to recessed area, Xu[2] has proposed gradient vector flow to replace the gradient field in Snake model. Before iteratively computing, we get the GVF by solving some partial differential equations to expand the scope of the boundaries’ force field. However, GVF still cannot solve the convergence to the local maximum gradient and passing through the weak edges in the ROI. Since Snake cannot overcome this difficulties. Barrett and Mortensen proposed an interactive edge detection method called LiveWire algorithm based on dynamic programming. Dynamic programming is a method that can solve the optimizing of multi-stage decision-making process problem[3]. In 1951, American mathematician Richard Bellman expressed multi-stage decision-making as a series of single-stage decision-making problem. Decompose an N-variable problem into N problems to solve one by one. The basic idea of LiveWire is to formulate the image as a weighted graph where pixels represent nodes with directed, weighted edges connecting each pixel with its 8 adjacent neighbors [4, 5]. Dijkstra’s graph searching algorithm gets the optimal path. The path is the contour that user needs. 2.2 Dijkstra’s Graph Searching Algorithm To formulate the image as a weighted graph, pixels represent nodes with directed, weighted edges connecting each pixel with its 8 adjacent neighbors. In Fig.1, circles represent nodes, or pixels in images that to be segmented. Lines between nodes represent contours.
Fig. 1. Pixels represent nodes with directed, weighted edges.
Proc. of SPIE Vol. 8002 80021M-2 Downloaded from SPIE Digital Library on 04 Jan 2012 to 202.114.10.246. Terms of Use: http://spiedl.org/terms
When the pixel is on the contour, it has low weight. On the contrary, when the pixel is not on the contour, its weight is high. Arcs between adjacent nodes’ cost is 0, while between non-adjacent the cost is +∞. Then we can convert edge detection into finding the shortest path between the start point and the end point. In 1959, Dijkstra proposed an algorithm called Dijkstra Algorithm that can find the shortest path step by step by the path’s length in increasing order. Given initial graph G = (V, E). Algorithm separates the vertexes into two parts: one is vertex set of the shortest path (expressed by S), the other is the left vertex set (expressed by U). Add the vertexes in U to S one by one by the path’s length in increasing order. During updating the vertex set, we should keep the distance between the source vertex v and the vertex in S not bigger than that between the source vertex v and the vertex in U. Also, the shortest path of every vertex is not bigger than the distance from the source vertex v t it. Fig.2 and Fig.3 show the basic idea of the algorithm.
Fig. 2. Initial graph G. The dark circle represents the start vertex. The numbers on circles’ left head represent the cost from adjacent vertex. The numbers in circles represent local distance from the start vertex.
Fig. 3. The process of Dijkstra algorithm. The circles colored in dark gray represent the vertexes in S. The circles colored in light gray represent the vertexes to be added into S in the next step.
2.3 Local Costs If p and q are two neighboring pixels in the image, then l ( p , q ) represents the local cost on the directed link (or edge) from p to q. The local cost function is a weighted sum of component cost functions on each of the following image features.
l ( p , q ) = ωG ⋅ f G (q ) + ωZ ⋅ f Z (q ) + ω D ⋅ f D (p , q ) ,
Proc. of SPIE Vol. 8002 80021M-3 Downloaded from SPIE Digital Library on 04 Jan 2012 to 202.114.10.246. Terms of Use: http://spiedl.org/terms
where l ( p , q ) represents the local cost on the directed link (or edge) from p to q. ωG, ωZ and ωD are the weights of the corresponding feature function. fG ( q ) represents the gradient magnitude, f Z ( q ) represents The Laplacian zero-crossing , and f D( p , q ) represents gradient direction.
fG ( q ) =
G′ max(G′) − G′ = 1− ′ max(G ) max(G′)
G′ = G − min(G ) where G( q ) represents the gradient magnitude of q . The Laplacian zero-crossing is used to create a binary local cost feature. If a pixel is on a zero-crossing then the component cost for all links to that pixel is low; otherwise it is high. That is, if I L( q ) is the Laplacian of the original image, then
⎧0;
I L( q ) = 0
⎩1;
I L( q ) ≠ 0
f Z (q ) = ⎨
The gradient direction or orientation adds a smoothness constraint to the boundary by associating a relatively high cost for sharp changes in boundary direction.
f D( p , q ) =
{
[
]
[
2 arccos D (p ) ⋅ p − q + arccos D (q ) ⋅ p − q 3π
]}
where D(·) is unit vector of the gradient direction at a point p.
3. ENHANCED LOCAL COSTS Since classical LiveWire is related with Laplacian zero-crossing and gradient, as is known, Laplacian zero-crossing is very sensitive to the noise and the edge we get by it is double-pixel. Therefore, when the images have low contrast and high noise, classical LiveWire cannot give an accurate result. In order to decrease the interference of noise and low contrast, we proposed to enhance the cost function. Our enhanced method is consisted of two parts. One of them is interrelated with the gradient. Another part is interrelated with Canny operator. Both parts of the cost function can be obtained from a single still image. If p and q are two neighboring pixels in the image, then l ( p , q ) represents the local cost on the directed link (or edge) from p to q . The local cost function is a weighted sum of component cost functions on each of the following image features.
l ( p , q ) = ωG ⋅ fG′ (q ) + ωZ ⋅ f Z (q ) + ωC ⋅ fC (q )
,
The enhanced livewire cost function is defined by gradient magnitude; Laplacian zero-crossing and Canny’s edge detect results. When we use pixels with its 8 adjacent neighbors, the edge is smooth enough to omit the gradient direction function. Since we want to distinguish the strong edges from weak edges, we have to choose a non-linear mapping. We propose to enhance the gradient function to be,
fG′ (q ) =
1 0. 3 ⋅ G (q ) + 1
where G (q ) represents the gradient magnitude of q . The Canny edge detection operator was developed by John F. Canny in 1986 and uses a multi-stage algorithm to detect a wide range of edges in images. The Canny algorithm is adaptable to various environments. Its parameters allow it to be tailored to recognition of edges of differing characteristics depending on the particular requirements of a given implementation. We propose to enhance the Canny function[6] to be,
Proc. of SPIE Vol. 8002 80021M-4 Downloaded from SPIE Digital Library on 04 Jan 2012 to 202.114.10.246. Terms of Use: http://spiedl.org/terms
⎧0;
I C( q ) = 0
⎩1;
I C( q ) ≠ 0
f C( q ) = ⎨ where IC(q) is the Canny result of the original image.
4. EXPERIMENTAL RESULTS In order to verify the accuracy and the efficiency of our enhanced algorithm, we have used lots of images with high noise and low contrast. GVF-Snake algorithm, classical LiveWire and our enhanced LiveWire are used to detect the contour of the defects. In our enhanced method, ωG = 0.4, ωZ =0.4 and ωC = 0.2. In Fig.4(a), we can see a scratch clearly in the middle of the image. And there are many dark points around the scratch to be segmented. In Fig.4(b), GVF-Snake algorithm is used to delineate the contour of the scratch. The dark gray line is the contour calculated by GVF-Snake. It is obviously that the contour is not accurate visually. There are many burrs on the contour caused by the dark points and noise around the scratch. Besides, we can see clearly that the contour goes across the scratch on the top of it. Apparently, the contour cannot fit our demand. In Fig.4(c), the classical LiveWire is used to delineate the contour of the scratch. Since we can control the contour where existing a dark point or high noise, the contour is far more accurate than that in Fig.4(b). But it still has some burr in the bottom right corner of the scratch. We can remove it by adding a seed point there certainly, but this will increase the frequency of user’s aiding.
(a)
(b)
(c)
Fig.4. Visual comparison of techniques on defect image. (a) Original image. (b) Dark gray lines represent edges resulting from GVF-Snake algorithm. (c) Dark gray lines represent edges resulting from classical LiveWire algorithm, light gray points on the edges represent seed points.
In Fig.5(a), enhanced gradient cost function is used to instead the classical one. Other parts of the cost function are the same with the classical cost function. Compared with Fig.4(c), we can see that the burr in the bottom right corner is smaller in Fig.5(a). What’s more, in Fig.4(c) we need at least 7 seed points to delineate the contour, but in Fig.5(a), we only need 4 seed points. This reduces much frequency of user’s aiding, saves a lot of time to delineate the defect’s contour. In Fig.5(b), Canny operator is used to extract the edges. The scratch’s edge is very clear. In our cost function, these edges will get small cost so that the optimal path will cross them. In Fig.5(c), enhanced Canny cost function is used to instead the gradient direction cost function in classical LiveWire algorithm. Other parts of the cost function are the same with the classical LiveWire algorithm. Compared with Fig.4(c), we can see that there is no burr on the contour of the scratch in Fig.5(c) with the same seed points. This suggests that when Canny operator can get the edges clearly (in Fig.5(b)), the Canny operator cost function in LiveWire cost function will play an important role in delineating the contour accurately. In Fig.5(d), enhanced gradient cost function, Laplacian zero-crossing and enhanced Canny cost function are used. Compared with Fig.4(c), we can see that the contour needs only 4 seed points and there is no burr on the contour of the scratch. This suggest that our enhanced LiveWire algorithm can decrease the frequency of user’s aiding, as well as get an delineate the contour that fits user’s demand in images that can be extracted clear edges by Canny operator more than the classical LiveWire algorithm.
Proc. of SPIE Vol. 8002 80021M-5 Downloaded from SPIE Digital Library on 04 Jan 2012 to 202.114.10.246. Terms of Use: http://spiedl.org/terms
(a)
(b)
(c)
(d)
Fig.5. Visual comparison of techniques on defect image. (a) Enhanced gradient cost function. (b) Canny operator result. (c) Enhanced Canny cost function. (d) Enhanced LiveWire algorithm.
In Fig.6(a), we can recognize two screws in the image. Both of the screws have some fuzzy parts and a lot of noise around them. In Fig.6(b), GVF-Snake algorithm is used to delineate the contour of the screws. The dark lines are the contours calculated by GVF-Snake. It is obviously that the contours are not accurate visually. The one on the left is far smaller than the screw’s real shape. The one on the right goes across the screw on the left corner. Apparently, the contours cannot fit our demand. In Fig.6(c), the classical LiveWire is used to delineate the contour of the screws. Since we can control the contour where existing fuzzy points or high noise, the contour is far more accurate than that in Fig.6(b). But we cannot tell some parts are the edges or not visually, the contours in Fig.(c) are just fit to our demand in vision. And it needs so many seed points, in other words, it need so too frequency of user’s aiding.
(a)
(b)
(c)
Fig. 6. Visual comparison of techniques on defect image. (a) Original image. (b) Dark gray lines represent edges resulting from GVF-Snake algorithm. (c) Dark gray lines represent edges resulting from classical LiveWire algorithm, light gray points represent seed points.
In Fig.7(a), enhanced gradient cost function is used to instead the classical one. Other parts of the cost function are the same with the classical cost function. Compared with Fig.6(c), we can see that the contour in Fig.7(a) is nearly the same but the seed points is less than that in Fig.6(c). This reduces much frequency of user’s aiding, saves a lot of time to delineate the defect’s contour. In Fig.7(b), Canny operator is used to extract the edges. We can see that some parts are still fuzzy in the result of Canny operator. In Fig.7(c), enhanced Canny cost function is used to instead the gradient direction cost function in classical LiveWire algorithm. Other parts of the cost function are the same with the classical LiveWire algorithm. Compared with Fig.6(c), we can see that the contour in Fig.7(c) is nearly the same and also need a lot of seed points to delineate the contour. This suggests that when Canny operator cannot get the edges clearly (in Fig.7(b)), the Canny operator cost function in LiveWire cost function cannot help to delineate the contour accurately. In Fig.7(d), enhanced gradient cost function, Laplacian zero-crossing and enhanced Canny cost function are used. Compared with Fig.6(c), we can see that the contour needs less seed points in Fig.7(d), the contours are nearly the same except the arc on the top corner of the screw on the right. This suggest that our enhanced LiveWire algorithm can decrease the frequency of user’s aiding, and get a smoother, more definitive contour in images with high noise and low contrast than the classical LiveWire algorithm.
Proc. of SPIE Vol. 8002 80021M-6 Downloaded from SPIE Digital Library on 04 Jan 2012 to 202.114.10.246. Terms of Use: http://spiedl.org/terms
(a)
(b)
(c)
(d)
Fig.7. Visual comparison of techniques on defect image. (a) Enhanced gradient cost function. (b) Canny operator result. (c) Enhanced Canny cost function. (d) Enhanced LiveWire algorithm.
5. CONCLUSION We improved upon the original performance of LiveWire and used our improved algorithm in defect detection with industrial defect images. Taking into consideration non-linear mapping gradient cost function, we decreased the number of seed points used to aid delineate the contour. Besides, adding the Canny operator into our cost function makes the improved algorithm delineate a smoother and more definitive contour in images that even have high noise and low contrast. Our experimental results show that the new method can provide the segmentation results that fit the user’s demand and reduce the frequency of user’s aiding even with the low quality single still image.
ACKNOWLEDGEMENTS The referees’ comments greatly improved the presentation and content of this article. This research was supported by the weapons and equipment pre-research fund (9140A01030509JW0507) and the central university basic scientific research business expenses special fund (2011TS090).
REFERENCES 1. M. Kass, A. Witkin, "Snakes: active contour models," International Journal of Computer Vision. 1(4), 321–332 (1988). 2. C. Xu, J. L. Prince, "Snakes, Shapes, and Gradient Vector Flow," IEEE Transactions on image process. 7(3), 359-369 (1998). 3. A. Amini, "Using dynamic programming for solving variational problems in vision," IEEE Transactions on Pattern Analysis and Machine Intelligence. 12(9), 855-867 (1990). 4. A.X. Falcão, J. K. Udupa, "User-steered image segmentation paradigms: LiveWire and LiveLane," Graphical Models and Image Processing. 60(4), 233-260 (1998). 5. E. N. Mortensen and W. A. Barrett, "Interactive segmentation with intelligent scissors," Graphical Models and Image Processing. 60(5), 349–384 (1998). 6. J. Dang and F. Zhang, "Research and improvement of LiveWire interactive algorithm for medical image segmentation," Application Research of Computers. 25(8), 915-917 (2008).
Proc. of SPIE Vol. 8002 80021M-7 Downloaded from SPIE Digital Library on 04 Jan 2012 to 202.114.10.246. Terms of Use: http://spiedl.org/terms