Objectives: To evaluate the reliability and sensitivity of performance measures in a novel pace-bowling test. Methods: Thirteen male amateur-club fast bowlers ...
International Journal of Sports Physiology and Performance, 2018, 13, 151-155 https://doi.org/10.1123/ijspp.2017-0140 © 2018 Human Kinetics, Inc.
ORIGINAL INVESTIGATION
The Reliability and Sensitivity of Performance Measures in a Novel Pace-Bowling Test Simon A. Feros, Warren B. Young, and Brendan J. O’Brien Objectives: To evaluate the reliability and sensitivity of performance measures in a novel pace-bowling test. Methods: Thirteen male amateur-club fast bowlers completed a novel pace-bowling test on 2 separate occasions, 4–7 d apart. Participants delivered 48 balls (8 overs) at 5 targets on a suspended sheet situated behind a live batter, who stood in a right-handed and left-handed stance for an equal number of deliveries. Delivery instruction was frequently changed, with all deliveries executed in a preplanned sequence. Data on ball-release speed were captured by radar gun. A high-speed camera captured the moment of ball impact on the target sheet for assessment of radial error and bivariate variable error. Delivery rating of perceived exertion (0–100%) was collected as a measure of intensity. Results: Intraclass correlation coefficients and coefficients of variation revealed excellent reliability for peak and mean ball-release speed, acceptable reliability for delivery rating of perceived exertion, and poor reliability for mean radial error, bivariate variable error, and variability of ball-release speed. The smallest worthwhile change indicated high sensitivity with peak and mean ball-release speed and lower sensitivity with mean radial error and bivariate variable error. Conclusions: The novel pace-bowling test incorporates improvements in ecological validity compared with its predecessors and can be used to provide a more comprehensive evaluation of pace-bowling performance. Data on the smallest worthwhile change can improve interpretation of pace-bowling research findings and may therefore influence recommendations for applied practice. Keywords: cricket, bowling speed, bowling accuracy, smallest worthwhile change Pace bowling is an integral and exciting component of the international game of cricket. Pace bowlers form the majority of the “bowling attack” against opposition batters. The International Cricket Council ranks and scores bowlers in each match format (ie, Twenty20, One-Day International, Test) based on the number of dismissals taken (ie, wickets), the performance score of the dismissed batters, and the number of runs conceded, while other factors such as total runs scored in the match, bowling workload, and match result also have an influence.1 This scoring and ranking system has 2 notable limitations: Only international-standard bowlers are evaluated, meaning that a majority of bowlers who participate in cricket worldwide are not scored, and the performance score is influenced by factors outside the bowlers’ control (eg, fielding errors, environmental conditions) and therefore does not truly reflect their standard of performance. Speed, accuracy, and consistency (of speed and accuracy) are performance variables that are within the control of a pace bowler and are arguably important to match performance. Bowling fast reduces the batter’s reaction time and movement time,2 which may lead to the batter not striking the ball or mistiming the ball strike. Consistently fast delivery speeds prolong this advantage over the batter. An accurate delivery refers to a ball that has followed the pace bowler’s intended trajectory (line and length). An accurate delivery can result in a dismissal or reduce the number of runs scored by the batter. Consistently accurate bowling means that the grouping of deliveries of an intended trajectory is closer together (ie, less variability in trajectory). Bowling with less variability in accuracy can arguably make it difficult for batters to score
Feros is with the School of Exercise and Nutrition Sciences, Deakin University, Waurn Ponds, VIC, Australia. Young and O’Brien are with the Faculty of Health, Federation University Australia, Mt Helen, VIC, Australia. Feros (simon.feros@ deakin.edu.au) is corresponding author.
throughout a bowling spell, as the bowler or captain can position fielders in areas where the batter is most likely to hit the ball. This can subsequently lead to an increase in scoring pressure and poorer decision making and stroke play from the batter. Some of these performance variables have been assessed in a variety of pace-bowling tests.3–5 However, several inconsistencies appear between tests, ranging from the test environment, pitch and cricket-ball characteristics, implemented warm-ups, testfamiliarization procedures, permitted run-up lengths, bowling-spell lengths, delivery sequence, test instructions, and how bowling speed and accuracy data are collected and reported. To date, no pace-bowling test has included a live batsman to provide bowlers with specific cues for accuracy purposes. One test involved bowlers delivering to a superimposed image of a right-handed batsman on a vertical target sheet,3 with no bowling to a left-handed batsman. Furthermore, a slower ball delivery has not been included in a pacebowling performance test. This type of delivery is often used to bring about a mistimed stroke from the batter. Of further concern is the lack of established reliability and sensitivity in measurements of consistency (speed and accuracy). Knowing the reliability and sensitivity of all pace-bowling performance measures would allow researchers to more accurately quantify pace-bowling performance after short- and long-term interventions. A standardized test would be beneficial to ensure consistency in testing and data-collection procedures in future pace-bowling research. The limitations and methodological differences between tests highlight the need for the development of a standardized and more ecologically valid pace-bowling test with established reliability and sensitivity. Therefore, the aim of this investigation was to evaluate the reliability and sensitivity of performance measures in a novel and more ecologically valid pace-bowling test. For the purposes of this investigation, reliability referred to how reproducible (or similar) a measure was between tests,6 while sensitivity indicated the ability of a measure to detect small but important changes in performance.7 151
152
Feros, Young, and O’Brien
Methods
Downloaded by Ebsco Publishing on 03/07/18, Volume ${article.issue.volume}, Article Number ${article.issue.issue}
Subjects Thirteen male amateur community-standard pace bowlers (mean ± SD age 22.8 ± 5.6 y, weight 80.2 ± 11.9 kg, height 1.82 ± 0.07 m) from the Ballarat Cricket Association (A- and B-grade standard) participated in this investigation. Eleven of the participants were right-handed bowlers, and 2 were left-handed bowlers. All procedures were approved by Federation University’s human research ethics committee (project number A12-086), and written informed consent was obtained for each participant or parent/guardian prior to the commencement of the study. Participants were included if they had been free from injury for at least 6 months prior to the time of testing.
Design The study used a repeated-measures design. Participants completed a pace-bowling test at the same time of day on 2 separate occasions 4 to 7 days apart. This followed 6 familiarization sessions dispersed over 3 weeks for the participants to learn the pace-bowling test and to provide ample bowling workload for them in the off season. The familiarization period permitted pace bowlers to become accustomed to the swing characteristics of the cricket balls and the ballbounce characteristics of the synthetic-grass cricket pitch used in the test. Participants were instructed to refrain from alcohol and caffeine consumption 24 hours prior to testing and to avoid any form of resistance training for 48 hours.
Methodology A standardized general and specific warm-up preceded the test, involving 20-m shuttle runs of progressive intensity, side-toside shuffles, 15-m submaximal sprints, and dynamic stretches. Participants delivered 10 warm-up balls of progressive intensity (60–95% perceived exertion) to a variety of targets. A new 156-g 2-piece red cricket ball (Tuf Pitch, Kookaburra, Melbourne, Australia) was used for the warm-up and subsequent test. A 1-minute recovery followed the warm-up, and participants were instructed as follows prior to test: Bowl as fast, accurate, and consistently as possible as you would in a match. We are measuring all of these elements. At different times throughout the test, you will be instructed to bowl some deliveries at maximal speed and some deliveries with your preferred slower ball. Your speed and accuracy with these balls is also measured. The test was conducted indoors on a synthetic-grass pitch, with an extended but enclosed portion of the run-up situated outside. Ambient temperature was controlled indoors and ranged from 19°C to 21°C throughout testing sessions. Participants were tested in pairs per session. As one would bowl an over, the other performed fielding activities to better replicate cricket match play.8 These fielding activities included a 5-m walk in with the bowler each delivery. On the second and fourth deliveries of the over, a wicket keeper rolled out a cricket ball along the ground, and the bowler performed an additional 10-m sprint to field the ball, followed by an underarm throw to a set of cricket stumps. Participants swapped after the over was completed. The test was 8 overs long (48 legal deliveries) per participant. The popping crease at the bowler’s end of the wicket was monitored each delivery for any front-foot no-balls. If the bowler
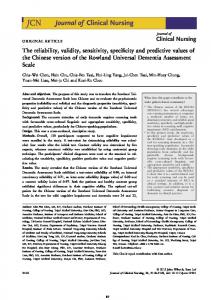
overstepped the line or bowled the ball off the wicket, the delivery had to be immediately bowled again. A delivery instruction detailing the target to aim at (after bounce) and intensity of the bowl (match-intensity, maximal-effort, slower ball) was provided at the start of the run-up. A suspended white vinyl sheet hung from a horizontal pole at the batting crease, and drawn on it were 5 black circular crosshair targets and cricket stumps (Figure 1). Pilot testing determined the appropriate location of the yorker target (fullpitched delivery directed at the batter’s feet) to be 30 cm above the base of the middle stump with respect to the stance of a live batter and the bounce of the new ball. The batter “took guard” on the line of middle stump and stood with feet parallel and either side of the popping crease. A live batter was included for 2 primary reasons: to provide specific cues for the bouncer (short-pitched delivery targeting the batter’s head) and yorker deliveries and to enhance the ecological validity of the test. Prior to delivery the batter was instructed on stance (right- or left-handed) and delivery target. The batter attempted to evade each delivery with a preplanned movement but only initiated movement after the ball was released. The timing of this movement was confirmed though analysis of high-speed camera footage in specialized software (Redlake MASD MotionScope, Redlake Imaging Corp, Morgan Hill, CA). The high-speed camera (PCI 2000 S, Redlake Imaging Corp) operated at 250 frames/s and a shutter speed of 0.004 second. Given the standard of the pace bowlers in this investigation, the batter usually had no difficulty in taking evasive action; however, on a few occasions the batsman was struck. In this event, the delivery had to be performed again so that the bowling accuracy could be analyzed. Deliveries were sequenced in a semirandomized order (Table 1), because in cricket match play, not every delivery is intended for the same trajectory or speed. The ratio of deliveries at each target and intensity also varied, to better replicate real-world bowling. Deliveries were bowled every 40 seconds. Delivery rating of perceived exertion (percentage from 1 to 100) of each ball was collected from the bowler while he walked back to the start of the run-up. Participants were asked, “How hard was that delivery out of 100%?” This rating system was adopted instead of the traditional scale for rating of perceived exertion (0–10)9 because, in pilot testing, participants understood and related better to the percentage method when bowling. Ball-release speed of each delivery was measured by a radar gun (Stalker Pro, Applied Concepts, Richardson, TX) mounted on a tripod and positioned 1.37 m behind the popping crease, with a
Figure 1 — Target-sheet design. Note: Not drawn perfectly to scale.
IJSPP Vol. 13, No. 2, 2018
Reliability of Pace-Bowling Measures
Table 1
153
Delivery Sequence in the Pace-Bowling Test
Ball
Overs 1 and 5
Overs 2 and 6
Overs 3 and 7
Overs 4 and 8
1 2 3 4 5 6
Off, RH, MI Off, RH, MI Off, RH, MI Off, RH, MI Off, RH, ME Mid, RH, SB
Off, LH, MI Off, LH, MI Off, RH, MI Off, RH, MI Bou, RH, MI Yor, RH, MI
Off, LH, MI Off, LH, MI Off, LH, MI Off, LH. MI Off, LH, ME Mid, LH, SB
Off, RH, MI Off, RH, MI Off, LH, MI Off, LH, MI Bou, LH, MI Yor, LH, MI
Downloaded by Ebsco Publishing on 03/07/18, Volume ${article.issue.volume}, Article Number ${article.issue.issue}
Abbreviations: Bou, target near batter’s head; LH, left-handed batter; ME, maximal-effort delivery; MI, match-intensity delivery; Mid, top of middle stump target; Off, outside off stump target; RH, right-handed batter; SB, slower ball delivery; Yor, target near base of middle stump.
0.3-m lateral shift from the line of middle stump, to avoid contact with the bowler in the run-up. The radar gun was fixed at a height of 1.95 m and an angle of 25° to capture point of release. Cosine effect error in ball-release speed was corrected for in a purpose-made spreadsheet by dividing measured speed by 0.906 (ie, cosine of 25°). From this datum, 3 values were calculated: peak ball-release speed, the mean of all 4 maximal-effort deliveries; mean ballrelease speed, comprising 40 match-intensity deliveries only; and variability of ball-release speed, the standard deviation of 40 match-intensity deliveries only. Maximal-effort and slower ball deliveries were omitted from calculations of mean ball-release speed and variability of ball-release speed. Bowling accuracy data were captured by the high-speed camera, which was mounted on a tripod and positioned 0.36 m from the popping crease, with a 0.3-m lateral shift from the line of middle stump, to avoid contact with the bowler in the run-up. The high-speed camera was fixed at a height of 1.47 m and an angle of 10° to capture the entire target sheet. Recorded video footage was imported into Dartfish Connect (Version 7.0, Dartfish, Melbourne, Australia) for analysis. The measurement function was calibrated in Dartfish Connect by drawing a vertical line from the center of the bouncer target to the top of middle stump target, which were exactly 1.0 m apart. The radial error, along with x and y coordinates, was calculated for each delivery.3 From these data, 2 values were calculated: mean radial error from 40 match-intensity deliveries only (representing bowling accuracy) and bivariate variable error3 from 32 match-intensity deliveries pooled from both offstump targets (representing the consistency of bowling accuracy). Maximal-effort and slower ball deliveries were excluded from the mean radial error calculation. Preliminary within-participant correlational analysis revealed a significant relationship between ball-release speed and radial error in 5 participants. Such withinparticipant variability would likely increase the standard error of measurement for both accuracy variables. The yorker and bouncer deliveries were further omitted from the bivariate variable error calculation due to the low sample of balls at each target. A low sample of deliveries can cause a large fluctuation in the bivariate variable error, subsequently increasing the standard error of measurement.
Statistical Analysis The normality of each variable was assessed using a Shapiro-Wilk test in IBM SPSS Statistics (Version 24.0, IBM Corp, Armonk, NY). All variables met the normal distribution. Each variable was entered into a purpose-made Microsoft Excel spreadsheet,10 where the standard error of measurement, exponentially transformed coefficient of variation (CV) with 90% confidence intervals, and intraclass correlation coefficient (ICC2,k)11 were calculated as
measures of reliability. An ICC greater than .8 and a CV less than 10% were considered to exhibit acceptable reliability in this study.12,13 The smallest worthwhile change represented the sensitivity of each measure and was calculated by multiplying the standard error of measurement by 1.5.6 A paired-samples t test (2-tailed) was conducted to detect systematic bias for each variable.14 The relationship between ball-release speed and radial error for each participant was calculated with a Pearson correlation coefficient (2-tailed), with all deliveries pooled from both bowling tests. The strengths of correlations were classified using modified thresholds/descriptors as follows: trivial (r < .10), small (r = .10–.29), moderate (r = .30–.49), large (r = .50–.69), very large (r = .70–.90), and nearly perfect (r > .90).15 Significance was set at P < .05 for all analyses.
Results There were no statistically significant differences in performance variables between tests (P > .05, Table 2). The ICCs of peak and mean ball-release speed were high (.981 and .988, respectively, Table 2). All other performance measures presented with ICCs below .8 (Table 2). The CVs of peak ball-release speed, mean ballrelease speed, and mean delivery rating of perceived exertion were low (1.0%, 1.0%, and 3.9%, respectively), while the variability of ball-release speed, mean radial error, and bivariate variable error exhibited high CVs (10.6%, 12.5%, and 15.3%, respectively, Table 2). Peak and mean ball-release speed exhibited high sensitivity, each with a smallest worthwhile change of 0.5 m/s (1.8 km/h). Low sensitivity in mean radial error and bivariate variable error was observed with smallest worthwhile changes of 6.9 cm and 8.4 cm, respectively (Table 2). The pace bowlers in this investigation released the ball at peak speeds of 33.0 ± 2.2 m/s (118.9 ± 7.8 km/h) and 33.1 ± 2.3 m/s (119.3 ± 8.3 km/h) in the 2 trials (Table 2). The variability of ballrelease speed was 1.6 ± 0.3 m/s (5.8 ± 1.1 km/h, Table 2). There was a 2-cm (4.6%) difference in mean radial error between trials (P =.303, Table 2). A 4-cm (10.0%) change in bivariate variable error was evident between tests (P = .100, Table 2). Five participants exhibited a significant relationship between ball-release speed and radial error (P < .05, Table 3).
Discussion This study evaluated the reliability and sensitivity of performance measures in a novel pace-bowling test. Take note that no learning or fatigue effects were evident between tests for any variable (P > .05). Peak and mean bowling speed were the most reliable measures in this study, with ICCs above .9 and CVs at 1.0%.
IJSPP Vol. 13, No. 2, 2018
154
Feros, Young, and O’Brien
Table 2
Reliability and Sensitivity of Pace-Bowling Performance Measures
Downloaded by Ebsco Publishing on 03/07/18, Volume ${article.issue.volume}, Article Number ${article.issue.issue}
Peak ball-release speed (m/s) Mean ball-release speed (m/s) Variability of ball-release speed (m/s) Mean radial error (cm) Bivariate variable error (cm) Mean delivery rating of perceived exertion (% of 100)
T1, mean ± SD
T2, mean ± SD
Change, %
P
ICC
SEM
CV, %a
SWC
33.0 ± 2.2 30.9 ± 2.3 1.6 ± 0.3 43.3 ± 7.5 40.0 ± 7.3 86.1 ± 5.2
33.1 ± 2.3 30.9 ± 2.4 1.6 ± 0.3 41.3 ± 8.1 36.0 ± 7.3 86.7 ± 5.2
0.4 0.0 0.0 −4.6 −10.0 0.7
.391 .948 .700 .303 .100 .629
.981 .988 .769 .685 .434 .650
0.3 0.3 0.2 4.6 5.6 3.2
1.0 (0.8–1.6) 1.0 (0.7–1.5) 10.6 (7.9–16.6) 12.5 (9.3–19.6) 15.3 (11.3–24.0) 3.9 (2.9–6.0)
0.5 0.5 0.3 6.9 8.4 4.8
Abbreviations: CV, coefficient of variation; ICC, intraclass correlation coefficient; SEM, standard error of measurement; SWC, smallest worthwhile change; T1, test 1; T2, test 2. a Upper and lower confidence intervals were set at 90%, expressed in parentheses.
Both variables demonstrated high sensitivity with a smallest worthwhile change of 0.5 m/s (Table 2), similar to a recent study of 0.6 m/s.16 Petersen et al5 arbitrarily set the smallest worthwhile change for mean ball-release speed to be either 1.4 m/s or 0.7 m/s for their training intervention. For a smallest worthwhile change of 0.7 m/s, the odds that the change in mean ball-release speed from their training intervention was beneficial, trivial, or harmful to performance were 59/41/