... 15(7), 38-52. Retrieved from http://ijlter.org/index.php/ijlter/article/view/694/pdf ... programming to prevent drop-out. Typically a ...... obtain a better certificate.
Fichten, C., Amsel, R., Jorgensen, M., Nguyen, M. N., Budd, J., Havel, A., King, L., Jorgensen, S., & Asuncion, J. (2016).Theory of Planned Behavior: Sensitivity and specificity in predicting graduation and dropout among college and university students? International Journal of Learning, Teaching and Educational
38
Research, 15(7), 38-52. Retrieved from http://ijlter.org/index.php/ijlter/article/view/694/pdf
International Journal of Learning, Teaching and Educational Research Vol. 15, No. 7, pp. 38-52, June 2016
Theory of Planned Behavior: Sensitivity and Specificity in Predicting Graduation and DropOut among College and University Students Catherine S. Fichten,1234 Rhonda Amsel,3 Mary Jorgensen,2 Mai N. Nguyen,2 Jillian Budd,2 Alice Havel,12 Laura King,5 Shirley Jorgensen,1 & Jennison Asuncion2 1Dawson College, 2Adaptech Research Network, 3McGill University, 4Jewish General Hospital, 5Cégep André-Laurendeau Montreal, Canada Abstract. We examined sensitivity and specificity when using the three theory of planned behavior (TPB) scales (Perceived Behavioral Control, Subjective Norms, Attitude) to predict graduation and drop-out in a longitudinal study of 252 college and university students with disabilities and in a separate cross-sectional study of a random sample of 1380 junior/community college students. The results (a) show the utility of the TPB in predicting graduation, (b) underscore that when predicting outcome, graduation and drop-out are not polar opposites, and (c) highlight the need to consider sensitivity and specificity separately. We discuss the implications of using different scale cutoffs depending on the goal of testing as well as uses of the TPB scales in research and practice. Keywords: theory of planned behavior, sensitivity, specificity, graduation, college, university, prediction, longitudinal cross-sectional
Introduction. Academic persistence and graduation are important to students (better jobs), colleges and universities (funding issues), parents (who often pay the fees), as well as society at large (better educated work force). Postsecondary institutions are highly invested in improving retention and graduation rates (Selingo, 2015). Yet, postsecondary graduation rates are typically below 55% (ACT, 2006; Jorgensen et al., 2005; Shapiro, Dundar, Yuan, Harrell, & Wakhungu, 2014). Prediction of graduation and drop-out has a relatively poor track record (e.g., Jorgensen, Ferraro, Fichten, & Havel, 2009). Models are especially poor at predicting drop-out. This is the case even if many variables such as grades, gender, and survey results are included (Jorgensen, Fichten, & Havel, 2008). What is needed to identify students at risk is a brief paper and pencil measure that correctly identifies both those likely to graduate and those likely to drop out.
© 2016 The authors and IJLTER.ORG. All rights reserved.
39
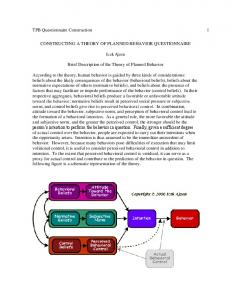
We recently developed a questionnaire based on Ajzen’s (2002, 2012) Theory Of Planned Behavior (TPB) and tested it in a sample of 845 college students (Fichten et al., 2016) and 611 college and university students with various disabilities (Fichten, et al., 2014). The TPB suggests that behavior is influenced by Intention to carry out the behavior. Intention is predicted by: Perceived Behavioral Control (i.e., how easy or difficult it is to enact the behavior - in this case graduation), Subjective Norms (i.e., perceived views of individuals important in the student’s life), and Attitude (i.e., favorable or unfavorable evaluation of graduation). Ajzen’s ( n.d.) model in Figure 1 illustrates the TPB. The model has been shown to be highly effective and influential in numerous areas, including postsecondary contexts (Kovac, Cameron, & Høigaard, 2014; Kyle, White, Hyde, & Occhipinti, 2014; Prentice, Caska, & McLaughlin 2009; Schuchart, 2013; Thomas, 2014). Indeed, our studies of intention to graduate among postsecondary students with and without disabilities show that the TPB model predicted 44% of the variability in intention to graduate among college students in general (Fichten, et al., 2016), and 25% of the variability among students with disabilities (Fichten, et al., 2014).
Figure 1. Theory Of Planned Behavior Sensitivity, Specificity, True and False Positives and Negatives. It is not possible to examine actual graduation and drop-out rates while students are enrolled – only the intention to do so. Yet, it is during this period that it is most important for institutions to identify individuals at risk for drop-out as this is when colleges and universities can implement remedial or other forms of programming to prevent drop-out. Typically a single score obtained from a logistic or multiple regression is used when using composite scores or a questionnaire to predict intention to graduate - including in our own studies (Fichten, et al, 2014, 2016). Most of the time researchers are pleased when over 25% of the variability in intention to graduate scores is predicted. The problem with this approach, however, is that it takes into account both students who definitely intend to graduate as well those who
© 2016 The authors and IJLTER.ORG. All rights reserved.
40
are thinking of dropping out. What if the measure predicts one better than the other? In an example from medicine (cf. MedicineNet.Com, n.d.), if a test designed to detect cancer returns a positive result, but the person does not actually have cancer (“false positive”), this would be very undesirable. Similarly, it is also undesirable for a test to return a negative result when the person actually does have cancer (“false negative”). Ideally, a test has to be accurate in predicting both true positives and negatives (i.e., correct predictions) while avoiding false positives and negatives. The typical way to express this is through “sensitivity” and “specificity” of a score (see Table 1 for definitions). Such concepts are frequently utilized in medicine (e.g. Baldessarini, Finklestein, & Arana, 1983), but rarely in social psychology or education. A notable exception is a study by Jorgensen et al. (2008), which used predictors based on individual and institutional factors; the results showed that the variables did a relatively good job of predicting graduation but a poor job of predicting drop-out. This illustrates the notion that in this context, graduation and drop-out are not simply two poles of a continuum. An illustrative example. The example in Table 1 illustrates this dilemma. Here, a hypothetical sample of 1000 students complete a questionnaire intended to predict whether they will graduate or not. Four years later 50% of the students have graduated and 50% have dropped out. Thus it is possible to determine actual graduation and drop-out . Table 1. Hypothetical Example of 1000 College Students Where 500 Actually Graduated and 500 Actually Dropped Out
Predicted
Will Graduate Will Drop Out Marginal Sum
Graduated a =450 b = 50 500
Actual Dropped Out c =400 d = 100 500
Marginal Sum 850 150 1000
Actual Dropped Out c = False Positive d = True Negative c+d
Marginal Sum a+c b+d a+b+c+d
Note. Sensitivity = 90%, Specificity = 20%
Predicted
Will Graduate Will Drop Out Marginal Sum
Graduated a = True Positive b = False Negative a+b
Sensitivity = a/(a+b), True Positive/All Actual Graduates; Specificity = d/(c+d) True Negative/All Actual Drop-outs
False positive: A result that indicates that a condition is present when it is not (e.g., if a test designed to detect cancer returns a positive result but the person does not have cancer). False negative: A result that appears negative when it should not (e.g., if a test designed to detect cancer returns a negative result but the person actually does have cancer).
© 2016 The authors and IJLTER.ORG. All rights reserved.
41
Table 1 shows that our hypothetical questionnaire correctly classified 550 of the 1000 students (i.e., 55% overall correct classification): 450 of the 500 those who actually graduated graduates (true positive) and 100 of the 500 students who actually dropped out (true negative). But what about those who were misclassified, including the 50 graduates who were misclassified as drop-outs (false negative) and the 400 students who dropped out but were classified as likely to graduate (false positive)? Although the overall accuracy of the prediction is 55%, the sensitivity of the measure (i.e., percentage of the 500 actual graduates who were predicted to graduate (n = 450)) in the hypothetical example is 90%. Not bad for predicting who will graduate! But what about the drop-outs? Specificity (proportion of 500 students who actually dropped out who are predicted to drop out (n = 100)) is only = 20%. Thus, the questionnaire did an excellent job of predicting which students will graduate, but a very poor job of predicting who will drop out. Circumstances determine whether it is the sensitivity or the specificity of a test that is more important, or if they are equally important. To predict the number of students who will persist into the next semester, sensitivity is more important. If an institution wishes to spend scarce resources on preventing drop-out, however, then specificity is more important. Present Investigation. This paper reports two studies. Study 1 evaluated, in a longitudinal investigation, how well the three TPB components (Attitude, Subjective Norms, Perceived Behavioral Control) predicted behavior (i.e., graduation and drop-out) 3-4 years later in the sample of postsecondary students with disabilities whom we studied in 2010 (Fichten et al., 2014). We also explore the relationship between intention to graduate and behavior (i.e., actual graduation and drop-out) 3-4 years later in the Study 1 sample. This relationship is important because intention to graduate is a measure often used as a proxy for actual persistence or graduation while students are still enrolled (DaDeppo, 2009; Thomas, 2014). We hypothesize (1) that there will be a strong relationship between intention to graduate and actual graduation and drop-out 3-4 years later, and (2) that the three TPB components will do well predicting behavior (graduation and drop-out) 3-4 years later. We also explore whether sensitivity or specificity would be greater. In Study 2, we conducted a secondary analysis of data from our study of currently enrolled college students (Fichten et al., 2016). Here we explored sensitivity and specificity by dividing students into two groups based on the entire sample’s mean intention to graduate score. The two groups were those who had a strong or a weak intention to graduate. Method Theory of Planned Behavior Questionnaire. A one page measure with 4 subscales was adapted from Davis, Ajzen, Saunders, and Williams (2002) (available in Fichten et al., 2016). Six-point Likert scaling (Strongly Disagree to Strongly Agree) is used to evaluate intention to graduate (e.g., All things
© 2016 The authors and IJLTER.ORG. All rights reserved.
42
considered, it is possible that I might not complete my program of study), perceived behavioral control over graduation (e.g., I can overcome any obstacles or problems that could prevent me from completing my program of study if I want to), and subjective norms related to graduation (e.g., Most people who are important to me expect me to complete my program of study). Attitude toward graduation is rated on 6-point Likert-type scales (e.g., very undesirable to very desirable ). Scoring is the average value of each scale. Attitude, subjective norms and perceived behavioral control scale means can be added together for a Total TPB score. Fichten et al. (2014) reported acceptable psychometric properties for the measure: Cronbach’s alphas ranged from .71 to .83 and test-retest reliability ranged from .62 to .74. Preliminary concurrent validation data were acceptable. Higher scores indicate more positive views about graduation. Study 1. Participants Participants consisted of 252 Canadians with disabilities who had been enrolled in a diploma or degree program in the spring 2010 semester and who, by the end of 2013, had either graduated from this program (193 graduates: 126 females, 67 males) or dropped out (59 premature leavers: 38 females, 20 males, 1 did not indicate). 175 individuals had attended a university and 77 a junior/community college. Participants had been enrolled in 75 different Canadian postsecondary institutions and were, on average 32 years old at follow-up. Most participants had been pursuing a bachelor’s degree (n = 120). There was no significant difference between groups on full-time (n = 204) versus part-time (n = 46) status, or on the number of disabilities/impairments reported in 2010. Both groups were most likely to have attention deficit hyperactivity disorder, or a learning disability, or a mental health related disability. The only significant difference between graduates and premature leavers was on mental health related disability, with a larger proportion of premature leavers reporting this, X2(1,252) = 6.99, p = .014, φ=.44. Study 1: Procedure In a protocol approved by the Dawson College Research Ethics Board in the fall 2013 term we followed up on a sample of 611 Canadian students with disabilities who had been enrolled in degree or diploma programs in the spring 2010 semester and on whom we reported in a previous paper (Fichten et al., 2014). We tried contacting students through the email or postal mail they provided in 2010. Two-hundred and fifty individuals could not be reached. Of the 361 individuals whose mail did not bounce back, 284 responded (return rate = 79%). Thirty-two of them were still enrolled in the same program as in 2010; they are not of interest here. Only the 193 graduates and 59 premature leavers are involved in the present investigation. Mean duration of the follow-up was 3.75 years. Participants were asked: “Did you graduate with a (name of the participant’s diploma/degree program in 2010) at (name of the participant’s school in 2010)?”
© 2016 The authors and IJLTER.ORG. All rights reserved.
43
Study 1: Results Comparing the 2010 scores of graduates and premature leavers. Results show that while participants were still students, there were significant differences (p < .001) between graduates and premature leavers on all TPB scales, with graduates having more favorable scores; Cohen’s d scores range from .38 to .93. Predicting graduation and drop-out. To evaluate the utility of the TPB model we carried out a series of discriminant analyses to predict, based on the 3 TPB predictors (i.e., Attitude, Subjective Norms, Perceived Behavioral Control) completed almost 4 years earlier, which individuals actually graduated or dropped-out. Table 2 shows that, overall, 74% of the sample was correctly classified. The canonical correlation was .54, p