That is, given a program and set of training inputs, the framework will generate several analytical models that accurately predict online program behaviors such as memory utilization ...... Lecture Notes in Computer Science, pages 840â849,.
ThreadMarks: A Framework for Input-Aware Prediction of Parallel Application Behavior Haicheng Wu, Kirak Hong, and Nathan Clark Georgia Institute of Technology Atlanta, GA, USA {hwu36, hokira, nate.clark}@gatech.edu
Abstract Chip-multiprocessors (CMPs) are quickly becoming entrenched as the main-stream architectural platform in computer systems. One of the critical challenges facing CMPs is designing applications to effectively leverage the computational resources they provide. Modifying applications to effectively run on CMPs requires understanding the bottlenecks in applications, which necessitates a detailed understanding of architectural features. Unfortunately, identifying bottlenecks is complex and often requires enumerating a wide range of behaviors. To assist in identifying bottlenecks, this paper presents a framework for developing analytical models based on dynamic program behaviors. That is, given a program and set of training inputs, the framework will generate several analytical models that accurately predict online program behaviors such as memory utilization and synchronization overhead, while taking program input into consideration. These models can prove invaluable for online optimization systems and input-specific analysis of program behavior. We demonstrate that this framework is practical and accurate on a wide range of synthetic and real-world parallel applications over various workloads.
1
Introduction
Many situations require accurate analytical models for understanding the behavior of applications. For example, tuning applications to best make use of the architecture can greatly benefit from analytical models that predict an application’s bottleneck and report it back to the developer. Likewise, compilers must incorporate accurate analytical models to effectively applying optimizations, lest they hurt performance. These models are critical for engineering high-efficiency systems, and they are becoming even more important in the age of ubiquitous parallelism. Often times modern programming tools require the developer or compiler (or both), to have a deep understanding of the execution hardware in order to correctly avoid system bottlenecks. For example, developing CUDA [28] applications for NVidia graphics processors requires programmers have a very good understanding of the memory system [17]. As another example, Nieplocha et al. note that some applications can saturate shared resources in the Sun Niagara processor with as few as eight threads, even though the hardware has
1
support for 32 threads [27]. Without ways to quickly and accurately model when an application fully utilizes these shared resources, developers are unlikely to create effective applications. Good analytical models can quickly identify problematic situations, and assist the programmer, compiler, or runtime in making the right modifications. Due to their importance, several techniques have been developed to construct accurate analytical models for a given architecture. For example, there has been a significant amount of work on leveraging machine learning to automatically construct analytical models using static program properties such as instruction count and the trip count of loops [8, 11, 20, 32, 33, 34, 35]. These techniques are effective, however, they often ignore inputs and runtime behavior which can be used to make better online estimates. Other work has demonstrated that program inputs can be used to augment static program properties, leading to better overall performance prediction [18], however it has not been shown how to extend these results to other important domains, such as predicting resource contention. The purpose of this paper is to present such a solution. We demonstrate a repeatable process for constructing analytical models for online prediction of bottlenecks and resource contention in parallel environments. The challenge is, given an application, how to develop a statistically accurate model based on limited training information. To tackle this challenge, the proposed system takes a series of inputs and collects many different data on the program behavior, from the value of each input value, to how many cycles each thread takes, to the values of several hardware performance counters. These data are then used to construct many thousands of statistical models, which are tested to find the most accurate model for the target application. These models can then be used to better optimize the application online, e.g., though better thread scheduling. This paper demonstrates the efficacy of the proposed system in generating models that accurately predict benchmark behavior across input sets. On average 81% of dynamic behaviors in different benchmark applications are successfully modeled and predicted with geometric mean accuracy of 90.4%.
2
Motivation and Design of ThreadMarks
Accurate prediction of program behaviors is the basis of many program optimizations. For example, loop unrolling optimizations need to measure possible parallelism improvements and potential register pressure issues to effectively balance these tradeoffs. Other examples of optimizations that often need behavior predictions include dynamic resource allocation, thread scheduling and partitioning, etc [1, 2, 6, 9, 21]. These optimizations require accurate behavior predictions, typically based on application profiling. There are two common ways to collect profile information: online profiling and offline profiling. Online profiling keeps track of the program behavior at runtime [12, 30], e.g., dynamic hot-path detection used in most modern JITs. Most dynamic optimizers exploit online profile information since it provides input-specific program behavior, and
2
does not require any developer intervention for setting up training inputs. The downside is that profiling overhead can be a problem with this approach because the overhead of collecting statistics hurts both program performance and prediction accuracy [12]1 . On the other hand, offline profiling determines static properties of a program using training inputs before runtime execution. This technique has little runtime overhead, but provides only a summary of the static properties of a program. Thus the optimizations cannot be based on input-specific behaviors. This means that optimizations utilizing static predictions, while capable of dynamically adjusting to system and machine state, will still be necessarily less accurate than optimizations using dynamic profiling. Recently, Jiang et al. proposed a novel approach to utilize offline profiling to construct a model for dynamic behavior prediction with very low overhead [18]. That is, they discovered strong correlations between program inputs and certain dynamic behaviors such as loop trip counts. Leveraging this correlation enables the accurate prediction of input-specific behaviors without the overhead of instrumenting, for example, every basic block or every memory instruction. The idea of using program specific correlations to model program behaviors may not be limited to the application behaviors presented in Jiang’s paper. The thesis of this work is that it is possible to leverage program variable correlations to detect many other types of application behavior beyond loop trip count. This paper demonstrates that other program behaviors, such as working set size and the amount of time a thread spends waiting in synchronization code can also be predicted accurately with low overhead. The ThreadMarks framework is a tool for constructing low overhead models to dynamically determine these program properties for use in online optimizations. Input-aware offline profiling for thread level behavior prediction is advantageous over traditional online and offline approaches in many ways. First it is light-weight approach in terms of profiling and prediction. It has negligible runtime overhead compared to online profiling since predictions are made by simple calculations at runtime. This not only simplifies dynamic optimizations but also preserves the original program execution without profiling overhead. Moreover, it allows a prediction can be made as early as the corresponding model and parameters are available, even before executing a prediction target. Last but most importantly, it provides high predictive power since it exploits program inputs that commonly dictate how program works. Essential set of variables consisting of the program inputs that affect on a specific behavior will provide a noise-free model and therefore highly accurate. However, there are number of reasons that it is still challenging to exploit program-specific correlations for dynamic thread optimizations. First of all, the behaviors ThreadMarks is trying to predict, such as synchronization time, have much more complicated relations to program inputs than were needed in previous work. For example, cache 1 Online
hot-path profiling is usually not a major burden, but profiling other program behaviors, such as working set size, can cause significant
overhead.
3
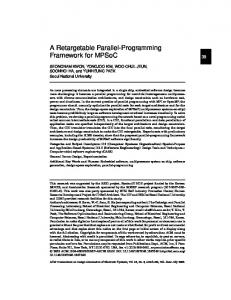
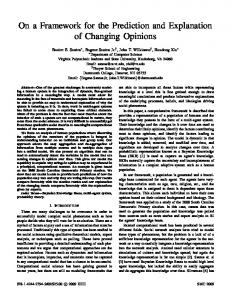
misses can have different trends with certain ranges of inputs if the inputs are related thread working set size. If working set size exceeds a capacity of hardware cache, cache miss will rapidly increase. This is not a simple linear relationship that is easy to detect. Furthermore, threads running concurrently interact with each other, which complicates building a predictive model. For instance, Figure 1 shows the average execution time for worker threads in the Swaption benchmark from PARSEC [4] across several different inputs. Each point on the X-axis corresponds to a pair of command line parameters which determine how the work is divided amongst threads: the first variable increases first followed by the second, e.g., [1,1], [2,1], [3,1], [1,2], [2,2], ..., creating a cyclic behavior in the graph. The four different lines in this figure represent a different number of worker threads used. The important point to take from this figure is that there is clearly correlation between thread execution time and these input variables, however the number of threads and their interactions must also be considered in a predictive model. A last challenge in constructing these models is that dynamic behaviors are hard to predict because they are often combinations of several different behaviors. Figure 2 (A)-(D) shows the instruction count for 4 different phases of a worker thread in Streamcluster when varying the input parameters. Figure 2 (E) shows the trend for entire thread (essentially the summation of (A) - (D)). Since the threads perform very different tasks in each phase, the combination of their trends is complex while the individual trends are fairly simple to predict. In such case, the predictions of individual phases are more accurate than the prediction of entire thread. Note that this can also help isolate noisy trend from others. In the figure, (D) will cause low prediction accuracy but it doesn’t affect others if predictions are made for individual phases. Previous work discovered the strong correlations between program inputs and loop counts [18]. This work extends the previous work by considering different types of behaviors, including hardware and software behaviors in multiphased and multi-threaded programs.
2.1
Design Overview
The discussion in the previous section motivates the design of a framework that automatically builds prediction models based on program-specific correlations between program inputs and runtime behaviors. Figure 3 shows the overview of the proposed ThreadMarks framework design to accomplish this. Offline, ThreadMarks performs profiling in order to record program inputs and resulting behaviors. First ThreadMarks finds different phases within a program, which serve units of profiling and prediction. The granularity of phases can change if modeling results are not satisfying. Finer-grained phases typically provide more accurate models since coarse-grained phases can consist of multiple trends lumped together. Once the different phases are detected, ThreadMarks profiles the application to record variable values and interesting behaviors to be predicted (e.g., instruction 4
7.E+06 6.E+06 5.E+06
Execu2on Time(ms)
th2 4.E+06
th4
3.E+06
th8
2.E+06
th16
1.E+06 0.E+00 1
21
41
61
81
101
Input Sequence Number
7.20E+02
2.50E+07
7.00E+02
2.00E+07
Inst Count
Inst Count
Figure 1: Swaptions execution time with different number of threads and varying input parameters
6.80E+02 6.60E+02 6.40E+02
1.50E+07 1.00E+07 5.00E+06 0.00E+00
6.20E+02 1
6
16 26 36 46 56 66 76 86 96 106 116 11 21 31 41 51 61 71 81 91 101 111
1
6
Input Seq Num
Input Seq Num
(B)
1.60E+05
2.00E+05
1.20E+05
1.60E+05
Inst Count
Inst Count
(A)
8.00E+04 4.00E+04 0.00E+00 1
6
16 26 36 46 56 66 76 86 96 106 116 11 21 31 41 51 61 71 81 91 101 111
1.20E+05 8.00E+04 4.00E+04 0.00E+00
16 26 36 46 56 66 76 86 96 106 116 11 21 31 41 51 61 71 81 91 101 111
1
Input Seq Num
6
16 26 36 46 56 66 76 86 96 106 116 11 21 31 41 51 61 71 81 91 101 111
Input Seq Num
(C)
(D)
Inst Count
2.00E+10 1.50E+10 1.00E+10 5.00E+09 0.00E+00 1
3
5
7
9
11 15 19 23 27 31 35 39 43 47 51 55 59 63 67 71 75 79 83 87 91 95 99 103 107 111 115 13 17 21 25 29 33 37 41 45 49 53 57 61 65 69 73 77 81 85 89 93 97 101 105 109 113 117
Input Seq Num
(E)
Figure 2: Instruction counts for different code blocks in Streamcluster count) within each phase. The model parameters include program inputs directly obtained from files or command line arguments, and derived parameters such as number of threads created and variables that affect program behavior. After profiling, ThreadMarks builds regression models based on the profiled data. Program inputs and derived variables, such as number of threads created, are used as independent variables while dynamic behaviors are dependent variables in the regression modeling. ThreadMarks uses a model pool, which consists of many model prototypes.
5
Profiler Program Binary
Phase Informa6on
Phase Detec6on
Profiled Behaviors Profiling
Program Input Set
Input Variables Interested Behaviors
User Configura6on
Model Builder
Accuracy Requirements
Program Binary Profiled Behaviors Regression Modeling
Code Instrument
Inst. Count = Ax + By + C
Input Variables Predic6on Embedded Code
Model Pool
Dynamic Compiler Program Input
Program Execu6on Main()
Phase 0 Predic6ons
Work() Work()
Phase 1 Predic6ons
Figure 3: ThreadMarks system overview ThreadMarks finds the most appropriate model for each behavior by combining each model prototype from the model pool with independent variables to see what the best correlation is for the target application/behavior. The model pool contains many different prototypes including commonly used statistical relations included prior knowledge. For example, one may add y =
1 n x where n is the number of thread and x is a combination of other input variables,
while y
describes the observed dynamic behavior. This model prototype helps to find best fitting model for dynamic behaviors that are divided by the number of threads, such as instruction counts or working set size in data-parallel applications. Once the best model is found, ThreadMarks evaluates the model in terms of accuracy. If the accuracy of the model is not satisfying, ThreadMarks would go back to the profile stage using a finer grained phase. If fine-grained phases show simple trends, the accuracy can be improved. If a desired accuracy is met, ThreadMarks injects a prediction code into the beginning of the phase, allowing dynamic behavior prediction at runtime. The prediction code will calculate a prediction of dynamic behaviors using the appropriate program variables, as hard-coded by ThreadMarks.
6
At runtime, predictions of dynamic behaviors are provided to a dynamic optimizer. Note that the dynamic optimizer should register its hook-up function into ThreadMarks framework so the function will be called at each prediction time. As a result, the dynamic optimizer will receive predictions of dynamic behaviors of each phase before executing the phase, enabling early optimizing opportunities. At this end, the design of ThreadMarks provides following advantages over traditional predictions based on online and offline profiling: • ThreadMarks reaches the benefit of both offline profiling and online profiling. The approach enables fast and accurate cross-input predictions of dynamic behaviors at runtime. • The process is completely automated. It can find the most appropriate model for different phases and dynamic behaviors without any human intervention. • ThreadMarks requires no external support and work on legacy applications, provided by is cognizant of the semantics of the threading/synchronization mechanisms (e.g., pthreads or MPI) used in the application.
3
Profiling
The goal of ThreadMarks is to leverage program-specific correlations between program inputs and dynamic behaviors in order to construct statistically accurate and fast analytical models. To construct accurate models, it is important to record relevant variables that affect dynamic behaviors for modeling. The first step in ThreadMarks is to profile a program with different inputs. When profiling an application, ThreadMarks records independent variables including program inputs and derived variables such as number of threads created, and dependent variables from dynamic behaviors as set by a user. The dynamic behaviors include hardware behaviors such as instruction counts and cache misses as well as software behaviors such as synchronization overheads. Following subsections will describe how ThreadMarks profiles independent variables and dynamic behaviors to achieve high accuracy in modeling.
3.1
Correlative Input Identification
ThreadMarks profiles model parameters in order to use them as independent variables in regression modeling. Since they are used to construct dynamic behavior models, the model variables should be a set of variables that affect dynamic behaviors that are useful to predict. Since program inputs usually have significant impacts on a program’s dynamic behaviors at runtime, ThreadMarks considers the inputs as independent variables. However, ThreadMarks profiles program variable values instead of directly recording the command line arguments or external file sizes and contents. This is because program inputs are eventually read into variables at runtime. Moreover, derived model 7
variables, such as the result of computation of program inputs, often have more direct impact on a program’s dynamic behavior. For example, if the product of two program inputs is the loop counter of a loop dominating program runtime, the product result will be more useful to model the program’s behavior than the individual inputs. On the one hand, every variable in a program can be potentially correlated to dynamic behaviors. However, it is too slow to monitor every variable in a program and use them for model construction. More importantly, too many variables introduce an over-fitting problem, i.e., the resulting model has low predictive power because it is geared to cover the training set too much without strong generalization guarantees. On the other hand, all the relevant variables should be captured in order to construct accurate models. In order to allow users to handle this trade-off, ThreadMarks uses several filters to identify the highly correlative program variables out of non-related ones. As the first filter, only program variables calculated before spawning working threads are considered. The basic assumption of this filter is that important program variables that affect whole program execution often reveal their value before the first working thread is created. For example, the number of work items for each thread is determined before the thread creation in many data-parallelism applications. In this case, the variables inside the threads have only a minor effect compared to those variables before the thread creation and therefore will be less significant in modeling. As a second filter, variables defined in basic blocks executed more than one percent of the execution time are pruned. The basic intuition of this filter is that some basic blocks are executed within a loop, which means they are performing intensive data processing, rather than computing values that affect dynamic behaviors, such as determining the number of work items. The third filter discards variables having constant values over all executions, as they do not have any predictive power in regression modeling. The fourth filter discards variables used in shared libraries. This is because program-specific correlations are presented within the program code, not in the shared libraries. Even if the result of shared library call will affect a program’s dynamic behavior, the result will be assigned to a variable within the program, which will be considered as a potential model variable. The above filters are supported by the current ThreadMarks implementation used in this work and performed well in this initial study. Empirically, they pruned out large number of irrelevant variables within a program, while preserving a good predictive power. The filters in ThreadMarks can be extended and users can always apply different combinations of filters for different programs. ThreadMarks records the variables detected by applying the filters and uses them for model construction and online prediction.
3.2
Dynamic Behavior Profile
ThreadMarks profiles a program many times in order to capture program inputs and different dynamic behaviors. It uses various profiling techniques for different dynamic behaviors depending on where and how they are recorded. For example, synchronization overheads between threads and working set size for each thread are measured by code 8
instrumentation, while hardware behaviors can be obtained from hardware performance counters. Also, specific locations in an application’s binary such as thread creation/joining sites are instrumented by ThreadMarks since they provide important information for modeling. In this work, ThreadMarks profiles following types of information: • Thread Creation/Joining Information: ThreadMarks collects the number of threads created and their work functions as well as thread joining information. Based on the information, ThreadMarks recognizes the types and number of threads running together at each point that ThreadMarks predict dynamic behaviors. Since many dynamic behaviors are related to the the number of same types of threads running concurrently, the information provides an important clue of the dynamic behaviors. ThreadMarks uses symbols in binary image such as pthread create() to acquire such information. • Working Set Size: Since working set size is interesting for many dynamic optimizations, ThreadMarks collect the working set size for each thread in a program. Store and load instructions and their target addresses are instrumented in order to calculate the working set sizes. • Thread Synchronization Overhead: Synchronization overhead is the cycles spend in the synchronization operations such as barriers and locks. ThreadMarks recognizes binary symbols for the different operations and wraps them with cycle measuring code in order to record the overhead for each operation. • Hardware Behaviors: For hardware behaviors, e.g., instruction count and cache misses, ThreadMarks exploits hardware performance counter to collect the profile data. Between two prediction points, a dynamic behavior is simply calculated by subtracting the initial value of the counter from the last value of the counter. Note that ThreadMarks is not limited to the behaviors mentioned above. For example, various software behaviors such as loop iteration counts or function call frequencies can be also measured by simple software counters and can be modeled using ThreadMarks. However, this paper will mainly investigate thread level behaviors such as synchronization and working set sizes, and hardware behaviors that are highly dynamic, but useful to many dynamic optimizers.
4
Model Construction
Now that ThreadMarks has all the data from profiling, it begins to build models describing the relations between dynamic behaviors and correlative program input. A complete model consists of three parts: a dependent variables, independent variables, and a function prototype. The dependent variables are the interested dynamic behaviors, such as instruction counts or cache misses. The independent variables come from the correlative program input. The function
9
prototypes describe the potential relations between these two kinds of variables. The task of model construction is to find an appropriate function prototype and associate independent variables to accurately predict every dependent variable. This process is performed iteratively using increasingly fine-grained phases until model accuracy meets a user-defined minimum.
4.1
Model Pool
The main challenge in the ThreadMarks modeling process is how to automatically find the correct model. First, not all the correlative program inputs are related with the specific dynamic behaviors. For example, some program inputs control the instruction counts but have nothing to do with the working set size. Second, the relationships between independent variables and dependent variables are diverse. Some relationships may be linear, but many are not. This is a problem for some prior approaches, as they only detect linear relations. A third challenge is that the independent variables of a function prototype may be the combination of several correlative program inputs. For example, for a four input (a, b, c, d) linear function, the most accurate model may be f = ab + cd. If the modeling process requires human intervention, i.e., a human expert has to observe the profiled behaviors and manually build models, it will be too user-intensive for broad applicability. ThreadMarks automates this process using the concept of a model pool. The model pool provides large number of possible relationships between variables. The model pool can be divided into two parts: an independent variable pool and a function pool. The first part of the model pool is an independent variable pool. It stores all independent variables that maybe used by the model. These variables include constant terms, linear terms, and cross product terms. Linear terms are the correlative input collected as described in Section 3.1 (I = {i1 , i2 , . . . iN }). Every profiling run will generate one instance of I. ThreadMarks considers cross product term (II = {i21 , i1 i2 , . . . i2N }), as well, because the cross product of two inputs may work together to control the behavior of the program. For example, if two inputs control the trip counters of two nested loops respectively, their product determines the total execution time of these loops. ThreadMarks also uses the vector
1 nI
and matrix
1 n II,
where n is the number of threads sharing the same work
functions and running at the same time. The inclusion of n is because data-parallel applications usually distribute their workload among several threads evenly. It is based on the prior knowledge and helps to build more accurate models. It is easy to expand the independent variable pool to include 3-order cross term at the expense of more processing time and more complicated models. The experiment shows that second-order cross term is enough for the tested benchmarks. The second part of the model pool is a function pool. Besides the normal linear function (Equation 1), it also has non-linear functions. One non-linear function is a log-log model (Equation 2).
10
ˆ Y = βX
(1)
log Y = βˆ log X
(2)
where X is a vector of independent variables selected from independent variable pool, and Y is the dependent variable. In addition, βˆ is a vector of regression coefficients estimated by least square [19]. There are several other functions considered in the current implementation, but since the independent variable pool considers the factor of cross term, the above two equations cover the majority of application behaviors in the target application set. One other non-linear model worth mentioning is a regression tree [5], a variant of decision trees. Regression trees can automatically neglect unimportant variables and provide a prediction when it is very difficult to use a single function to describe the trend. The size of the regression tree was limited to ten levels to prevent over-fitting and save computation time. Regression trees were found to be useful for predicting a small number of application behaviors in the target benchmarks. Depending on the characteristics of the application, users may add any other function prototypes into the pool. However, with the help of the independent variable pool, these three functions are enough for the benchmarks used in the experiment part. For every model, ThreadMarks would first pick one function prototype and then choose independent variables. ThreadMarks would try linear model first and then tries the log-log model. If neither of them works, it would use regression tree last. When selecting independent variables, ThreadMarks adopts the idea of forward stepwise feature selection [13]. Basically, ThreadMarks starts with constant term only, and then adds other independent variables in the order of linear term(I,
1 n I),
II and
1 n II.
Every time, ThreadMarks add one term into the model and retrain the
model. If the resulting accuracy matches the requirement, the model is selected. Otherwise, it adds next term into the model. If all the independent variables are tried, ThreadMarks would use another function prototype. Selecting function prototype and adding independent variables in this order is to make the model as simple as possible. Model pool cannot guarantee to find an accurate model every time. When all function prototype failed, ThreadMarks returns an error to the user. Figure 4 is a simple example showing how model pool works. Suppose Figure 4 (a) shows 10 data points collected from profiling, X and Y are independent variables, and the required accuracy for predicting Y is 99%. ThreadMarks ˆ is first uses data X only to find a line V ˆal1 = βˆ1 X to fit the observed value. The difference between V al and val 10.5%, which is worse than the requirement. Next, it adds Y into the model and considers V ˆal2 = βˆ1 X + βˆ2 Y . the error of V ˆal2 is still too large. Then, it includes the cross term XY and builds a model of V ˆal3 = βˆ1 X + βˆ2 Y + βˆ3 XY . Since the accuracy is larger than 99% this time, ThreadMarks uses this model and would not consider other non-linear function prototypes.
11
index 1 2 3 4 5 6 7 8 9 10
X 3 5 6 7 8 11 14 16 17 19
Y 22 28 29 30 32 33 34 35 38 40
Val 92 172 212 245 302 406 517 618 703 822
(a)
(b)
Figure 4: Example of building a predictive model: (a) profile data, and (b) the intermediate result after each step in model construction ThreadMarks’ model pool has three benefits: first it automates the behavior modeling process by giving a finite choice to build the models. Second, the construction of the pool leverages human expertise, which improves the prediction accuracy and the computation time of building models. Third, the model pool is easy to be expanded by inserting either new independent variables (e.g., the 3rd order terms) or new function prototypes.
4.2
Phase Detection
The models built by ThreadMarks may not always give desired prediction accuracies at runtime. This can happen when the actual behavior model is noisy, i.e., the dynamic behavior is inherently random, or the model built by ThreadMarks cannot cover the dynamic behavior well. In the latter case, however, it is possible to improve prediction accuracies using phase detection. Many programs show phased behaviors and the phases are useful for many dynamic optimizers as noted by previous research work [26]. For example, Fluidanimate benchmark consists of many different phases separated by barrier synchronizations. At each phase between the barrier synchronizations, the program performs a specific task. One phase has a hot loop where the loop count is derived by program input, while another has a code sequence that consumes constant CPU time and memory space. In this case, each phase provides simpler and more accurate dynamic behavior models compared to a whole thread. Whole-thread predictions can be made by combining the simple models of phases, providing higher accuracy. Since the phases are units of predictions in ThreadMarks, phase granularity used in modeling directly affects to the prediction accuracy and efficiency. If the unit is too small, there will be unnecessarily large number of phases and runtime prediction overhead will be increased. More importantly, the predictions are less useful since the predictions are only valid within the short phases. On the other hand, phases that are too large are more likely to demonstrate
12
Phase 1 pthread_create() Phase 1 pthread_barrier_wait() Phase 2
Phase 2 pthread_barrier_wait()
Phase 3
pthread_join() Phase 3
(a)
(b)
Figure 5: Phase detection using different granularities difficult to model behavior making the prediction less accurate. The current implementation of ThreadMarks uses two different granularities for phase detection: a whole thread lifetime and barrier synchronization as shown in Figure 5. The thread lifetime is the coarsest granularity of prediction in the present implementation, since that is the unit of optimization we plan to ultimately target. As opposed to doing full-fledged phase detection, the current implementation simply uses barrier synchronizations to delimit phases as depicted in Figure 5(b). This was effective for the target applications, however, more rigorous phase-detection techniques are easily substituted, and certainly necessary for some applications. Again, ThreadMarks tries to fit a model to the coarsest granularity of phases first, and then iteratively makes them smaller until the user-defined accuracy requirement is met. Once a model is discovered, ThreadMarks will use the model for prediction by injecting corresponding prediction code into the application’s binary. Predictions can be queried from the model as soon as all the correlative independent variables are calculated. In this way, ThreadMarks’ prediction adapts to the program inputs to create accurate and low-overhead predictions..
5
Experimental Evaluation
ThreadMarks was evaluated by measuring prediction accuracies of different dynamic behaviors in 6 benchmarks from the PARSEC 2.1 benchmark suite [4]. For each benchmark, 20 to 120 program inputs are used for model construction and cross validation, and the ratio of test and training set is 1/4. To reiterate, training inputs were not used to generate results. In order to provide enough independent variables for modeling, program inputs are generated by varying input parameters. For example, Swaptions takes two positive integers and six input sets are given by default. We generated
13
Percentage for number of models at each accuracy level
100% 90% 80% 70% 60% 50% 40% 30% 20% 10% 0%
< 0.7 > 0.7 > 0.8 > 0.9
inst ld st inst br br L1 L2 LLC WSS sync exec cnt inst cnt inst miss miss miss miss cnt cnt cnt
Percentage for number of models at each accuracy level
Figure 6: Percent of models predicted at a given accuracy level for each dynamic behavior 100% 90% 80% 70% 60%
< 0.7
50%
> 0.7
40%
> 0.8
30%
> 0.9
20% 10% 0% dedup
bs
sw
x264
fluid
stream
Figure 7: Percent of models predicted at a given accuracy level for each benchmark program 120 inputs by varying the two variables based on the range of input variables in the default inputs. The experiments were conducted on a dual quad-core machine (i.e., 8-cores total in 2 packages), 2.26 GHz Intel Xeon E5520 with 8MB L2 and 24 GB of RAM, running Linux 2.6.28. To verify usefulness of ThreadMarks in many dynamic optimization scenarios, we predicted the following behaviors that are useful in many dynamic optimizations: • Instruction Count: We measured instruction count of each thread since it is useful to predict execution time in many cases. In computation-intensive applications, the execution time can be accurately predicted solely based on instruction count. We also measured the number of memory access instructions since the memory access stall time can be the bottleneck of a program. Specifically we measured load and store instruction count since they can describe the memory access behaviors and useful for dynamic optimizations. For example, each pair of memory-intensive thread and a computation-intensive thread can be assigned into the same core in order to
14
balance memory access across different cores. Branch instruction count and miss prediction count are measured in order to provide an insight of the performance bottlenecks. If it is predicted that the branch miss prediction will be large, the dynamic optimizer can optimize the thread to reduce the overhead. • Working Set Size: Working set size of each thread is useful for many dynamic optimizations. For example, a thread with huge working set size may cause serious cache sharing problems and memory contention issues when it shares a core with other threads. In that case, a dynamic optimizer may move the thread to another core where it can take larger cache capacity. • Cache Miss: In this experiment, cache misses of different levels are measured. Since cache misses significantly affect thread performance, it is useful if accurately predicted. For instance, with thread dependency graph it can predict the communication overhead among different threads and those threads with high overhead can be merged or scheduled on the same core. • Synchronization: In a multi-threaded application, thread synchronizations are important factors in terms of overall performance. For example, Fluidanimate and Streamcluster use large number of barriers for each iteration, which introduces significant overhead in program execution. Accurate prediction of synchronization overhead among specific threads allows which thread should be merged into one thread to remove the bottleneck. Figure 6 and Figure 7 show different fractions of prediction accuracies over different benchmark programs and dynamic behaviors. We counted the number of models whose accuracies are higher than 0.9, 0.8 and 0.7 respectively. Models with accuracies lower than 0.7 are summed up together since they are filtered out as we set the desired accuracy as 0.7. Figure 6 describes that different dynamic behaviors generally have different levels of prediction accuracies. For example, instruction counts and working set sizes are more deterministic and therefore showing higher prediction accuracies compared to thread synchronization, which is highly dynamic and hard to predict. Cache misses are also harder to predict since they are affected by the capacity of each level of cache, as well as cache consistency protocols and data sharing among different cores. We also observed some stepwise trends in cache misses where the number of cache misses are quite constant within a certain range. In this case, ThreadMarks used regression tree model which catches the constant trends within different ranges. Execution times are combinations of the instruction count, cache miss, and thread synchronization, which makes complex trends. However, the prediction accuracy of execution time can be improved by combining the individual prediction models of different behaviors. The fraction of accuracy levels in Figure 7 tells that different programs have different prediction accuracies for dynamic behaviors. This is because different programs have different program-specific correlations between program inputs and dynamic behaviors, as well as different program structures. For example, Swaptions has much larger fraction of highest accuracy level than X264 since it only takes two input variables which affect most of its dynamic 15
behaviors. X264 takes a video file and many parameters, and contents of the video affects to its dynamic behaviors. Swaptions also has very simple data-parallelism structure whereas X264 has more complicated pipeline-parallelism structure. Following subsections will discuss such differences in benchmark programs, which result in different levels of accuracies in dynamic behavior predictions.
5.1
Dedup
Dedup uses thread pool design pattern with 3 different types of threads namely Chunk, Anchor, and Compress. In the thread pool design pattern, those threads retrieve their work items from shared queues. For Dedup, prediction accuracies for synchronization overheads are lower than other dynamic behaviors. The reason is that the thread pool model makes the synchronization delay of each thread highly depends on the processing time of a previous thread. The Anchor threads in Dedup have different processing times for different input contents, which makes synchronization delays of other threads unpredictable. However, instruction counts and execution times are highly predictable since the overall computations depend on the input file size with linear trends.
5.2
Blackscholes
Blackscholes is a massive data-parallel application that simply distributes its workload over multiple threads. It has a very small working set size, which makes the prediction accuracy of cache misses low even though absolute errors are small. Since the absolute values are very small, the prediction errors for cache misses can be ignored when used in dynamic optimizations. Except the cache misses, most of dynamic behaviors show very clear linear trends and therefore provides high prediction accuracies.
5.3
Swaptions
Swaptions is another computation-intensive application but has larger working set size than Blackscholes. In our experiment, most of the dynamic behavior models show high prediction accuracies compared to other applications. Especially the cache misses are highly predictable, since the working set size of each thread is directly determined by program inputs.
5.4
X264
X264 is a video coding application, which creates individual threads for different video frames. One of the input variable dictates how the threads are overlapped in their executions. For example, if the program input variable is set to 4, at most 4 threads are running together, which potentially increases the degree of parallelism and program
16
performance. X264 generally shows lower prediction accuracies than others since the overlapped execution of threads make noisy trends of dynamic behaviors. Especially cache misses show low accuracies since the overlapped threads have different working set sizes depending on the contents of video frames. However, predictions of synchronization overheads are well captured by log-log model, which provides a high accuracy of the model.
5.5
Fluidanimate
Fluidanimate has many different phases, split by barrier operations. Even though it is a data-parallel application, the split phases have different trends in dynamic behaviors and therefore predicting the whole thread is tricky. In our experiment, fine-grained prediction models are selected by ThreadMarks and used for predictions. For comparison, the average accuracy of individual phases are 7% higher than the thread granularity predictions. Note that the difference in average accuracy is small but noisy phases are isolated, which is beneficial for dynamic optimizations. Most dynamic behaviors showed prediction accuracies greater than 0.8, except synchronization overheads. The barriers in Fluidanimate between different phases cause highly dynamic synchronization patterns.
5.6
Streamcluster
Streamcluster is another data-parallelism application with static load-balancing of working set size. However, the synchronization pattern is complicated since the critical execution path consists of many barrier synchronizations. This makes phase granularity predictions more preferable, which provided 20% higher accuracy on average than thread granularity predictions. The prediction accuracies for synchronization overhead and execution time are lower than other dynamic behaviors due to the complicated synchronization patterns. Synchronization delays take a large portion of entire program execution time, which makes the execution time hard to predict. However, cache misses show high accuracies since Streamcluster uses static load-balancing of working set size. Instruction counts are also highly accurate since the computations are deterministic with respect to program inputs.
5.7
Summary
In overall, ThreadMarks predicted many different dynamic behaviors in benchmark programs with high accuracies. Experimental results show that the models built by ThreadMarks captures complex dynamic behaviors including cache misses and thread synchronizations well. This is mainly due to the design of ThreadMarks framework, which iteratively constructs accurate models by combining the simple models in model pool to capture such complex behaviors. Through the experiment, predictions are made very quickly and accurately, which opens a new opportunity for many dynamic optimizations.
17
6
Related Work
The main contribution of this work is twofold: introducing ThreadMarks, a new platform that automatically builds accurate dynamic behavior models by exploiting its model pool, and showing that the simple models can actually predict complex dynamic behaviors through the framework by experimental evaluations. The model pool used in ThreadMarks is easy to be extended , which supports prediction of many different types of dynamic behaviors and programs. The differences between ThreadMarks and previous works will follow. Several works discuss the relations between inputs and performance. Jiang et al. reveals the strong correlations between program inputs and different program behaviors [18] including loop trip-counts, procedure calling frequencies, basic block execution frequencies, etc. The other two papers use this relations in real applications. Liu et al. predict GPU configurations such as CUDA thread block size and thread block number based on program inputs and receive 1.5–2.8 times of speedup [23]. Mao et al. uses program input to predict java virtue machine optimization option and gain 7-21% speedup [25, 24]. These papers show the potential of predicting based on program inputs. ThreadMarks, however, uses program variables instead of direct program inputs in order to provide better accuracy because the variables have more direct effect on dynamic behaviors. Barnes et al. [3] also use inputs to predict the performance of multi-thread programs, but only consider the execution time of the whole program and based on linear models. Compared to the work, ThreadMarks provides much more flexibility for different types of programs and dynamic behaviors since one can extend ThreaMarks with different profiling granularities and various dynamic behaviors for better accuracy. There are many papers investigating compiler-time behavior prediction to guide optimizations. Cascaval et al. proposed an analytical model to decompose execution time to CPU time, memory time, I/O time, and communication time [7]. They use approximate equations to predict each part, providing fairly accurate results. Other work utilized micro benchmarks to estimate the performance of target architectures and then count the appearance frequency of these micro benchmarks in programs to predict the performance [14, 15, 16, 29]. Other work focused specifically on predicting cache performance by using static data dependence graph [10, 22, 31]. ThreadMarks framework builds on these previous approaches by constructing models based on their observations but incorporating runtime variable correlations. Machine learning is another approach for performance prediction [8, 11, 20, 32, 33, 34, 35]. As discussed in 2.1, ThreadMarks is essentially performing machine learning as well, although the current implementation uses simpler models and integrates runtime variable correlations. The advantage of simpler models is reduced training time and ease of interpretation of the results (i.e., an engineer can make sense of a simple model, where a neural network can be much harder to comprehend). The ThreadMarks framework could easily be extended to add these more complex
18
models into the model pool. The main contribution beyond these works is demonstrating program variable correlations, determining how prune variables that do not need to be profiled, and performing an iterative phase decomposition to improve the model accuracy.
7
Summary
An accurate performance model is vital for many dynamic performance tuning tools. This paper targets the problem of building an accurate performance prediction system. To achieve this, the proposed system, ThreadMarks, exploits the statistical relations between program variables and different performance components as well as the interactions between threads. To improve accuracy, ThreadMarks automatically tries different phase granularity and different model prototypes to reach a suitable solution. This work demonstrates that ThreadMarks can automatically generate accurate models for the behavior of many real-world multithreaded applications.
References [1] M. Arnold, M. Hind, and B. G. Ryder. Online feedback-directed optimization of Java. ACM SIGPLAN Notices, 37(11):111, November 2002. [2] V. Bala, E. Duesterwald, and S. Banerjia. Dynamo: a transparent dynamic optimization system. In Programming Language Design and Implementation, pages:1–12. [3] B. Barnes, B. Rountree, D. Lowenthal, J. Reeves, B. de Supinski, and M. Schulz. A regression-based approach to scalability prediction. In Proc. of the 2008 International Conference on Supercomputing, pages 368–377, 2008. [4] C. Bienia, S. Kumar, J. P. Singh, and K. Li. The PARSEC Benchmark Suite: Characterization and Architectural Implications. In Proceedings of the 17th International Conference on Parallel Architectures and Compilation Techniques, Oct. 2008. [5] C. Bishop et al. Pattern recognition and machine learning. Springer New York:, 2006. [6] M. G. Burke, J. Whaley, J.-D. Choi, S. Fink, D. Grove, M. Hind, V. Sarkar, M. J. Serrano, V. C. Sreedhar, and H. Srinivasan. The Jalape˜no dynamic optimizing compiler for Java. Proceedings of the ACM 1999 conference on Java Grande - JAVA ’99, pages 129–141, 1999. [7] C. Cascaval, L. DeRose, D. Padua, and D. Reed. Compile-time based performance prediction. Lecture notes in computer science, pages 365–379, 2000. [8] J. Cavazos, C. Dubach, F. Agakov, E. Bonilla, M. F. P. O’Boyle, G. Fursin, and O. Temam. Automatic performance model construction for the fast software exploration of new hardware designs. In CASES ’06: Proceedings of the 2006 international conference on Compilers, architecture and synthesis for embedded systems, pages 24–34, 2006. [9] A. Chandra, W. Gong, and P. Shenoy. Dynamic resource allocation for shared data centers using online measurements. ACM SIGMETRICS Performance Evaluation Review, 31(1):300, June 2003. [10] D. Chandra, F. Guo, S. Kim, and Y. Solihin. Predicting inter-thread cache contention on a chip multi-processor architecture. In Proc. of the 11th International Symposium on High-Performance Computer Architecture, pages 340–351, 2005. [11] C. Dubach, J. Cavazos, B. Franke, G. Fursin, M. F. P. O’Boyle, and O. Temam. Fast compiler optimisation evaluation using code-feature based performance prediction. In ACM International Conference on Computing Frontiers, 2007. [12] E. Duesterwald and M. Street. Software Profiling for Hot Path Prediction : Less is More. Larus, 1(212):202–211, 2000. [13] M. Efroymson. Multiple regression analysis. Mathematical methods for digital computers, 1:191–203, 1960. [14] T. Fahringer. Evaluation of benchmark performance estimation for parallel Fortran programs on massively parallel SIMD and MIMD computers. In IEEE Proceedings of the 2nd Euromicro Workshop on Parallel and Distributed Processing, Malaga/Spain, 1994. [15] T. Fahringer. Automatic performance prediction of parallel programs. Kluwer Academic Publishers Norwell, MA, USA, 1996. [16] T. Fahringer. Estimating cache performance for sequential and data parallel programs. Lecture Notes in Computer Science, pages 840–849, 1997. [17] S. Hong and H. Kim. An analytical model for a GPU architecture with memory-level and thread-level parallelism awareness. June 2009. [18] Y. Jiang, E. Zhang, K. Tian, F. Mao, M. Gethers, X. Shen, and Y. Gao. Exploiting Statistical Correlations for Proactive Prediction of Program Behaviors. In Proc. of the 2010 International Symposium on Code Generation and Optimization, Apr. 2010. [19] T. Lai, H. Robbins, and C. Wei. Strong consistency of least squares estimates in multiple regression II* 1. Journal of Multivariate Analysis, 9(3):343–361, 1979. [20] H. Leather, E. Bonilla, and M. O’Boyle. Automatic Feature Generation for Machine Learning Based Optimizing Compilation. In Proc. of the 2009 International Symposium on Code Generation and Optimization, Mar. 2009.
19
[21] J. Lee et al. Thread tailor: Dynamically weaving threads together for efficient, adaptive parallel applications. In Proc. of the 37th Annual International Symposium on Computer Architecture, 2010. [22] F. Liu, F. Guo, Y. Solihin, S. Kim, and A. Eker. Characterizing and modeling the behavior of context switch misses. In Proc. of the 17th International Conference on Parallel Architectures and Compilation Techniques, pages 91–101, 2008. [23] L. Liu and S. Rus. perflint: A Context Sensitive Performance Advisor for C++ Programs. In Proc. of the 2009 International Symposium on Code Generation and Optimization, Mar. 2009. [24] F. Mao and X. Shen. Cross-input learning and discriminative prediction in evolvable virtual machines. In Proc. of the 2009 International Symposium on Code Generation and Optimization, pages 92–101, 2009. [25] F. Mao, E. Zhang, and X. Shen. Influence of program inputs on the selection of garbage collectors. In Proc. of the 2009 International Conference on Virtual Execution Environments, pages 91–100, 2009. [26] P. Nagpurkar, C. Krintz, M. Hind, P. Sweeney, and V. Rajan. Online phase detection algorithms. In Proc. of the 2006 International Symposium on Code Generation and Optimization, page 123, 2006. [27] J. Nieplocha et al. Evaluating the potential of multithreaded platforms for irregular scientific computations. In Proc. of the 2007 ACM Conference on Computing Frontiers, pages 47–58, 2007. [28] Nvidia. CUDA Programming Guide, June 2007. http://developer.download.nvidia.com/compute/cuda. [29] R. Saavedra-Barrera. Machine characterization and benchmark performance prediction. University of California at Berkeley, Berkeley, CA, 1988. [30] S. Sathaye, P. Ledak, J. Leblanc, S. Kosonocky, M. Gschwind, J. Fritts, Z. Filan, A. Bright, D. Appenzeller, E. Altman, and C. B. O. A. Agricola. Targeting multigigahertz with binary translation. In Proc, 1999. [31] Y. Solihin, F. Guo, and S. Kim. Predicting cache space contention in utility computing servers. In Proceedings of the 19th IEEE International Parallel and Distributed Processing Symposium (IPDPS’05)-Workshop 10-Volume 11, 2005. [32] M. Stephenson and S. Amarasinghe. Predicting unroll factors using supervised classification. In CGO ’05: Proceedings of the international symposium on Code generation and optimization, pages 123–134, 2005. [33] G. Tournavitis, Z. Wang, B. Franke, and M. F. O’Boyle. Towards a holistic approach to auto-parallelization: integrating profile-driven parallelism detection and machine-learning based mapping. SIGPLAN Notices, 44(6):177–187, 2009. [34] Z. Wang and M. O’Boyle. Mapping parallelism to multi-cores: a machine learning based approach. ACM SIGPLAN Notices, 44(4):75–84, 2009. [35] Z. Wang and M. F. O’Boyle. Mapping parallelism to multi-cores: a machine learning based approach. In PPoPP ’09: Proceedings of the 14th ACM SIGPLAN symposium on Principles and practice of parallel programming, pages 75–84, 2009.
20