IEEE TRANSACTIONS ON GEOSCIENCE AND REMOTE SENSING, VOL. 49, NO. 9, SEPTEMBER 2011
3281
Three-Dimensional Humidity Retrieval Using a Network of Compact Microwave Radiometers to Correct for Variations in Wet Tropospheric Path Delay in Spaceborne Interferometric SAR Imagery Swaroop Sahoo, Steven C. Reising, Senior Member, IEEE, Sharmila Padmanabhan, Student Member, IEEE, Jothiram Vivekanandan, Senior Member, IEEE, Flavio Iturbide-Sanchez, Member, IEEE, Nazzareno Pierdicca, Member, IEEE, Emanuela Pichelli, and Domenico Cimini
Abstract—Spaceborne interferometric synthetic aperture radar (SAR) (InSAR) imaging has been used for over a decade to monitor tectonic movements and landslides, as well as to improve digital elevation models. However, InSAR is affected by variations in round-trip propagation delay due to changes in ionospheric total electron content and in tropospheric humidity and temperature along the signal path. One of the largest sources of uncertainty in estimates of tropospheric path delay is the spatial and temporal variability of water vapor density, which currently limits the quality of InSAR products. This problem can be partially addressed by using a number of SAR interferograms from subsequent satellite overpasses to reduce the degradation in the images or by analyzing a long time series of interferometric phases from permanent scatterers. However, if there is a sudden deformation of the Earth’s surface, the detection of which is one of the principal objectives of InSAR measurements over land, the effect of water vapor variations cannot be removed, reducing the quality of the interferometric products. In those cases, high-resolution informaManuscript received July 26, 2010; revised December 3, 2010; accepted January 9, 2011. Date of publication May 16, 2011; date of current version August 26, 2011. This work was supported in part by the European Space Agency under Grant ESTEC 21207/07/NL/HE and in part by the Department of Defense Center for Geosciences/Atmospheric Research at Colorado State University under Cooperative Agreement W911NF-06-2-0015 with the Army Research Laboratory. S. Sahoo and S. C. Reising are with the Microwave Systems Laboratory, Electrical and Computer Engineering Department, Colorado State University, Fort Collins, CO 80523 USA (e-mail:
[email protected];
[email protected]). S. Padmanabhan is with the Caltech/National Aeronautics and Space Administration Jet Propulsion Laboratory, Pasadena, CA 91109 USA (e-mail:
[email protected]). J. Vivekanandan is with the National Center for Atmospheric Research, Boulder, CO 80301 USA (e-mail:
[email protected]). F. Iturbide-Sanchez is with the I. M. Systems Group at the National Oceanic and Atmospheric Administration/National Environmental Satellite, Data, and Information Service Center for Satellite Applications and Research, Camp Springs, MD 20746 USA (e-mail:
[email protected]). N. Pierdicca is with the Department of Information, Electronic and Telecommunication Engineering, Sapienza University of Rome, 00184 Rome, Italy (e-mail:
[email protected]). E. Pichelli is with the Department of Physics/Center of Excellence for Remote Sensing and Modeling of Severe Weather (CETEMPS), University of L’Aquila, 67010 Coppito L’Aquila, Italy (e-mail: emanuela.
[email protected]). D. Cimini is with Institute of Methodologies for Environmental Analysis of the Italian National Research Council (IMAA-CNR), 85100 Potenza, Italy (e-mail:
[email protected]). Color versions of one or more of the figures in this paper are available online at http://ieeexplore.ieee.org. Digital Object Identifier 10.1109/TGRS.2011.2119400
tion on the atmospheric water vapor content and its variation with time can be crucial to mitigate the effect of wet-tropospheric path delay variations. This paper describes the use of a ground-based microwave radiometer network to retrieve 3-D water vapor density with fine spatial and temporal resolution, which can be used to reduce InSAR ambiguities due to changes in wet-tropospheric path delay. Retrieval results and comparisons between the integrated water vapor measured by the radiometer network and satellite data are presented. Index Terms—Digital elevation models, humidity measurement, microwave radiometry, moisture, remote sensing.
I. I NTRODUCTION
S
PACEBORNE interferometric synthetic aperture radar (SAR) (InSAR) imaging has been used for over a decade to monitor tectonic movements and landslides on the centimeter scale. InSAR makes use of the difference in phase between two SAR images taken at different times or from different viewing angles to produce an interferogram [1]. The spatial and temporal variability of water vapor, pressure, and temperature introduce changes in the round-trip propagation delay of the signals transmitted and received by the radar. The effect of water vapor variability can be reduced by averaging a large number of interferograms [2], just as the effect of uncorrelated noise decreases when averaging independent samples. It can also be estimated by analyzing a long time series of interferometric phases of very stable and coherent permanent scatterers (PSs), i.e., the PS technique [3]. However, intervening sudden surface deformation prevents such averaging and multi-image approaches. In these cases, the availability of high-resolution spatial and temporal information on atmospheric water vapor would be useful to mitigate its effect on SAR interferograms. This paper focuses on measurements performed during the Mitigation of Electromagnetic Transmission errors induced by Atmospheric WAter Vapor Effects (METAWAVE) experiment sponsored by the European Space Agency (ESA). As part of METAWAVE, the Microwave Systems Laboratory at Colorado State University (CSU) deployed a network of Compact Microwave Radiometers for Humidity profiling (CMR-H) to measure the 3-D water vapor density over Rome, Italy. This paper discusses the METAWAVE experiment and presents 3-D water vapor retrieval results. A comparison is
0196-2892/$26.00 © 2011 IEEE
3282
IEEE TRANSACTIONS ON GEOSCIENCE AND REMOTE SENSING, VOL. 49, NO. 9, SEPTEMBER 2011
TABLE I L OCATIONS OF G ROUND -BASED C OMPACT M ICROWAVE R ADIOMETERS D EPLOYED IN A N ETWORK IN ROME , I TALY
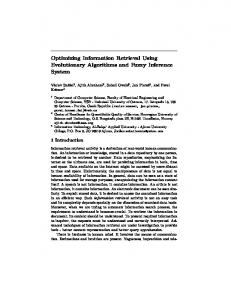
Fig. 1. Schematic depiction of three CMR-Hs scanning the atmosphere over Rome, Italy, in azimuth and elevation angles. Each radiometer scanned elevation angles from 30◦ to 80◦ at three different azimuth angles, i.e., along the two baselines connecting it with the other two radiometers and along the median of those baselines.
presented between retrievals from measurements using the network of CMR-H, those using other spaceborne instruments, and results from a numerical weather prediction model. In Section I, the background of the METAWAVE experiment is discussed. Section II describes the experimental setup of the field experiment and the instruments used therein, i.e., the CMR-H, the Moderate Resolution Imaging Spectroradiometer (MODIS), and the Medium Resolution Imaging Spectrometer (MERIS). Section III summarizes the 3-D water vapor retrieval technique. Section IV discusses the results of the experiment, focusing on the 3-D water vapor field retrieved from the radiometer network and on the comparison of the integrated water vapor from the CMR-H network with that from MODIS on National Aeronautics and Space Administration (NASA)’s Aqua satellite, as well as with that from MERIS on ESA’s Environmental Satellite (Envisat). Conclusions and future work are discussed in Section V.
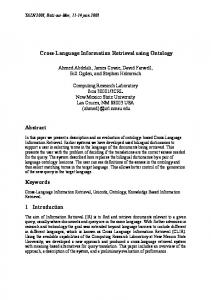
Fig. 2. Map showing the locations of the three nodes of the network of CMR-Hs deployed in Rome, Italy, during the METAWAVE experiment in September and October 2008.
The three radiometers scanned the atmosphere above the triangular network in azimuth and elevation angles, as shown in Fig. 1. A scanning strategy was chosen for maximal coverage of the atmosphere above the network with a repeat period of 10 min. Each radiometer viewed three azimuth angles and ten angles in elevation from 10◦ zenith angle to 30◦ above the horizon, i.e., elevation angles of 30◦ to 80◦ . The three azimuth angles scanned by each radiometer are represented by yellow segments on the map in Fig. 2. These ground-based measurements were performed from September 20, 2008 to October 3, 2008, a period that included a number of overpasses of MODIS on NASA’s Aqua satellite and of MERIS and the Advanced Synthetic Aperture Radar (ASAR) on ESA’s Envisat. A photograph of the deployment of a CMR-H on the terrace of the Sapienza University of Rome is shown in Fig. 3.
A. CMR-H II. E XPERIMENT D ESCRIPTION As part of the METAWAVE experiment, the Microwave Systems Laboratory at CSU deployed in Rome, Italy, a groundbased network of scanning CMR-H [4] that were custom built at CSU to observe 3-D water vapor density with fine spatial and temporal resolution. Three CMR-Hs were deployed in a triangular topology to implement a three-node network of scanning radiometers, as shown in Fig. 1. The three radiometers were located at the Sapienza University of Rome (Engineering Faculty) and the Tor Vergata University of Rome, as well as a third location, Picco Tre Signori. Table I gives the latitude and longitude of the locations of the radiometers in Rome.
Developed using state-of-the-art monolithic-microwaveintegrated-circuit technology, the CMR-H [4] is a low-mass, low-power, and small-volume microwave radiometer that measures simultaneously at four optimally selected K-band frequencies near the 22.235-GHz water vapor absorption line, i.e., 22.12, 22.67, 23.25, and 24.5 GHz. Table II shows the specifications of the CMR-H. The radiometer has a radiometric resolution (NEΔT) of 0.2 K for an integration time of 3 s [4]. The CMR-H has been deployed and tested during previous experiments in which its ability to retrieve atmospheric water vapor has been demonstrated [5]. In this paper, a network of CMR-Hs is implemented in order to demonstrate its capability to retrieve water vapor with
SAHOO et al.: HUMIDITY RETRIEVAL USING A NETWORK OF COMPACT MICROWAVE RADIOMETERS
3283
Fig. 4. Vertical plane scanned by the radiometer is divided into grid cells to perform the 3-D water vapor retrieval.
integrated water vapor (IWV) data are available at a 5-km resolution [6]. C. MERIS
Fig. 3. Deployment of CMR-H on the terrace of Sapienza University of Rome for the METAWAVE experiment. TABLE II S PECIFICATIONS OF THE CMR-H
quality comparable to that of well-known water vapor observations, including the MODIS and MERIS integrated water vapor products. B. MODIS The MODIS instrument has 36 channels spanning the spectral region between 0.4 and 15 μm. Five channels in the nearinfrared region of 0.8–1.3 μm are used for remote sensing of water vapor. Water vapor absorption channels with decreasing absorption coefficients are centered at 0.936, 0.940, and 0.905 μm, respectively. The strong absorption channel at 0.936 μm is most useful under dry conditions, while the weak absorption channel at 0.905 μm is most useful under very humid conditions or low solar elevation angles [6]. The retrieval technique relies on comparing the magnitude of solar radiation reflected from the ground at absorbing and non-absorbing channels in order to detect its absorption by water vapor from the surface to the sensor. The equivalent total vertical amount of water vapor is retrieved from a comparison between the reflected solar radiation in the absorbing channel with that in nearby nonabsorbing channels. MODIS has a spatial resolution of 1 km, but operational
MERIS’s main objectives are to observe ocean color to understand the ocean carbon cycle and to estimate cloud type and albedo, top and bottom of atmosphere vegetation indices, and other geophysical parameters [7]. MERIS retrieves total columnar atmospheric water vapor over the entire Earth once every three days. MERIS has 15 programmable spectral frequency bands, two of them in the near-infrared and referred to as the water vapor channels, i.e., the absorption-free band at 885 nm and the absorption band at 900 nm. MERIS retrieves the total water vapor column based on differential absorption between these two nearby water vapor bands. MERIS nearinfrared water vapor products are available at a full resolution of 300 m and at a reduced resolution of 1200 m [7], [8]. Finer spatial resolution than previous polar orbiting instruments makes MERIS very useful to the meteorological community for observing integrated water vapor on a global basis with a spatial resolution of hundreds of meters. The MERIS product with full resolution was used for comparison with data from the CMR-H network. III. R ETRIEVAL OF 3-D WATER VAPOR D ENSITY Three-dimensional water vapor density is retrieved from the brightness temperatures measured by the CMR-H network using algebraic reconstruction tomography, optimal estimation, and Kalman filtering [5]. This process is briefly summarized here. The vertical plane scanned by the radiometer is divided into grid cells, as shown in Fig. 4. A water vapor profile from radiosonde(s) is used as an a-priori or reference profile. Assuming the reference atmospheric state, a radiative transfer equation in discrete form is used to calculate the brightness temperature at each measurement frequency that would be measured by a radiometer pointing at each elevation angle. The difference between the
3284
IEEE TRANSACTIONS ON GEOSCIENCE AND REMOTE SENSING, VOL. 49, NO. 9, SEPTEMBER 2011
measured and calculated brightness temperatures is termed the variation in brightness temperature. The absorption coefficient in each of the grid cells is calculated using state-of-the-art absorption models [9]–[11]. The variation of the brightness temperature at each elevation angle and the variation of the absorption coefficient in each grid cell are related by the elements of the Jacobian matrix. Calculating the absorption coefficient from the brightness temperature variation and the Jacobian matrix is an ill-posed problem because the number of measurements is less than the number of grid cells at which the absorption coefficient needs to be known. For that reason, the deviation of each absorption coefficient from its reference value is calculated using Bayesian optimal estimation. The absorption coefficient retrieved in this way for each of the four brightness temperature measurement frequencies is fit to the Van Vleck–Weisskopf model [12] of the water vapor absorption line to retrieve the water vapor density in each of the grid cells. In addition, spatial interpolation (kriging) is used to retrieve the water vapor density in each of the unsampled locations. The 3-D water vapor can be retrieved with a vertical spatial resolution of 0.5 km and with a similar horizontal spatial resolution [5]. The water vapor densities are retrieved at 20 equally spaced vertical levels from 0.5 to 10 km. The maximum retrieval altitude is approximately 10 km. The temporal resolution of the retrieved water vapor field is dependent on the time required to scan the spatial volume measured by the three radiometers. In the case of the METAWAVE experiment, the 3-D water vapor field can be retrieved with a temporal resolution of approximately 10 min.
Fig. 5. Water vapor density from CMR-H observations at three altitudes above ground level. The vertical axis is not to scale. TABLE III RMS E RRORS OF R ETRIEVED WATER VAPOR D ENSITY IN VARIOUS A LTITUDE R ANGES , E XPRESSED AS P ERCENTAGES
B. Error Analysis of Retrieved 3-D Water Vapor Field IV. E XPERIMENTAL R ESULTS Radiometric measurements were performed at the four measurement frequencies of 22.12, 22.67, 23.25, and 24.5 GHz. The measured brightness temperatures were used to retrieve the 3-D water vapor field in the volume scanned by the radiometers. The results of the METAWAVE experiment are discussed in detail in the following sections.
A. Three-Dimensional Water Vapor Density Results The 3-D water vapor density field was retrieved from brightness temperatures measured by the three CMR-Hs during the METAWAVE experiment. Horizontal slices of the retrieved water vapor density at altitudes of 0.5, 2.0, and 3.0 km above ground level at 21:30 Coordinated Universal Time (UTC) on September 20, 2008, near the overpass time of the ASAR on Envisat, are shown in Fig. 5. The size of each pixel in this figure is 500 m × 500 m. The water vapor profile from a radiosonde launched at 21:30 UTC on September 20, 2008, was used as the a priori for retrieving the 3-D water vapor field. The spatial variability of water vapor densities in each horizontal slice is approximately 23.8%, 17.0%, and 5.0% at 0.5-, 2.0-, and 3.0-km altitudes, respectively. This shows that atmospheric water vapor densities with significant dynamic range have been retrieved, demonstrating the ability of the CMR-H network to sense substantial variability in water vapor density.
An estimate of uncertainty in the retrieved water vapor density profiles is given by the error covariance matrix S [13] S = Sρv − Sρν ,TB ST−1 S B TB ,ρν
(1)
where Sρν is the prior covariance matrix of the water vapor density profiles based on the climatological variability of water vapor density during the period of the METAWAVE experiment, STB is the error covariance matrix of the measured brightness temperatures with respect to a reference or a-priori profile [5], Sρν ,TB is the error cross-covariance matrix for water vapor density and measured brightness temperatures, and STB ,ρν is the error cross-covariance matrix for measured brightness temperatures and water vapor density. The error calculation shows that prior variability in water vapor density is reduced due to the inclusion of measurements. The amount by which it is reduced is directly related to the correlation between water vapor density and measured brightness temperatures, given by the cross-covariance matrices Sρν ,TB and STB ,ρν , and inversely related to the variation in the measurements, given by STB . The square root of each main diagonal element of S represents the rms error of each retrieved water vapor density. Since the error covariance matrices depend upon variable water vapor density profile and instrument characteristics, lower and upper error bounds were calculated. These bounds of rms error in retrieved water vapor density in various altitude ranges are given as percentages in Table III.
SAHOO et al.: HUMIDITY RETRIEVAL USING A NETWORK OF COMPACT MICROWAVE RADIOMETERS
3285
Fig. 6. 2008.
Comparison between the 2-D water vapor retrieved from the CMR-H network and MM5 model results. (a) On September 20, 2008. (b) On October 3,
Fig. 7.
Comparison between integrated precipitable water vapor from the CMR-H network and MODIS on September 29, 2008.
The minimum value of the retrieved water vapor density is approximately 1 × 10⁻³ g/m3 . It should be noted that this is most relevant at the maximum altitude of the retrieval (i.e., 10 km), where the error is greater than 13%. C. Comparison of 2-D Water Vapor Results From CMR-H and MM5 Model Output The 2-D water vapor output from the Mesoscale Model 5 (MM5) was compared to the 2-D water vapor densities retrieved from the CMR-H network. The MM5 numerical weather prediction model has a horizontal resolution of 1 km on the inner domain and a variable vertical resolution [14]. Fig. 6(a) and (b) shows comparisons of the 2-D water vapor from the MM5 model and from the CMR-H network for September 20, 2008, at 21:40 UTC and October 3, 2008, at 10:10 UTC, respectively. The measurement time interval or temporal resolution of the radiometer retrievals is 10 min. In the lowest 2 km of the troposphere, the CMR-H network retrievals show greater water vapor density and more variability than the MM5 model output on both days. At altitudes of 3 km and higher in Fig. 6(a), the water vapor densities for both CMR-H network retrievals and MM5 model output range from 1 to 4 g/m3 . Again, at altitudes of 3 km and higher, Fig. 6(b) shows values for CMR-H network retrievals ranging from 2 to 5 g/m3 and MM5 model outputs
ranging from 2 to 4.5 g/m3 . Thus, the water vapor density in the middle and upper troposphere is nearly the same for CMR-H network retrievals and MM5 model output for these cases. As shown in Fig. 6(a), the MM5 model output has a maximum water vapor density of approximately 8 g/m3 , while the CMR-H network retrievals have a maximum value of approximately 9.5 g/m3 . Fig. 6(b) shows larger values of water vapor density on October 3, 2008, than those of Fig. 6(a) on September 20, 2008. From these results, we conclude that the CMR-H network retrievals exhibit similar spatial variability and average values to those of the MM5 numerical weather model output. D. Comparison of Integrated Precipitable Water Vapor From CMR-H Network and MODIS A comparison of the vertically integrated precipitable water vapor (IWV) retrieved from the CMR-H network with that from the MODIS instrument on NASA’s Aqua satellite is presented here. The 3-D atmospheric water vapor densities retrieved from the CMR-H network have been vertically integrated to obtain IWV at each latitude/longitude location. Then, these IWV results have been decimated to a spatial resolution of 1 km in order to compare them with the IWV from MODIS. From Fig. 7, it is evident that the CMR-H and MODIS IWV retrievals exhibit similar water vapor densities.
3286
IEEE TRANSACTIONS ON GEOSCIENCE AND REMOTE SENSING, VOL. 49, NO. 9, SEPTEMBER 2011
Fig. 8. Comparison between integrated precipitable water vapor from the CMR-H network and MERIS on September 29, 2008.
This analysis was performed to compare the average IWV of the CMR-H network retrievals with the average IWV of the MODIS retrievals. In Fig. 7, the average IWV from MODIS is 1.23 cm, while the average of the CMR-H network retrievals is 1.28 cm. It should be noted that the MODIS water vapor products have an accuracy of 5%–10% [6]. Since the average values of IWV retrieved from the CMR-H network and from MODIS agree more closely than the accuracy of MODIS water vapor retrievals, we conclude that the CMR-H network retrievals yield a good average value of IWV.
E. Comparison of Integrated Precipitable Water Vapor From CMR-H Network and MERIS A comparison of the IWV values retrieved from MERIS on ESA’s Envisat and the CMR-H network is presented here. Spatially and temporally coincident MERIS IWV and CMR-H network IWV were used for the comparison. A comparison of the IWV from the CMR-H network retrievals with the MERIS retrievals for September 29, 2008 at 09:50 UTC is shown in Fig. 8. The a priori for the CMR-H network retrieval shown in Fig. 8 is an average of the water vapor profiles from radiosondes launched at 6:00 UTC and 12:00 UTC on September 29, 2008, from Pratica di Mare, a station located about 25 km southwest of the center of the CMR-H network in Rome. The CMR-H IWV data have a horizontal resolution of 500 m. Since the full-resolution products of MERIS have been used, the CMR-H network retrievals have been interpolated to produce water vapor images with a 300-m spatial resolution. There are 394 pairs of colocated spatial samples from MERIS and the CMR-H network on September 29, 2008 from 09:40 UTC– 09:50 UTC. The average IWV value of the CMR-H network retrievals is 1.29 cm, while the average IWV of the MERIS retrievals is 1.30 cm. Fig. 9 shows the correlation between the IWV from MERIS retrievals and those from the CMR-H network retrievals. The solid line represents the best fit between the two sets of data. The correlation coefficient is 0.64. A linear fit yielded the relationship MERIS IWV = 1.009 ∗ (CMR-H IWV) + 0.016 cm. The mean of the difference between the two data sets (i.e., bias) is 0.01 cm. The standard deviations of the MERIS and CMR-H network retrievals are 0.023 and 0.034 cm, respec-
Fig. 9. Scatter plot for CMR-H and MERIS integrated precipitable water vapor on September 29, 2008.
tively. The absolute value of the difference in IWV between the MERIS and CMR-H network retrievals is approximately 0.1 to 0.6 mm. A similar comparison was performed for September 30, 2008, from 09:15–09:25 UTC, as shown in Fig. 10. Similar to the previous case, the a priori for the CMR-H network is an average of the water vapor profiles from radiosondes launched from Pratica di Mare at 6:00 UTC and 12:00 UTC on September 30, 2008. Again, there are 394 pairs of colocated spatial samples from the MERIS and CMR-H network. The correlation between the IWV from the MERIS retrievals and that from the CMR-H network retrievals is shown in Fig. 11. In contrast to Fig. 9, the IWV data are scattered widely on both sides of the linear fit, whereas in Fig. 9, the data are close to the best fit line. Correspondingly, a somewhat lower correlation coefficient of 0.51 is observed. A linear fit yielded the relationship MERIS IWV = 0.975 ∗ (CMR-H IWV) − 0.032 cm. The mean of the difference between the MERIS and CMR-H network data is −0.0151 cm. The standard deviations of the IWV data from MERIS and CMR-H network retrievals are 0.034 and 0.028 cm, respectively. The absolute value of the difference in IWV between the MERIS and CMR-H network retrievals is approximately 0.2 to 0.75 mm. The mean values and ranges of the differences between the two IWV data sets show quite good agreement in moderately humid conditions. The absolute value of the difference between
SAHOO et al.: HUMIDITY RETRIEVAL USING A NETWORK OF COMPACT MICROWAVE RADIOMETERS
3287
Fig. 10. Comparison of integrated precipitable water vapor from the CMR-H network and MERIS on September 30, 2008.
Fig. 11. Scatter plot for CMR-H and MERIS integrated precipitable water vapor on September 30, 2008.
the MERIS and CMR-H network data in both of the two cases considered is between 0.1 and 0.75 mm, while the error of water vapor content for MERIS over land is 1.65 mm rms [15]. Since the differences between the IWV from MERIS and CMR-H network retrievals are significantly smaller than the error of MERIS retrievals, the CMR-H network retrievals compare very well with MERIS retrievals. Therefore, in comparison to well-known satellite data products, the CMR-H network retrievals have good potential to correct for variations in wet tropospheric delay in InSAR imagery. V. C ONCLUSION AND F UTURE W ORK Results from brightness temperature measurements from a ground-based CMR-H network during the METAWAVE experiment demonstrate the ability to retrieve 3-D water vapor with high accuracy. The retrieval technique achieves a vertical and horizontal resolution of 500 m and a time resolution of approximately 10 min. These retrievals use water vapor profiles from nearby radiosondes as the a priori. Comparisons between retrievals from CMR-H network-measured brightness temperatures and infrared differential-absorption measurements from the MODIS and MERIS instruments aboard polar-orbiting satellites show that CMR-H network retrievals of 3-D water vapor show good potential to correct InSAR imagery for variations in wet tropospheric delay. Additionally, in contrast to the poor temporal coverage of polar-orbiting satellites, CMR-H
networks have the potential to provide water vapor data continuously with 500-m spatial and 10-min temporal resolution for all of the locations where they are deployed. From the comparison of the CMR-H network data with the MERIS data, it has become clear that MERIS and CMR-H network retrievals agree well under moderately humid conditions and can be used to retrieve columnar water vapor content with a difference of 0.1 to 0.75 mm for geographically collocated pixels. These results demonstrate the capability of the CMR-H network to retrieve IWV with high spatial and temporal resolution, while maintaining quality comparable to that of mature water vapor products. More comparisons need to be performed in order to validate the 3-D water vapor density retrievals from CMR-H network brightness temperature measurements and to determine definitively whether or not such retrievals can be used to correct InSAR images for variations in wet tropospheric path delay. A good method to compare and validate the available CMR-H network and MERIS data would be to correct an interferogram retrieved from Envisat’s ASAR using the CMR-H network 3-D water vapor density retrievals as well as the MERIS IWV retrievals and then to compare the two corrected images. As already discussed, interferograms in the form of contour maps are derived from subsequent SAR overpasses [1]. These interferograms exhibit artifacts due to temporal and spatial variations in atmospheric water vapor, which are one of the major factors limiting the use of SAR interferograms. Therefore, to create accurate interferometric products of regions with significant amounts of integrated water vapor, a technique of averaging interferograms from subsequent satellite overpasses has been developed. This technique consists of averaging to smooth the random effects of the atmosphere and reduce the standard deviation of the related error in the interferometric phase [2] [16]. At least 20 to 30 SAR overpasses are required for this approach to be effective. In order to monitor tectonic movements and landslides, any information on excess path due to water vapor at a spatial resolution comparable to that of the radar would be useful to reduce the number of interferograms necessary to determine the surface displacement that has occurred. The retrieved excess path can be converted into phase delay and removed from the interferometric phase to mitigate the errors due to the wet troposphere. During the METAWAVE experiment, the water vapor field retrieved from the CMR-H network has been compared to those retrieved
3288
IEEE TRANSACTIONS ON GEOSCIENCE AND REMOTE SENSING, VOL. 49, NO. 9, SEPTEMBER 2011
from spaceborne remote sensing instruments, including MERIS and MODIS, for validation purposes. It was not possible to directly compare the CMR-H water vapor fields with the InSAR interferograms from Envisat data because Envisat provides one interferogram after each 35-day repeat cycle, when it is again in the same orbit over the same geographic location. In comparison, the CMR-H network data were collected for a period of approximately 15 days. Multiple Envisat overpasses occurred over the experiment site during that period of time, but with different orbits, one ascending and one descending, from which an interferogram could not be derived. Therefore, additional experiments are needed to fulfill this objective. R EFERENCES [1] D. Massonnet and K. L. Feigl, “Radar interferometry and its application to changes in the Earth’s surface,” Rev. Geophys., vol. 36, no. 4, pp. 441– 500, 1998. [2] H. A. Zebker, P. A. Rosen, and S. Hensley, “Atmospheric effects in interferometric synthetic aperture radar surface deformation and topographic maps,” J. Geophys. Res., vol. 102, no. B4, pp. 7547–7563, 1997. [3] A. Ferretti, C. Prati, and F. Rocca, “Permanent scatterers in SAR interferometry,” IEEE Trans. Geosci. Remote Sens., vol. 39, no. 1, pp. 8–20, Jan. 2001. [4] F. Iturbide-Sanchez, S. C. Reising, and S. Padmanabhan, “A miniaturized spectrometer radiometer based on MMIC technology for tropospheric water vapor profiling,” IEEE Trans. Geosci. Remote Sens., vol. 44, no. 7, pp. 2181–2193, Jul. 2007. [5] S. Padmanabhan, S. C. Reising, J. Vivekanandan, and F. Iturbide-Sanchez, “Retrieval of atmospheric water vapor density with fine spatial resolution using three-dimensional tomographic inversion of microwave brightness temperatures measured by a network of scanning compact radiometers,” IEEE Trans. Geosci. Remote Sens., vol. 7, no. 11, pp. 3708– 3721, Nov. 2009. [6] B.-C. Gao and Y. J. Kaufman, “Water vapor retrievals using Moderate Resolution Imaging Spectroradiometer (MODIS) near-infrared channels,” J. Geophys. Res., vol. 108, no. D13, p. 4389, 2003. DOI:10.1029/2002JD003023. [7] MERIS Product Handbook, ESA, Paris, 2002, Issue 1.1. [8] R. Bennartz and J. Fischer, “Retrieval of columnar water vapor over land from backscattered solar radiation using the Medium Resolution Imaging Spectrometer,” Remote Sens. Environ., vol. 78, no. 3, pp. 274–283, Dec. 2001. [9] P. W. Rosenkranz, “Water vapor microwave continuum absorption: A comparison of measurements and models,” Radio Sci., vol. 33, no. 4, pp. 919–928, Jul./Aug. 1998. [10] P. W. Rosenkranz, “Erratum: Water vapor microwave continuum absorption: A comparison of measurements and models,” Radio Sci., vol. 34, no. 4, p. 1025, Jul./Aug. 1999. [11] J. C. Liljegren, S.-A. Boukabara, K. Cady-Pereira, and S. A. Clough, “The effect of the half-width of the 22-GHz water vapor line on retrievals of temperature and water vapor profiles with a 12-channel microwave radiometer,” IEEE Trans. Geosci. Remote Sens., vol. 43, no. 5, pp. 1102– 1108, May 2005. [12] R. J. Hill, “Water vapor-absorption line shape comparison using the 22-GHz line: The Van Vleck–Weisskopf shape affirmed,” Radio Sci., vol. 21, no. 3, pp. 447–451, May/Jun. 1986. [13] E. R. Westwater, “Ground-based microwave remote sensing of meteorological variables,” in Atmospheric Remote Sensing by Microwave Radiometry, M. A. Janssen, Ed. New York: Wiley-Interscience, 1993, pp. 145–213. [14] N. Pierdicca, F. Rocca, P. Basili, S. Bonafoni, D. Cimini, P. Ciotti, R. Ferretti, W. Foster, F. S. Marzano, V. Mattioli, M. Montopoli, R. Notarpietro, S. Padmanabhan, D. Perissin, E. Pichelli, S. Reising, S. Sahoo, and G. Venuti, “Atmospheric water-vapour effects on spaceborne interferometric SAR imaging: Data synergy and comparison with ground-based measurements and meteorological model simulations at urban scale,” in Proc. EuCAP, Berlin, Germany, Mar. 23–27, 2009. [15] R. Lang, S. Casadio, A. N. Maurellis, and M. G. Lawrence, “Evaluation of the GOME water vapor climatology 1995–2002,” J. Geophys. Res., vol. 112, p. D17 110, 2007. DOI:10.1029/2006JD008246. [16] F. Rocca, “Modeling interferogram stacks,” IEEE Trans. Geosci. Remote Sens., vol. 45, no. 10, pp. 3289–3299, Oct. 2007.
Swaroop Sahoo received the B.Tech. degree in electrical engineering from the Biju Pattnaik University of Technology, Bhubaneswar, India, in 2005, and the M.S. degree in electrical and computer engineering from Colorado State University, Fort Collins, in 2011, where he is currently working toward the Ph.D. degree in electrical and computer engineering. His Master’s research focused on the retrieval of 3-D water vapor density with high vertical and horizontal resolution using a network of ground-based scanning radiometers. His graduate research advisor is Prof. Steven C. Reising.
Steven C. Reising (S’88–M’98–SM’04) received the B.S.E.E. (magna cum laude) and M.S.E.E. degrees in electrical engineering from Washington University in St. Louis, Saint Louis, MO, and the Ph.D. degree in electrical engineering from Stanford University, Stanford, CA, in 1998, where he was supported by a National Aeronautics and Space Administration (NASA) Earth Systems Science Fellowship and advised by Prof. Umran S. Inan. At Stanford, his research focused on low-frequency remote sensing of lightning and its energetic coupling to the ionosphere, which produces chemical changes and transient optical emissions. He is currently an Associate Professor of electrical and computer engineering with Colorado State University (CSU), Fort Collins. Shortly before joining the CSU faculty in 2004, he received tenure at the University of Massachusetts Amherst, Amherst, where he had been an Assistant Professor of electrical and computer engineering since 1998. During the summers of 1999, 2000, and 2003, he was a Summer Faculty Fellow in the Remote Sensing Division of the Naval Research Laboratory in Washington, DC. His research interests span a broad range of remote sensing disciplines, including passive microwave and millimeter-wave remote sensing of the oceans, atmosphere, and land; microwave circuits and radiometer systems; lidar systems for sensing of temperature and winds in the middle and upper atmosphere; and atmospheric electrodynamics. He has been the Principal Investigator of more than ten grants from the National Science Foundation (NSF), NASA, Office of Naval Research (ONR), National Polar-orbiting Operational Environmental Satellite System Integrated Program Office (subcontract through the Naval Research Laboratory), European Space Agency (subcontract through the Sapienza University of Rome), and Ball Aerospace and Technologies Corporation. Dr. Reising has served as the Vice President of Information Resources (2011–present) and the Vice President of Technical Activities (2008–2010) of the IEEE Geoscience and Remote Sensing Society (GRSS). He has served as an elected member of the IEEE GRSS Administrative Committee continuously since 2003, after three-year terms as Editor of the GRSS Newsletter (2000–2002) and Associate Editor for University Profiles (1998–2000). He has been an Associate Editor of the IEEE G EOSCIENCE AND R EMOTE S ENSING L ETTERS (GRSL) since its founding in 2004. He has been a Guest Editor of IEEE T RANSACTIONS ON G EOSCIENCE AND R EMOTE S ENSING for the International Geoscience and Remote Sensing Symposium (IGARSS) 2008 Special Issue published in November 2009 and the Special Issue on Microwave Radiometry and Remote Sensing Applications published in July 2007. He has served as a recent reviewer for IEEE T RANSACTIONS ON G EOSCIENCE AND R EMOTE S ENSING (TGRS), GRSL, the IEEE T RANSACTIONS ON M ICROWAVE T HEORY AND T ECHNIQUES, the Journal of Atmospheric and Oceanic Technology, the Journal of Geophysical Research—Oceans, Marine Geodesy, Atmospheric Chemistry and Physics, the Journal of Oceanography, and Radio Science. He was the recipient of the NSF CAREER Award (2003–2008) in the areas of physical and mesoscale dynamic meteorology and the ONR Young Investigator Program Award (2000–2003) for passive microwave remote sensing of the oceans. His Ph.D. student Sharmila Padmanabhan was the recipient of the Second Prize Student Paper Award at IGARSS 2003 in Toulouse, France, and the International Union of Radio Science (URSI) Young Scientist Award in New Delhi in 2005. Three of his undergraduate senior design students won two consecutive Best Paper Contests from the IEEE Denver Section and the IEEE Solid-State Circuits Society in 2007 and 2008. He was awarded the Barbara H. and Joseph I. Goldstein Outstanding Junior Faculty Award in 2004, the Lilly Teaching Fellowship for 2001–2002, and a Young Scientist Award at the URSI General Assembly in Toronto, Canada, in 1999. While at Stanford, he received first place in the United States National Committee (USNC)/URSI Student Paper Competition at the 1998 National Radio Science Meeting in Boulder, CO. In organizing scientific meetings, he was one of two Technical Program Cochairs of the IEEE IGARSS 2008 in Boston, with over 1700 attendees. He served as the
SAHOO et al.: HUMIDITY RETRIEVAL USING A NETWORK OF COMPACT MICROWAVE RADIOMETERS
General Chair of MicroRad’06, the 9th Specialist Meeting on Microwave Radiometry, held in March 2006 in San Juan, Puerto Rico, with 126 attendees from 15 countries. He was the Local Arrangements Chair for IGARSS 2006 in Denver, with over 1250 attendees. He has been an active participant in each IGARSS Technical Program Committee from 2001 up to the present. He serves the URSI as the Secretary and Chair-Elect (2009–2011) of its USNC, consisting of ten scientific commissions focusing on the theory and applications of electromagnetics and radio waves from ultralow frequencies to terahertz. Previously, he chaired its annual Student Paper Prize Competition at the National Radio Science Meeting in Boulder each year from 2004–2008 and at the URSI North American Radio Science Meeting in Ottawa in 2007. He chaired the first-ever URSI International Student Paper Prize Competition at the URSI General Assembly in Chicago in August 2008 and will chair the second one at the URSI General Assembly and Scientific Symposium in Istanbul in August 2011. In addition, he served as the Technical Program Cochair for both the 2010 and 2011 URSI National Radio Science Meetings in Boulder. He served as the Secretary of USNC-URSI Commission F (2006–2008) and is a member of URSI Commissions F, G, and H, the American Meteorological Society, the American Geophysical Union, Tau Beta Pi, and Eta Kappa Nu.
Sharmila Padmanabhan (S’01) received the B.Eng. degree in electronics and telecommunications engineering from the University of Mumbai, Mumbai, India, in 2001, the M.S. degree in electrical and computer engineering from the University of Massachusetts (UMass), Amherst, in 2004, and the Ph.D. degree in electrical and computer engineering from Colorado State University (CSU), Fort Collins, in 2009. She was advised by Prof. S. C. Reising, both at UMass and CSU. Her master’s research focused on design, testing, calibration, and data analysis for a K-band polarimetric radiometer at the Microwave Remote Sensing Laboratory, UMass. Her Ph.D. research focused on the development of algorithms for the tomographic imaging of tropospheric water vapor using a ground-based network of compact microwave radiometers as well as the design, development, characterization, and calibration of compact and low-cost microwave radiometers. She is currently a Member of the Technical Staff in the Microwave Remote Sensing Instruments section at the Jet Propulsion Laboratory, California Institute of Technology, Pasadena. Her research interests include millimeter- and submillimeter-wave instrumentation for remote sensing, calibration/validation and performance assessment of microwave radiometers, and geophysical retrieval algorithm development. Dr. Padmanabhan was the recipient of the Young Scientist Award at the International Union of Radio Science (URSI) General Assembly in New Delhi, India, in 2005. While at UMass, she was the recipient of the Second Place in the IEEE Geoscience and Remote Sensing Student Paper Competition at the 2003 International Geoscience and Remote Sensing Symposium (IGARSS 2003) in Toulouse, France. During the fall of 2006, she was an Advanced Study Program Graduate Visitor in the Earth Observing Laboratory of the National Center for Atmospheric Research, Boulder, CO. She was also a finalist in the IEEE Geoscience and Remote Sensing Student Paper Competition at IGARSS 2008 in Boston, MA.
Jothiram Vivekanandan (M’05–SM’10) received the B.E. degree in electronics and communications engineering from the Madurai-Kamaraj University, Madurai, India, the M.Tech. degree in microwave and radar engineering from the Indian Institute of Technology, Kharagpur, India, and the Ph.D. degree in electrical engineering from the Colorado State University, Fort Collins, in 1986. He holds a Senior Scientist appointment in both the Earth Observing Laboratory and the Research Applications Laboratory, National Center for Atmospheric Research (NCAR), Boulder, CO. He emphasized the interpretation of remote sensing instruments’ responses to clouds and precipitation using mathematical models and actual field observations. He led the development of the dual-wavelength system by adding millimeter-wave radar to NCAR’s S-band polarization radar (S-Pol). He is currently involved in building airborne cloud radar and provides scientific leadership to lidar remote sensing. He collaborates with a number of research groups toward the development of airborne and ground-based polarization and Doppler weather radar at centimeter wavelength. He is an Associate Editor of Radio Science.
3289
Flavio Iturbide-Sanchez (S’03–M’07) received the B.S.E.E degree in electronics engineering from the Autonomous Metropolitan University, Mexico City, Mexico, in 1999, the M.S.E.E. degree in electrical engineering from the Advanced Studies and Research Center of the National Polytechnic Institute, Mexico City, in 2001, and the Ph.D. degree from the University of Massachusetts, Amherst, in 2007, where he was advised by Prof. S. C. Reising and supported by the National Science Foundation. His Ph.D. research focused on the miniaturization, development, calibration, and performance assessment of low-cost and powerefficient microwave radiometers for remote sensing applications. From 2001 to 2005, he was a Research Assistant with the Microwave Remote Sensing Laboratory, University of Massachusetts, where he performed research on the design, development, and characterization of highly integrated multichip modules and microwave circuits for low-noise, low-power-consumption, highgain, and high-stability microwave radiometers. From 2005 to 2007, he was with the Microwave Systems Laboratory, Colorado State University, Fort Collins, focusing on the design, testing, deployment, and data analysis of the low-cost and power-efficient Compact Microwave Radiometer for Humidity profiling. Since 2008, he has been with the I. M. Systems Group, Inc., at the National Oceanic and Atmospheric Administration/National Environmental Satellite, Data, and Information Service/Center for Satellite Applications and Research, Camp Springs, MD. His research interests include communication systems; microwave radiometry; microwave/millimeter-wave integrated circuit (IC) design and packaging; RF ICs; system on a chip; active antennas; modeling, analysis, design, and measurement of microwave and millimeterwave circuits and systems; and atmospheric remote sensing, including retrieval algorithm development. Dr. Iturbide-Sanchez was the recipient of a First-Place Poster Award at the 11th Specialist Meeting on Microwave Radiometry and Remote Sensing Applications (MicroRad 2010) in Washington, DC. While a Ph.D. student, he was a finalist in two IEEE Student Paper Competitions, one at the International Geoscience and Remote Sensing Symposium in Anchorage, AK, in September 2004 and one at the International Microwave Symposium in San Francisco, CA, in June 2006. He was also awarded the Mexican National Council for Science and Technology (CONACYT) Graduate Fellowship from 1999 to 2004.
Nazzareno Pierdicca (M’04) received the Laurea (Doctorate) degree in electronic engineering (cum laude) from the University “La Sapienza” of Rome, Rome, Italy, in 1981. From 1978–1982, he was with the Italian Agency for Alternative Energy (ENEA). From 1982 to 1990, he was with Telespazio, Rome, in the Remote Sensing Division. In November 1990, he joined the Department of Electronic Engineering, Sapienza University of Rome. He is currently an Associate Professor and teaches remote sensing and electromagnetic fields at the Faculty of Engineering, Sapienza University of Rome. His research activity mainly concerns the interpretation of ground-penetrating radar data, electromagnetic scattering emission models for sea and bare soil surfaces, microwave radiometry of the atmosphere, synthetic aperture radar (SAR) applications to land cover discrimination, inversion of electromagnetic models for bare soil parameter retrieval, calibration of spaceborne radar altimeters, detection of urban changes from SAR interferometry, and global navigation satellite system reflectometry. Mr. Pierdicca is a member of the IEEE Geoscience and Remote Sensing Society (GRSS) and the Chairman of the GRSS Central Italy Chapter.
3290
IEEE TRANSACTIONS ON GEOSCIENCE AND REMOTE SENSING, VOL. 49, NO. 9, SEPTEMBER 2011
Emanuela Pichelli received the Laurea (cum laude) degree from the University of L’Aquila, Aquila, Italy, in 2007, with a dissertation on the aerosol impact on the atmospheric circulation in the urban area of Rome studied by the mesoscale model MM5. She is currently concluding her Ph.D degree at the University of L’Aquila on planetary boundary layer studies in urban areas. Since 2003, she has been with the Center of Excellence for Remote Sensing and Modeling of Severe Weather (CETEMPS), University of L’Aquila.
Domenico Cimini received the Laurea (cum laude) and Ph.D. degrees in physics from the University of L’Aquila, L’Aquila, Italy, in 1998 and 2002, respectively. From 2002 to 2004, he was with the Center of Excellence for Remote Sensing and Modeling of Severe Weather (CETEMPS), University of L’Aquila. From 2004 to 2005, he was a Visiting Fellow with the Cooperative Institute for Research in the Environmental Sciences, University of Colorado (CU), Boulder. From 2005 to 2006, he joined the Institute of Methodologies for the Environmental Analysis of the Italian National Research Council (IMAA-CNR), Potenza, Italy, working on groundand satellite-based observations of cloud properties. Since 2006, he has been an affiliate of the CU Center for Environmental Technology, Department of Electrical and Computer Engineering, where he served as Adjunct Professor in 2007. Dr. Cimini is currently with the Satellite Remote Sensing Division of IMAA/CNR. Dr. Cimini was a recipient of the Fondazione Ugo Bordoni Award 2008 in memory of Prof. Giovanni D’Auria.