Ticket Server Performance Evaluation Using a Hybrid Simulation Approach Cory Beard University of Missouri-Kansas City
[email protected] Keywords: Network management, ticket servers, performance. Abstract: A ticket server architecture was proposed in [1] and [2] to issue tickets to ensure access to communications resources in crisis situations. End users interact directly with servers using intelligent agents that use an agent communication language. Here a hybrid simulation approach is used to assess ticket server performance requirements and network administrative overhead. The negotiation interaction between users and servers is implemented in a prototype. Network and ticket server performance are modeled using prototype results combined with analytical techniques for networks of queues. For two scenarios to simulate a hurricane event and an office building bombing event, ticket server performance requirements, network overhead, and connection setup delays were not found to be prohibitive. INTRODUCTION Modern broadband networks are designed to integrate all types of multimedia traffic. More importantly, however, they are designed to integrate and support the activities of all types of users. As networks become more and more useful to society, new types of users and user applications emerge. One user type of particular interest is the National Security/Emergency Preparedness (NS/EP) user. For such a user, prioritized access to network resources is vital, especially in times of response to natural or man-made disasters. This is because network facilities are commonly damaged and network demand frequently exceeds available resources [3]. In [1], a ticket server architecture was proposed to manage priority network activities. This architecture is illustrated in Figure 1. Users interact directly with regionally distributed ticket servers to request importance tickets that can be presented to generic network manager agents along with priority requests for network resources. These ticket servers maintain a model of the dynamic crisis context of the network and issue tickets according to a user's identity, organization, and need in the current This work was partially supported by the Madison and Lila Self Graduate Fellowship at the University of Kansas
Victor Frost University of Kansas
[email protected] context. Ticket servers maintain this context model through coordination with local, regional, and national disaster control centers. This architecture supplements Internet Engineering Task Force (IETF) work on policy frameworks and directory enabled networks [4, 5] by providing a dynamically adaptive mechanism for prioritizing user traffic. In addition to these dynamic models of the network context, this architecture also provides users with great flexibility in negotiating for importance tickets. Users are able to request tickets directly, find out why tickets were not granted, update information, provide authentication resources to verify information they have provided, and even request that the server reconsider its view of the current context to match the user's view of that context. It is of great benefit to users, especially in tense conditions caused by a crisis, to have these capabilities. Intelligent agent technology and agent communication languages (e.g., the Knowledge Query and Manipulation Language, KQML [6]) are used to provide automated mechanisms that facilitate this interaction for the user. Several important performance issues must be considered with such an architecture. Interaction with ticket servers should not cause prohibitively long connection setup times, ticket server performance requirements must be reasonable, and excessive amounts of network overhead traffic must not be generated. This paper will show that these issues are not significant enough to prevent a successful implementation of the architecture, especially in light of the benefits such an architecture would provide. A quantitative performance analysis of this architecture was conducted using a useful approach that combined system prototyping and analytical network Network Manager Agent
End User
Importance Ticket Servers
Network Manager Agent
Local, Regional, and National Disaster Control Centers
End User
Authentication Resources
Figure 1. Connection Importance Administration Architecture
Profile Generator
sy Deny Request Importance Ticket Server
KQML Communication Recognizer st User Negotiator
si
sd
Information
Decider
sv Verifier
sm Modeler
sg KQML Communication
Negotiator
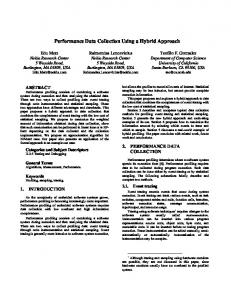
Figure 2. Prototype System Components queueing analysis. This methodology was then used to simulate a hurricane event and an office building bombing event similar to the Alfred P. Murrah Federal Building Bombing in Oklahoma City in 1995 [7]. SYSTEM PROTOTYPE DESIGN Since users interact and negotiate with ticket servers using intelligent agents and an agent communication language, the first objective of this research was to create a system prototype to imitate these interactions. User and ticket server processes were created using Java Agent Template, Lite (JATLite) [8] that provides extensions to the Java programming language to support agent communication using KQML [6]. To provide intelligent agent capabilities, the Java Expert System Shell (JESS) [9] was used. This provided a rule-based expert system shell for user agents to generate requests for tickets and respond to responses to those requests. JESS was also used for server processes to respond to requests for tickets based on the current dynamic context and respond to user requests to renegotiate tickets. Ticket server processes also implemented rudimentary mechanisms for guarding against harmful user behaviors. One example was a mechanism for ending a negotiation session once it was unlikely that a user's further interaction would significantly improve a ticket. If not controlled, such user behavior could generate excessive unnecessary load on ticket servers. The purpose of the prototype was to characterize the negotiation process for a particular profile. A profile was defined as the interaction of a user with a ticket server in a certain context. A series of profiles could then be combined into a scenario to observe the negotiation process timeline as context changed. Figure 2 shows the overall design of the user and server processes for the prototype. The user process consisted of the User Negotiator that performed the
negotiation activity for the user and generated KQML communication. A profile generator was used to start a particular negotiation session for a particular profile. The Importance Ticket Server process was modeled as a combination of six modules. Each module performed a distinct function and could process a certain number of requests per second. By explicitly identifying each of these modules, we were able to assess the performance of each module as a queueing system. In the next section, we show how these modules were combined to find the performance of the server as a whole. The black triangles shown at each module were used to assess the load on each module by recording the total number of requests per negotiation session that entered each module. These total numbers of requests were stored in variables st, sy, si , sd, sv, sm, and sg respectively. A brief description of each module in the ticket server is as follows. • Recognizer – Takes a user message and retrieves a session record about an ongoing ticket server session for that user. • Information Module – Processes messages where users request information to be stored in their session record or ask about the information in their record. • Decider – An expert system that makes the decision about the value of a ticket to issue based on the context status maintained by the Modeler. • Verifier – Verifies information provided by the user by contacting references given by the user or checking the validity of verification information provided directly by the user. • Modeler – Models the dynamic context in which the network is operating. This model can be updated manually by human experts, automatically in coordination with disaster control centers, or in response to information provided by a user. For the purpose of the prototype, it was assumed that the context was predefined in the profile for a particular negotiation session. • Negotiator – Once a request has been processed, the Negotiator decides how a subsequent request for this session should be handled. It may decide to end the session or allow the session to continue. PERFORMANCE ANALYSIS APPROACH Once the total number of messages per session that enter each module for a particular profile are recorded, a queueing network model can be used determine the overall performance of the server in the presence of many requests from different types of users. When combined with the arrival process of requests for new sessions from particular profiles, the overall arrival rate to each module can be
Information
γ Recognizer
Decider
Negotiator Leave Server
Verifier Context Modeler
Leave Server
Deny Request
Figure 3. Queueing Network Model determined. It was assumed that requests for tickets arrived to ticket servers at the Recognizer according to a Markov process of rate γ. An M/M/1 queue was then used to model each module. A more accurate characterization of each module might have been to assume deterministic service times (i.e., M/D/1), since no appreciable difference existed in the way a message was handled between different users or messages. It is difficult, however, to characterize a network with deterministic service times. An M/M/1 system, can be analyzed, however, and M/M/1 delays are greater than M/D/1 delays. Figure 3 shows the model of the queueing network that was used. When a request first arrived to the server, it was routed to the Recognizer. The Recognizer created a new session record for the current request and then routed the request to a subsequent module based on the nature of the user's request. If the server had established that this type of request should not be considered, the message was routed to the Deny Request module. If not sent to the Deny Request module, the message was processed by the appropriate module and then sent to the Negotiator. The Negotiator then decided how a future request for this session should be treated. After having a message processed at either the Negotiator or Deny Request modules, the user was notified of the result of the current request, given a ticket if appropriate, and then was given a chance to respond. The user could choose to end the session, which is signified by the "Leave Server" routes out of the Negotiator and Deny Request modules in Figure 3. The expected total delay from an initial arrival into the Recognizer until taking one of the "Leave Server" paths, therefore, signified the total setup delay that was incurred by the user from seeking a ticket from the server. Note that this only computed delay from interacting with the server; computing overall setup
delay should consider message propagation delays and other delays in the setup process. If the user chose to respond to the server by making another request, this is signified by the feedback loops in Figure 3. The next message from the user was then handled by the Recognizer. If the Negotiator previously decided to not allow the session to continue, the request was sent to the Deny Request module. The Deny Request module then sent a message to the user indicating that the session had been terminated. Users could continue to make requests, as signified by the feedback loop from the Deny Request module, but requests would always be denied. At the point the user chose to cease making these requests, the "Leave Server" path from the Deny Request module was taken and total delay could be computed. Total delay was computed as follows. Given an arrival rate for requests for new sessions, γ, the total number of requests per negotiation session that entered each module could be used to determine routing between queues. These total numbers of requests per session were given in variables st, sy, si , sd, sv, sm, and sg respectively. For example, assume a particular profile generated five messages to the ticket server, so that st=5. The user ends the session after being notified by the Deny Request module that the session had been terminated. Two messages were sent to the Information module (si =2), and one apiece were sent to the Decider, Verifier, and Deny Request modules (sy=sd=sv=1). Routing probabilities out of the Recognizer, therefore, are 2/5 to the Information module, 1/5 to the Decider, Verifier, and Deny Request modules, and 0 to the Context Modeler module. Routing out of the Negotiator flows back to the Recognizer with probability one (since the user never chooses to end the session from a message from the Negotiator). Routing out of the Deny Request module follows the "Leave Server" path with probability one (i.e., the only time a message is processed by the Deny Request module, the result is a "Leave Server" response). Note that it is assumed that the queueing network behaves as if it were using probabilistic routing. Even though the route a particular profile will take through the network is deterministic, it can be viewed as probabilistic routing when looking at the aggregate of a class of users. Figure 4 shows the queueing network when it supports two types of profiles simultaneously. As a message leaves the Recognizer it is first routed depending its profile. The overall expected delay through the server for the completion of a full negotiation session is Dserver. Using the given formulation of routing probabilities through the network of queues, it is shown in [2] that for a given profile
Dserver = si Di + sd Dd + sv Dv + sm Dm + s g Dg + st Dc + s y D y .
(1) Profile 1
It is computed as a simple sum of the total number of messages into a module per session (e.g., si is for the information module) times the expected delay through each module (e.g., Di is for the information module). The delay through module k is computed as Dk =
1 1 = , µ k − λk µ k − sk γ
(2)
the result for expected delay in an M/M/1 queue. The expected arrival rate into the M/M/1 queue, λk, is the expected session arrival rate, γ, times the number of messages to that queue in a session, sk. The total number of messages that are sent between the user and server is st. By denoting the delay for security processing (i.e., encryption, authorization, etc.) as Dsec and the network message transfer delay in each direction as Dnet, the total delay for interaction with the server is Dtotal = Dserver + 2 st ( Dsec + Dnet ) .
(3)
When considering multiple profiles simultaneously present in the server, as in Figure 4, Dserver for class r is defined as Dr ,server = sir Di + sdr Dd + svr Dv + smr Dm + s gr Dg + str Dc + s yr D y ,
(4)
where, for example, sir is the total number of messages to the Information module per session for profile r. The delay for module k is computed as Dk =
1 = µ k − λk
1 R
.
(5)
µ k − ∑ s kr γ r r =1
where γr is the session arrival rate for profile r. Total delay is the same as in (3). HURRICANE SCENARIO Two scenarios were designed to assess the performance and feasibility of the ticket server architecture for a major disaster. The first was intended to model a hurricane where disaster efforts were spread over a broad geographic area and communication capacity was reduced from damage to the communications infrastructure. The second was meant to consider a bombing to an office
Information Decider Negotiator
γ1 γ2 Recognizer
Profile 2
Leave Server Verifier Modeler
Leave Server
Deny Request
Figure 4. Queueing Network Model With Two Profiles building where damage was localized and network traffic was concentrated. Before addressing the specifics of each scenario, it is important to consider the conditions the scenarios were intended to reproduce. The basic thesis of this research is that the public network would be a useful resource in disaster recovery if access to resources were based on context sensitive priorities. The scenarios therefore concentrated exclusively on the use of public network resources. In this context, disaster response can involve some or all of the following considerations. • Geographic distribution – The impact of a disaster can be spread over a wide geographic area. • Communication system damage – Disasters may cause a reduction in available public network resources for some or all of the time of disaster response. • Communications trunks– The focus here will be on major trunks that carry large amounts of traffic. • Overloading – Even if capacity were not degraded, the load on a communication system typically increases dramatically in disaster. This load consists of load from disaster management personnel and from people affected by the disaster. A major increase in load is also typically generated from users outside the disaster area who are seeking to contact users in the area to find out if they were affected [10]. • New users – Many new users may be introduced into the disaster area who are search and rescue, assessment, medical, or economic relief experts. New users would have to take extra steps in the negotiation process with ticket servers to verify their identity. Existing users are assumed to have already established their identity.
Washington, D.C.
Table 2. Table Of User Classes For The Hurricane Scenario Class #
Colum bia
Flor ence
Tic ket Serve r
Charleston #1 Charleston #2
Beauport
Figure 5. Network For Hurricane Scenario
1 2 3 4 5 6 7 8
•
Disaster response phases – Disaster recovery can occur in several distinct phases. • User types – For some types of users, their importance as recognized by ticket servers will not change. It is expected, however, that for many users the importance levels will change related to the dynamic context of the disaster. • Length of disaster – The focus here was on the first 72 hours after an event. Communications load typically returns close to normal levels after this period [11]. Also, mortality rates increase dramatically after 72 hours [12], so the focus here was to make best use of communications resources before 72 hours had expired. The factors above determined the types of users, how they interacted with ticket servers, and the loads on network links. Performance analysis was also affected by the methods by which users interacted with ticket servers. The first scenario replicated conditions that occur during a hurricane disaster. Figure 5 illustrates the example communications network that was considered. The cities are some of those in South Carolina that were affected by Hurricane Hugo in September of 1989 [13, 14]. Table 1. Table Of The Dynamic Context For The Hurricane Scenario Stage
Hour
1
0-24
2 3
25-48 49-72
4
73-96
Context Hurricane Preparation and Occurrence Search and Rescue Medical Relief Basic Needs Provisioning (Food and Housing)
9
10
Ticket Value Per Stage
Description
E-911 Police/Fire State Disaster Managers FEMA Managers Search and Rescue Medical Needs Provisioning Media General public in disaster area – nonemergency communications General public from outside disaster area
1
2
3
4
5 4
5 4
5 4
5 4
4
4
3
3
3 5 2 2 3
4 5 4 2 4
3 4 4 3 3
2 4 3 4 3
1
1
1
1
0
0
0
0
Each line signifies a direct high capacity broadband link. Charleston was assumed to have two major nodes with a link in between. Servers were directly associated with links and tickets had to be obtained separately for each link on a path. This is not the best way to administer tickets, but does represent the worst case from a performance standpoint. Here it was assumed that a ticket server was located at the Charleston#1 node to issue tickets for the ColumbiaCharleston#1, Charleston#1-Charleston#2, and Charleston#2-Beauport links. The main landfall of the hurricane was assumed to occur near Charleston. Columbia was the location from which state disaster management personnel were organized. Table 1 shows the time line for the scenario that defined the dynamic context at hourly increments based on the phases of disaster response. The context signifies the highest priority activity that was occurring, even though other activities would also be occurring. The Charleston#2-Beauport link was assumed to be heavily affected by the disaster. It was assumed that a 50% loss of capacity was experienced for several hours, as actually happened from a downed microwave tower for Hurricane Hugo [13]. The Charleston#1-Charles-ton#2 link was somewhat degraded (20% loss of capacity), and the other link experienced no loss of capacity. Table 2 shows user classes for the scenario, along with the ticket value issued to each class in each stage from
Load (Arrival Rate * BW)
Load per Class for Hurricane Scenario 300 300 E-911 200 200 Police/Fire 100 100 0 0 50 100 0 50 300 0 500 Disaster Managers FEMA Managers (Hours) Time (Hours) 200 StateTime 100 0 0 0 50 100 0 50 500 Search and Rescue 500 Medical Time (Hours) Time (Hours)
100
0 0 50 500 NeedsTime Provisioning (Hours)
100
100
0 50 100 15000 0 public in area Time (Hours) 10000 General 5000 0 0 50 100 Time (Hours)
0
0 50 500 MediaTime (Hours)
100
0 50 Time (Hours)
Figure 6. Class Loads For Hurricane Scenario
Columbia-Charleston#1
Ratio of Load to Available Capacity
2 1 0 0
20
40
60
80
60
80
40 60 Time (Hours)
80
Charleston#1-Charleston#2
5
0 0
20
40
Charleston#2-Beauport
10 5 0
0
20
Figure 7 - Overloads Per Link For Hurricane Scenario Load pe r Tic ke t S e rve r Module 100 Informa tion Module
100 Rec ognize r 50
50
0
0 0
50
100
50 Dec ider
0
0
0
50
100
50 Time (Hours )
100
0.5 Verifier
50
100
50 Time (Hours )
100
100 Negotiator
0
0
50 0
0
Figure 8. Loads Per Ticket Server Module capacity.
0 0 50 100 5000 General public outside Time (Hours) 0
Load Versus Capacity During Disaster Response
Load (Re ques ts pe r S e cond)
Table 1. Figure 6 shows the ticket server session arrival rates generated by each class at each hourly interval. The loads for each of the classes reflected the time dynamics of the disaster effort for different users. Their communication traffic peaked during the stages of the disaster where their services were needed most. These load curves were not created from actual network load traces, but closely replicated typical disaster conditions as described in the literature. The traffic patterns for those in state and federal disaster management roles reflected the time dynamics of response, assessment, and coordination of people and resources to respond to the disaster. Further details on the scenario are provided in [2]. Figures 7, 8, 9, and 10 show the results using the performance analysis approach from Sections II and III. Figure 7 shows that two of the links experienced significant load demand above available capacity. Figure 8 shows the number of requests per second that were sent to each module (it was assumed for the scenario that no requests were sent to the Modeler). To have reasonable delays, all modules had to be able to process more requests per second than their peak load. The requirements on the Decider module appeared to be the most stringent. Even though it needed to process fewer messages per second than other modules, its function was also more complex. After choosing a set of module processing rates that were greater than these peak loads, Figure 9 was created that shows the classes with the highest peak delays for their interaction during a session with the ticket server. The worst case delay was 9.1 seconds. A delay less than 10 seconds is reasonable, especially if users are given the expectation ahead of time that they may have to wait up to 10 seconds. Finally, Figure 10 shows the percentage of the capacity of each link that was occupied by ticket server overhead traffic. Overhead levels never exceeded 1.5% of
100
OFFICE BUILDING BOMBING SCENARIO A second type of scenario was designed to consider a bombing to an office building where damage was localized and network traffic was concentrated into that localized area. Recent events similar to this in the United States were the Alfred P. Murrah Federal Building Bombing [7] in Oklahoma City and the World Trade Center Bombing in New York City. In these events, the damage occurred in an isolated area and the destruction was man-made. Many aspects of this scenario were similar to the hurricane scenario. Significant differences existed, however, because higher security was required (because of the continued human threat), the general public was not as immediately aware of the situation, the communication system was not
E xtra Connection S etup Dela y from Ticket S erve r Negotia tion
Washington, D.C.
E xtra Connection S etup Dela y (S econds )
15 Needs P roviders - New Us ers General P ublic Outs ide Dis as ter Area FE MA Managers - Ne w Us e rs Media, Medica l, a nd S &R - New Us ers S tate Managers - Exis ting Us ers 10
Oklahoma City #1 Oklahoma City #2 Bomb Site
5
Ticket Server
0 0
20
40 60 Time (Hours )
80
Oklahoma City #3
Figure 11. Network For Office Building Scenario
Figure 9. User Subclasses With Longest Delays For Hurricane Scenario Columbia-Charles ton#1 Charles ton#1-Charles ton#2 Charles ton#2-Beauport
Load (Arrival Rate * BW)
P ercent of Capacity Us ed by Ticket S erver Traffic
Impact of Ticket S erver Overhead Traffic 2
1.5
1
0.5
0 0
20
40 60 Time (Hours )
80
100
Figure 10. Network Overhead For Ticket Server Traffic In Hurricane Scenario damaged on a widespread scale, and communication was concentrated into a small area. Figure 11 shows the example communications network that was considered, based on the Oklahoma City Bombing event. The same types of users were involved, but with a different time line and network loading pattern were assumed as shown in Figure 12. Once again, these load curves were not created from actual network load traces, but were derived from the detailed report on the Oklahoma City Bombing [7]. In the hurricane scenario, load grew somewhat gradually in anticipation of the event. In this case, load jumped suddenly. Figures 13 and 14 are the similar to Figures 9 and 10. Figure 13 shows that in this case, the user class with the highest peak delay had a delay of 3.5 seconds. Figure 14 shows that network overhead peaked at 0.45% of capacity.
Load per Cla ssfor Hurrican e Sc enario 150 300 100 E-911 200 P olice/Fire 50 100 0 0 50 100 50 300 0 300 0 Dis as(Hours ter Managers Managers ) Time (Hours ) 200 S tateTime 200 FE MA 100 100 0 0 0 50 100 0 50 500 S earch and Res cue 500 Medical Time (Hours ) Time (Hours )
100
0 0 50 500 S ecurity/FBI Time (Hours )
100
100
0 0 50 500 MediaTime (Hours )
100
0 0 50 100 15000 0 50 100 15000 0 public in )area public outs Time (Hours Time (Hours ) ide 10000 Ge neral 10000 Ge neral 5000 5000 0 0 0 50 100 0 50 100 Time (Hours ) Time (Hours )
Figure 12. Class Loads For Office Building Scenario
Although results for both of these scenarios were not based on actual network traces, the results can be treated as a reliable assessment of the viability of ticket servers for three reasons. 1. The results are upper bounds on the actual performance that would occur. Tickets were assumed to be issued individually for every link in a connection. 2. Link loading was consistent with typical disaster response conditions. Loading on links at full capacity can reach up to five times normal levels after an event [15]. If link capacity is degraded, load levels would be even higher. 3. The time line of each scenario closely replicated that of typical disaster response conditions.
Extra Connection S etup Delay from Ticket S erver Negotiation Extra Connection S etup Delay (S econds )
6 S &R, Medical, S ecurity, and Media - New Us ers FEMA Managers - New Us ers S tate Managers - Exis ting Us ers General P ublic Ins ide and Outs ide Dis as ter Area
5
4
3
2
1
0 0
20
40 60 Time (Hours )
80
Figure 13. User Subclasses With Longest Delays For Office Building Scenario
Ultimately, these results are useful in two ways. First of all, a useful approach was applied to a problem that involved negotiation and intelligent agents. Discrete event simulation need not be performed to simulate message traffic. Performance metrics can be obtained by a combination of system prototyping and analysis of networks of queues, by looking at arrivals on a session basis instead of on a per message basis. Finally and most importantly, however, this simulation study showed that ticket servers could be effectively implemented. Server processing require-ments, connection setup delays, and network overhead levels were not prohibitive. By implementing such an architecture, broadband networks can be used to more effectively meet the needs of society in response to disaster conditions. REFERENCES
P erce nt of Capa city Us ed by Ticket Serv er Tr affi c
Impac t of Tic ket S erver Ove rhea d Traffic 0.5
[ 1]
DC-OkCity#1 OkCity#1-OkCity#2 OkCity#1-OkCity#3
0.4
[ 2] 0.3
[ 3]
0.2
[ 4]
0.1
[ 5]
0 0
20
40 60 Time (Hours )
80
100
Figure 14. Network Overhead For Ticket Server Traffic For Office Building Scenario CONCLUSION The purpose of this paper was to assess the viability of implementing an architecture of ticket servers for issuing tickets to requests for important connections. Instead of using a full discrete event simulation approach, a hybrid prototype/analysis approach was used. A prototype was developed to create user and server intelligent agent processes to carry out negotiation sessions for tickets. Simulation of the prototype consisted of observing the total number of requests per session that were sent to each ticket server module for particular profiles. To find performance results for server processing requirements, negotiation session delays, and network overhead, analytical M/M/1 queueing network results were used to combine the outputs from the prototype with a disaster network loading timeline.
[ 6]
[ 7]
[ 8] [ 9] [10]
[11]
[12]
[13]
[14]
[15]
C. Beard and V. Frost, “Dynamic Agent-Based Prioritized Connection Admission for Stressed Networks,” 1999 IEEE International Conference on Communications, Vancouver, British Columbia, June 1999. C. Beard, "Dynamic Agent-Based Prioritized Resource Allocation for Stressed Networks," Ph.D. Dissertation, August 1999. Computer Science and Telecommunications Board, National Research Council, Computing and Communications in the Extreme: Research for Crisis Management and Other Applications, 1996. R. Rajan, et. al., "A Policy Framework for Integrated and Differentiated Services in the Internet," IEEE Network, September 1999. R. Yavatkar D. Pendarakis, and R. Guerin, "A Framework for Policybased Admission Control," RFC 2753, Internet Engineering Task Force, January 2000. The DARPA Knowledge Sharing Initiative External Interfaces Working Group, “DRAFT Specification of the KQML AgentCommunication Language, plus example agent policies and architectures,” June, 1993. The City of Oklahoma City, Alfred P. Murrah Federal Building Bombing: Final Report, Fire Protection Publications: Stillwater, Oklahoma, 1996. http://java.stanford.edu. http://herzberg1.ca.sandia.gov/jess. Clinton Administration, “The Effect of the National Information Infrastructure (NII) on Local, State, and Federal Emergency Management,” September 7, 1994. Network Reliability Council, Focus Group 5, “Network Reliability -The Path Forward: Telecommuting as a Back-Up In Emergencies”, February 1996, Section 5. Federal Emergency Management Agency, Federal Response Plan, Emergency Support Function #9 – Urban Search and Rescue Annex , April 1999. C. Wilson and A. Lindstrom, “Survival of the network: The single greatest disaster in U.S. history couldn’t take down telephone service,” Telephony, October 23, 1989. J. S. Griswold, T. L. Lightle, and J. G. Lovelady, “Hurricane Hugo: Effect on State Government Communications,” IEEE Communications Magazine, June, 1990, pp. 12-17. Adamson and S. Gordon, "Analysis of Two Trunk Congestion Relief Schemes," Proceedings of IEEE MILCOM '93, pp. 902-906, 1993.