564
IEEE TRANSACTIONS ON TERAHERTZ SCIENCE AND TECHNOLOGY, VOL. 5, NO. 4, JULY 2015
Time Resolved Dynamic Measurements at THz Frequencies Using a Rotary Optical Delay Line Hichem Guerboukha, Andrey Markov, Hang Qu, and Maksim Skorobogatiy
Abstract—Fabrication, characterization, and applications of a fast rotary linear optical delay line (FRLODL) for THz time-domain spectroscopy are presented. The FRLODL features two reflective surfaces with spatially separated incoming and outgoing beams. It has been manufactured using CNC machining. A linear dependence of the optical delay on the rotation angle allows a straightforward extraction of the conversion factor between the acquisition time (in ms) and the terahertz pulse time (in ps). We also discuss the accuracy of the rotary delay line detailing the possible sources of imprecision. The FRLODL has been tested using rotation speeds of up to 48 Hz, corresponding to an acquisition rate of up to 192 Hz with four blades incorporated on the same disk. At high speeds we observe a decrease of the bandwidth due to the limitations of the electronics, in particular, the transimpedance amplifier. An error analysis is performed by experimentally evaluating the signal-to-noise ratio and the dynamic range. With regard to the applications of the FRLODL, we first present observation of the evaporation of liquids, namely water, acetone and methanol. We then demonstrate monitoring of the spray painting process. Finally, detection of fast moving objects at 1 m/s and their thickness characterization are presented. Index Terms—Delay lines, numerical modeling, optical design, optical mirrors, spectroscopy, terahertz (THz), time-domain analysis.
I. INTRODUCTION
F
OR SEVERAL decades, THz spectroscopy and imaging have been used in many different applications [1]. Due to the relatively low loss of most dry materials in the THz spectral range, and due to the strong sensitivity of material losses to humidity, there has been a growing interest in using THz waves in non-destructive imaging and process control. Various industrial applications of THz spectroscopy are currently under investigation. In particular, for use in detection of inorganic inclusions in food products, detection of dangerous chemicals disguised by packaging, detection of defects in packaged electronic chips, as well as monitoring of water content in paper and textile fabrication lines. However, many challenges still remain in commercialization of THz spectroscopy. One of these difficulties lies in the limited scanning speed of a THz system. For rapid terahertz imaging and real-time process Manuscript received December 28, 2014; revised April 17, 2015; accepted May 19, 2015. Date of publication June 22, 2015; date of current version July 16, 2015. This work was supported by Fonds de Recherche du Québec en Nature et Technologie (FRQNT) and by the Natural Sciences and Engineering Research Council of Canada (NSERC). The authors are with the Genie Physique, Ecole Polytechnique de Montreal, Montreal, QC H3C 3A7, Canada (e-mail:
[email protected]). Color versions of one or more of the figures in this paper are available online at http://ieeexplore.ieee.org. Digital Object Identifier 10.1109/TTHZ.2015.2441701
monitoring, a high scanning rate optical delay line is required for efficient sampling of the terahertz pulses. In a typical THz time-domain spectroscopy system, the THz pulse is sampled in time by means of delay lines based on linear micropositioning stages with mounted retroreflectors. The popularity of this solution is related to reliability of the micropositioning technology and its relatively low price. Moreover, optical delay produced by such delay lines depends linearly on the stage displacement, which greatly simplifies encoding and readout of the optical delay value of a micrometer linear delay line. While this method permits high precision of the pulse reconstruction, it is time-consuming, as a single scan takes typically several seconds. To solve the low acquisition rate problem, several approaches have been explored [2]–[18]. Galvanometer based delay lines were presented over 20 years ago for high speed scanning of THz pulses [2]. In the aforementioned system, the optical beam is reflected by a mirror mounted on a galvanometer vibrating device oscillating with a fixed amplitude and frequency. This system was capable of achieving an optical delay of 300 ps with a scanning rate of 30 Hz. However, the position and velocity of the mirror in this setup changes sinusoidally; consequently, the optical delay does not change linearly in time. As of recently, rotating prisms in the optical [3]–[5] or in the THz [6] beam path have been suggested. In that case, the delay is modified by the optical path inside a rotating prism made of a higher refractive index material. In this arrangement, the reflected beam follows the same path as the incident beam, thereby requiring separation of the two at the output of the delay line. Scanning rates as high as 380 Hz were demonstrated with optical delay in 100 s of ps. Placing the cube on the air turbine can further improve the scanning speed by almost an order of magnitude. Introducing a rapidly rotating prism in the THz beam path [6] instead of the conventional optical path is beneficial in terms of its decreased sensitivity to fabrication imperfections due to much longer THz wavelengths as compared to the laser wavelength. However, these systems generate an optical delay that is strongly nonlinear with respect to the rotation angle, leading to complex time-consuming calibration on raw data. Furthermore, when using larger prisms, the group velocity dispersion of the prism material can become important leading to a pulse broadening and attenuation of both THz and optical beams. Asynchronous optical sampling has also been used for THz [7]. In these systems, probe and source pulses are provided by two mode-locked femtosecond lasers with slightly different frequencies. A repetition rate of several kHz can be obtained using this technique. However, the use of two femtosecond lasers is expensive and requires precise adjustment that may affect the stability of the recorded THz pulse.
2156-342X © 2015 IEEE. Personal use is permitted, but republication/redistribution requires IEEE permission. See http://www.ieee.org/publications_standards/publications/rights/index.html for more information.
GUERBOUKHA et al.: DYNAMIC MEASUREMENTS AT THZ FREQUENCIES USING A ROTARY OPTICAL DELAY LINE
565
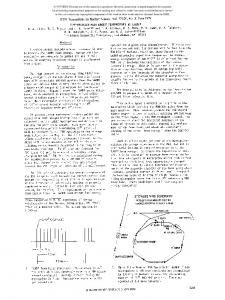
Fig. 1. (a) Schematic of an individual rotating blade consisting of two curvilinear reflectors [17]. (b) Time delay of the FRLODL; (c) Optical setup of the FRLODL in Zemax.
We also note that fast optical delay lines are required in other research fields, for example, in optical coherence tomography (OCT). In those systems, multiple-pass cavity delay lines [8], [9] and combinations of a curved or a straight mirror and a scanning mirror [10], [11] were suggested. Nevertheless, they feature small optical delays ( 20 ps), which are suitable for OCT applications, but not for THz time-domain spectroscopy. In THz, large optical delays increase the spectral resolution. In addition, longer optical delays allow proper sampling of high refractive index and/or dispersive materials. To date, several solutions based on rotating mirrors and curvilinear surfaces were demonstrated for THz applications [12]–[16]. Such designs feature linear dependence of the optical delay on the rotation angle, as well as large maximum delay and high scanning rates. When using rotary delay lines that feature linear dependence of the optical delay on the reflector rotation angle, one can, in principle, forgo complex optical encoders if the rotation rate is precisely controlled. By placing several reflectors on the same rotating base, one can increase the acquisition speed by an order of magnitude. Scanning rates of 400 Hz and the total delay of 140 ps have been demonstrated when using six reflectors, all fitting into an 8 cm diameter circle [16]. Recently, we presented several classes of analytical and semianalytical solutions for the design of fast rotary linear optical delay lines (FRLODL) [17], [18]. The optical delay provided by such systems is proportional to the reflector size. When using relatively small systems that fit into a 10 cm diameter circle, an optical delay in excess of 600 ps can be achieved, which is comparable to the optical delay generated by a typical linear micropositioning stage with a retroreflector. The rotary delay lines require careful design of the shapes of their reflector surfaces. In particular, we require the resultant optical delay to be linear and long enough for THz applications (at least 100 ps). Also, at the input and output of the FRLODL, the optical beams must stay spatially invariant and separated during the reflector rotation. The latter enables to forgo the use of beamsplitters to separate the incoming and the outgoing beams, thus reducing the loss of the laser power. The main goal of this work is to understand the engineering challenges arising during the experimental implementation of a rotary delay line. We first discuss the accuracy of the FRLODL, detailing the possible sources of imperfection. We consider both errors occurring due to a finite size of the laser beam (as opposed to an optical ray) and the precision with which the blade rotation
frequency can be maintained, as well as the errors coming from the limited accuracy of CNC machining. Then, the experimental implementation of the FRLODL is presented. We demonstrate characterization of the rotary delay line, confirm its linearity, and compare the system's response at different rotation speeds. Finally, we present examples of practical applications for the FRLODL: evaporation of liquids, monitoring of spray painting, and detection of fast moving objects. II. CHARACTERIZATION OF THE FRLODL The operating principle of the FRLODL has been introduced in details in our previous papers [17], [18]. The FRLODL consists of four blades, and an individual blade is composed of two curvilinear reflectors. In Fig. 1(a), we show the working principle of an individual blade. We assume that the incoming light beam is arriving parallel to OZ and that it is displaced by along the OY direction. The incoming beam is reflected by the first rotating reflector at the point onto the second rotating reflector at the point , where is the angle between the OY axis and OZ axis. Finally, the beam is sent out of the delay line system along a line parallel to the OZ axis. Note that, regardless of the rotation angle, the outgoing beam is a constant always follows the fixed path; in other words, value. Moreover, another important property of the FRLODL is that the optical delay provided by such a rotating blade is a linear function of the rotating angle. In [17], we have shown that a blade with two curvilinear reflectors could be designed by numerically solving a first-order differential equation. Similarly, we have also demonstrated that once the incoming beam position is specified, only a unique solution of the curvilinear reflectors can be numerically obtained. Note that the maximum optical delay of the FRLODL system is dependent on the value of . In that paper, we specified cm in order to maximize the optical delay of the system that fits into a 10 cm diameter circle. The corresponding optical delay as a function of the rotation angle is numerically calculated [see Fig. 1(b)] To elucidate the working principle of the FRLODL, we perform a simulation based on the commercial optical design software Zemax. In Fig. 1(c), we show the Zemax schematic of the whole delay line system. As a light source, we use a collimated Gaussian beam with a waist radius of 0.5 mm. For an incoming beam with a finite size, the curvilinear reflectors of the disk have a “lens” effect on the beam and, thus defocus the incoming beam in the OY direction. To minimize this effect, we place the FRLODL between two cylindrical lens (focal length: 100 mm)
566
IEEE TRANSACTIONS ON TERAHERTZ SCIENCE AND TECHNOLOGY, VOL. 5, NO. 4, JULY 2015
Fig. 2. (a)–(d) Outgoing beam captured by the detector screen at the rotation angle of 5 , 10, 20 , 30 . The rotation angle is defined in Fig. 1(a). Particularly, when the rotation angle is 5 , the incoming beam is cut by the edge of the curvilinear reflector, thus resulting in an incomplete reflection. (e) RMS radius of the outgoing beam at different rotation angles. (f) Centroid position of the outgoing beam in OZ and OY directions on the detector screen as a function of the rotation angle.
in order to collimate the outgoing beam. Finally, the outgoing beam is focused by another spherical lens (focal length: 60 mm) to a virtual detector which interrogates the spatial position and intensity distribution of the outgoing beam. In our simulation, we trace 20000 rays. Note that, in this Zemax simulation, the optical setup follows the emitter arm of the experimental setup delay line closely, as demonstrated in the following section. In our Zemax simulation, we also set cm, and subsequently interrogate changes in position and radius of the outgoing beam on the virtual detector as a function of the rotation angle of the FRLODL disk. In Fig. 2(a)–(d), we show the outgoing beam on the detector screen at several rotation angles. During the simulation, the curvilinear reflectors are considered to be perfectly planar in OX direction [Fig. 1(c)], and consequently, they have no optical aberration in this direction. However, we note that the centroid position and intensity distribution of the outgoing beam vary considerably in the OY direction when the disk rotates to different angles. To explain this, we simply recall that the reflectors have irregular curvilinear profiles that would defocus the incoming beam. In addition, we note that when the rotation angle is less than 6 or greater than 34 , the incident beam is cut by the edge of the reflectors, resulting in an incomplete reflection. Between 6 and 34 , the number of rays reaching the detector (as calculated by Zemax) is the same as the emitted number of rays. This shows that the beam is completely reflected. In Fig. 2(e) and (f), we plot changes in the centroid position and the root-mean-square (RMS) radius of the outgoing beam as a function of the rotation angle. Typically, the RMS radius
of the outgoing beam is in the range of 6–20 m, and the centroid position of the outgoing beam oscillates within a 70 m range. As demonstrated in the following experimental section, the outgoing beam from the FRLODL would be coupled to a photoconductive antenna (emitter) that generates THz pulses. The amplitude of the generated THz signal is dependent on the intensity and the spatial position of the in-coupled beam. In the following experiment, therefore, we use an antenna with a 100 m gap that would, in principle, have insignificant influence on the generated THz signal. In the above simulation, we use an ideal rotary reflection disk without taking into consideration fabrication errors. In practice, the rotary reflection disk is fabricated by CNC machining followed by a diamond-paste-polishing process. According to [16], it is reasonable to assume the average surface roughness of the produced reflectors to be 1 m. The imperfect reflector surfaces would lead to optical scattering, changing the intensity distribution and spatial position of the outgoing beam. Therefore, we perform another Zemax simulation that takes into account roughness of the reflector surface m . First we numerically calculate the profile of the curvilinear reflectors. Then, we add a 1 m-uncertainty in the 3D coordinates of each point on the reflector surfaces. The simulation results shown in Fig. 3 suggest strong optical scattering of the outgoing beam. The RMS radius of the outgoing beam is generally on the order of several hundreds of micrometers that considerably exceed the dimension of the photoconductive area in the antenna. Besides, we see pronounced variations in the centroid position and intensity distribution of the outgoing beam. Thus, we expect
GUERBOUKHA et al.: DYNAMIC MEASUREMENTS AT THZ FREQUENCIES USING A ROTARY OPTICAL DELAY LINE
567
Fig. 3. (a)–(d) Outgoing beams reflected by a rotary disk with 1 m average roughness of the reflector surfaces for rotation angles 5 , 10 , 20 , 30 , respectively. The rotation angle is defined in Fig. 1(a). (e) RMS radius of the outgoing beam at different rotation angles. (f) Centroid position of the outgoing beam in OX and OY direction on the detector screen as a function of the rotation angle.
Fig. 4. Experimental setup. Inset shows the FRLODL disk with its four manufactured blades. Notice the parallel incoming and outgoing optical beams at different rotation angles.
that the amplitude of the generated THz signal from the antenna would vary a considerable amount as the rotary disk rotates to different angles. This was also confirmed in our experiments as shown in the following section. We note that in order to reduce the amplitude variations, a more precise CNC machining or diamond turning technique should be used for the fabrication of the FRLODL. The experimental setup is depicted in Fig. 4. A 100 fs Ti:sapphire laser (Mai Tai, Spectra-Physics) with a wavelength of 800 nm and a repetition rate of 100 MHz delivers 100 and 10 mW to the THz photoconductive emitter and detector an-
tennae (PCA), respectively. A linear delay line is placed on the detector (Tera8-1, Menlo Systems, 5 20 m gap) side. While this linear delay line is needed for the initial characterization, we will show later that the FRLODL can be used alone. The FRLODL is placed on the emitter side and, adjacently, a lens focuses the beam on the emitter PCA (T-Era-400A-800Air, TeTechS, 100 100 m gap). During the measurements, the emitter is supplied by 50 V DC. The detector PCA current output is connected to a low noise transimpedance amplifier (DLPCA-200, FEMTO) which enables high signal-to-noise ratio. The analog output of the current amplifier is then con-
568
IEEE TRANSACTIONS ON TERAHERTZ SCIENCE AND TECHNOLOGY, VOL. 5, NO. 4, JULY 2015
Fig. 5. Characterization of the FRLODL. (a) THz time traces for different delays between the emitter and detector lines and (b) the deduced positions (in ms) of the main peak knowing the delay (in ps). (c) The averaged and normalized pulses for different rotation speeds and (d) the corresponding power spectra. The arrow points to the noise level of the FRLODL measurements. The “Linear” curve corresponds to the measurement with a standard micropositioning linear stage and is added for comparison of the positions of the water absorption lines. (e) The signal-to-noise ratio for different rotation speeds and (f) the dynamic range as a function of the number of averaging.
nected to a data acquisition card (NI USB-6343, National Instruments) that samples at 500 kHz with 16 bit resolution. In contrast with a regular THz-TDs setup, our FRLODL-based setup does not require using a lock-in amplifier. The FRLODL surface is made utilizing computer numerical control machining (Charly 2U, CNC machine) with a linear translation precision of 3 m and a repeatability of 20 m. The blade surfaces were then manually diamond-paste-polished. The incoming and outgoing optical beams are parallel and have a constant 1 cm separation in space. Using this technique, we fabricated four blades on the same disk. The number of scans per second increases in proportion to the number of blades on the disk, thereby enabling higher scan rates in a system with the same rotation motor and acquisition setup. To further increase the sampling rate, one could use a disk with a greater radius allowing the incorporation of a larger number of blades. Due to limitations in the optical quality of our blades, there are variations in the generated THz pulse depending on the rotation angle. In Fig. 5(a), we present THz time traces for different delays between the emitter and the
detector sides achieved using the fast rotary delay line. We add time delay by moving the linear delay line by increments of 50 m (0.33 ps) over a range of 25 mm (165 ps) and record the resultant THz pulses. As depicted in Fig. 5(a), there are amplitude variations that are primarily caused by the quality of the CNC micro-machined FRLODL surface. Indeed, the linear precision of the CNC machining is on the same order as the laser wavelength. As demonstrated in the simulations, this leads to both intensity variations and spatial displacements of the optical beam. To utilize the full extent of the optical delays provided by the rotary delay line, precise calibration of the generated THz power as a function of the rotation angle is required. However, as we will show in the following sections, multiple THz applications do not require extended delays or focus only on the temporal position of the main THz peak. In this case, calibration is not a prerequisite for the operation of the rotary delay line. To reduce the effect of the beam spatial displacement, we placed an iris on the beam path just before focusing on the THz emitter. Due to the large photoconductive area of the THz emitter, these small
GUERBOUKHA et al.: DYNAMIC MEASUREMENTS AT THZ FREQUENCIES USING A ROTARY OPTICAL DELAY LINE
569
Fig. 6. Evaporation process measured with the FRLODL. (a) Normalized electric field amplitude of the main THz peak as a function of time for water, acetone and methanol. Inset: longer time scale. (b) Time traces (top) and spectra (bottom) for the evaporation of acetone.
variations do not prevent the excitation of THz pulses. In the following, we used only one of the four FRLODL blades to get a consistent rigorous analysis. In Fig. 5(a), the ms-time scale refers to the actual acquisition time as recorded by the analog-to-digital acquisition card. A linear micropositioning stage with a retroreflector placed on the emitter side was used to calibrate the rotary delay line. Knowing the increment of the main THz peak in the ps-scale (position of the micropositioning stage) and in the ms-scale, it is possible to find a linear relation between the two scales [Fig. 5(b)]. The slope of this curve confirms the linearity of the FRLODL and provides an experimental conversion factor between the ms and ps-scale (in this case 16.85 ps/ms). Note that this experiment was conducted at a rotation speed of 12 Hz. Therefore, for different rotation speeds, one needs to perform a simple cross-multiplication to find the correct conversion factor. By applying the conversion factor in Fig. 5(a), we find a maximum efficient optical delay of 100 ps. In Fig. 5(c), we present several measurements at different rotation speeds of the FRLODL. In principle, acquisition rate can be further increased four times if all the blades on the disk are used. The dashed blue curve corresponds to a scan made by the linear delay line in a regular setup using a lock-in amplifier. The ps-scale was obtained through the cross-multiplication of the conversion factor by the rotation speed, giving appropriate results as can be evaluated by the position of the water lines in the spectrum [Fig. 5(d)]. As depicted in Fig. 5(c), when enhancing the speed of the scan, the THz pulse time structure becomes less pronounced. This is directly related to the low-noise current amplifier. In our setup, the amplifier has a 10%–90% rise time of 50 s. Converting this value to ps-scale using the above conversion factor, we find 0.84 ps at 12 Hz, but 3.4 ps at 48 Hz. As a result, the THz pulse will be less defined as each data point corresponds to a time average over longer sampling intervals at higher FRLODL rotation speeds. The impact of the acquisition electronics can be directly seen in the spectrum, in which bandwidth decreases with increase in the rotation speed. To overcome this issue, one could either use a faster transimpedance amplifier or increase the power of the THz signal. Finally, to complete the characterization of our FRLODL system, we present error measurements [Fig. 5(e) and (f)]. We take standard time-based error calculation to define
signal-to-noise ratio (SNR) and dynamic range (DR) [19] (1) (2) In this definition, the SNR measures the accuracy on the amplitude, while the DR gives an idea of the system response to strongly attenuating samples. In a regular setup with a lock-in amplifier, the SNR is greatly enhanced because of the high value of the integrating time constant. For example, with a 100 ms time constant, we obtain an SNR of approximately 140. Obviously, with the FRLODL, the SNR decreases with the rotation speed and again, this is linked to the rise time of the transimpedance amplifier. In Fig. 5(f), we present the DR after averaging the pulse. In some applications, it is possible to perform this averaging at the expense of the total acquisition time. A regular setup with a linear micropositioning stage gives a DR of approximately 3000, but with a total acquisition time of 3–4 min, while, in comparison, our FRLODL produces a DR of nearly 1000 with 20 s (250 scans at 12 Hz) acquisition time. III. PRACTICAL APPLICATIONS OF THE FRLODL A. Monitoring of the Evaporation Process As a potential application of the FRLODL for THz spectroscopy, we first present real-time non-contact monitoring of the evaporation process for different liquids. For this purpose, a paper tissue is positioned in the path of the THz beam and THz signal recording is initialized using the FRLODL at a rotation speed of 12 Hz. A volume of 50 L of water, acetone, or methanol is then applied to the surface of the tissue. In Fig. 6(a), we show the electric field amplitude variation of the main peak. The THz wave passing through the liquid is absorbed differently depending on the absorption coefficient and the thickness of the liquid layer. As the liquid evaporates, the peak amplitude returns back to its initial value. As expected, acetone evaporates faster than methanol and water [20]. In particular, in Fig. 6(b), we present time traces and spectra for acetone evaporation. One can clearly see the absorption in a broad range of frequencies related to the losses in the liquid. It is worth noticing that in Fig. 6(a), the apparent noise is directly correlated to the limited signal-to-noise ratio. As defined
570
IEEE TRANSACTIONS ON TERAHERTZ SCIENCE AND TECHNOLOGY, VOL. 5, NO. 4, JULY 2015
Fig. 7. Monitoring of the painting process using the FRLODL. (a) Normalized amplitude (top blue) and time shift (bottom red) of the main THz peak along time. (b) THz time traces during spraying (top) and drying (bottom). (c) Normalized power spectra evolution along time. (d) Averaged pulse before and after the painting process.
above, the SNR is a measure of the accuracy on the amplitude measurement. At a rotation speed of 12 Hz, with an SNR of roughly 70, it is still possible to get sufficient contrast between the noise and the signal. Naturally, it is possible to decrease the rotation speed in order to improve the SNR, however, in this case ms-time scale processes will not be resolved. B. Monitoring of Spray Painting In the previous experiment, the three tested liquids were transparent in the optical range. Contrarily, in this section, we present a monitoring of the drying process of non-transparent red enamel spray paint. A paper substrate is placed in the path of the THz beam and recording of the THz signal is initialized while the FRLODL rotates at a speed of 10 Hz. We then apply the spray paint to the surface of the paper for a duration of 7–8 s, then allow it to dry for several minutes. In Fig. 7(a), we present the variation of the main peak amplitude (top blue line) and time delay (bottom red line). There are two notable regimes and we show their time traces in Fig. 7(b). The first regime (I) corresponds to the spraying process and lasts about 8 seconds. As more paint is added, the THz wave is absorbed more strongly, thus, the main peak amplitude is reduced. The spray paint also possesses a larger refractive index, thereby delaying the THz pulse in time. The second regime (II) corresponds to the drying process. In the spray paint, volatile solvents such as acetone are used. As seen from Fig. 7(a), they evaporate very quickly, on the order of 30 s. The recorded THz pulse then stabilizes. In Fig. 7(d), we perform an averaging of 1000 pulses (100 seconds) before and after applying the spray paint. It is possible to estimate the thickness of the paint layer from the shift in time and in the peak absorption. For our sample, the thickness of dried paint, as measured with a micrometer, is
around 20–30 m. The THz measurements of the main peak show a shift in time of 0.11 ps and an absorption of 6%. C. Detection and Thickness Evaluation of Moving Objects In the final application of the FRLODL, we present the detection and thickness characterization of fast moving objects. This application intends to show the large time delay available with the FRLODL. While recording THz pulses at 24 Hz, we drop samples of low density polyethylene (LDPE) of varying thicknesses in the path of the THz beam [Fig. 8(a)]. The samples are cylindrically shaped with a diameter of 52.5 mm. The rate of fall at the position of the THz beam is 1 m/s. Fig. 8(b) shows the relative time position of the main peak from the beginning of the recording until the end. When the LDPE sample passes through the THz beam, the pulse experiences a retardation, resulting from the LDPE refractive index of [21], and is shifted in time. The time delay is directly proportional to the thickness of the sample (3) is the speed of light in vacuum. In this manner, it is where possible to assess the thicknesses of the LDPE samples (see Table I). A closer look at the recorded THz traces shows how fast the acquisition is. At a constant 1 m/s rate of fall, with a FRLODL rotation speed of 24 Hz, a single recording is conducted every 41.7 mm. With a sample diameter of 52.5 mm, two acquired pulses effectively show the passage through the LDPE [traces II and III in Fig. 8(c)]. It is worth noticing that in our particular case, the THz beam is collimated, therefore we recorded a part of the beam passing through the sample while the other
GUERBOUKHA et al.: DYNAMIC MEASUREMENTS AT THZ FREQUENCIES USING A ROTARY OPTICAL DELAY LINE
571
Fig. 8. Detection of fast moving LDPE samples. (a) Experimental setup. THz beam is collimated and the LDPE sample drops vertically. (b) Detected time delay by the passing of the LDPE samples. Inset: zoom at the passing of the 14.72 mm sample and (c) corresponding time traces. (d) Inaccuracy of the temporal position of the peak when using the motor trigger (top) or the photodiode trigger (bottom).
TABLE I THICKNESS OF LDPE SAMPLES ASSESSED WITH MICROMETER AND FRLODL
part passed through air, which explains why two peaks are observable. Table I shows the assessed thickness of LDPE based upon (3). The thickness resolution of this method is directly related to the speed of the acquisition card and the FRLODL rotation frequency. For example, if one uses a 500 kHz card, then each data point is separated by 2 s which can be directly converted to the ps-scale using the above conversion factor. At 24 Hz, 2 corresponds to 0.0674 ps and, for LDPE, this is 39.4 m from (3). Noise arises primarily from jitter in the motor rotation. For the data acquisition to begin, it is important to have a reliable electric trigger. If one uses the electric output of the rotating motor, fluctuations in the speed of the motor can lead to different temporal positions of the peak. To avoid this problem, we deviated a small fraction of the optical beam into a photodiode placed prior to the emitter PCA. Then, we use the electrical output of the photodiode as the trigger. This method allows the data acquisition
to begin at the same time as the optical excitation of the emitter PCA thus avoiding jitter noise. At the top of Fig. 8(d), we show the temporal positions of the main peak when the acquisition is triggered by the motor. We simultaneously recorded the electric output of the photodiode. Then, in bottom of Fig. 8(d), we correct the THz pulses, by superimposing the photodiode electric outputs. By applying this method we are able to significantly reduce the jitter noise. Note that for this particular experiment, we used two channels on the acquisition card (one for the THz pulse and one for the photodiode), therefore each channel was sampled at 250 kHz and the aforementioned resolution has to be doubled. Notice also that the FWHM of the main peak is about 0.5 ps (8 data points at 24 Hz), giving an upper value for the 312 m error. However, experimental thickness measurements show better results in most cases. IV. CONCLUSION In summary, we demonstrated the experimental implementation of a fast rotary linear optical delay line. We discussed the accuracy of the FRLODL and detailed the possible sources of imprecision. The finite size of the laser beam reflected from the surface of the rotary delay line (as opposed to an optical ray) leads to its defocusing. As a result, the beam spot size on the PCA is found in the range of 6–20 m with the centroid position oscillating within a m range. For large gap photoconductive antennas, these oscillations will have an inconsequential influence on the generated THz signal. However, the errors coming from limited accuracy of CNC machining cause considerable variation of the THz signal amplitude as a function of the rotation angle.
572
IEEE TRANSACTIONS ON TERAHERTZ SCIENCE AND TECHNOLOGY, VOL. 5, NO. 4, JULY 2015
In this paper, we demonstrated experimental characterization of a fast rotary optical delay line for terahertz time-domain spectroscopy. The use of this device is greatly facilitated due to the linearity of the time delay. A simple conversion factor between the acquisition time and THz time can be used for calibration. This system has been tested at acquisition rates of up to 48 Hz per blade. In principle, four times higher speeds can be obtained when using all four blades. Ultimately, the time acquisition is limited by the electronics, in particular by the transimpedance amplifier. Then, we showed several applications for the FRLODL. Firstly, the evaporation process of similar transparent liquids was observed, providing a way to identify each liquid by its evaporation rate. Secondly, monitoring of the painting process was demonstrated. The spraying and drying phases of the paint were clearly visible in the time traces, with a shift in both amplitude and time delay. Thirdly, we showed detection of fast moving LDPE samples. We also used the shift in time to evaluate sample thicknesses of up to 44 mm (75 ps). Jitter noise in the motor rotation was reduced by using a photodiode as an electrical trigger. ACKNOWLEDGMENT The author would like to thank TeTechS Inc. for their general support of this project and their donation of the THz equipment. REFERENCES [1] M. Tonouchi, “Cutting-edge terahertz technology,” Nature Photon., vol. 1, no. 2, pp. 97–105, 2007. [2] D. C. Edelstein, R. B. Romney, and M. Scheuermann, “Rapid programmable 300 ps optical delay scanner and signal averaging system for ultrafast measurements,” Rev. Sci. Instrum., vol. 62, no. 3, pp. 579–583, Mar. 1991. [3] J. Ballif, R. Gianotti, P. Chavanne, R. Wälti, and R. P. Salathé, “Rapid and scalable scans at 21 m/s in optical low-coherence reflectometry,” Opt. Lett., vol. 22, no. 11, pp. 757–759, Jun. 1997. [4] J. Szydlo, N. Delachenal, R. Gianotti, R. Walti, H. Bleuler, and P. R. Salathe, “Air-turbine driven optical low coherence reflectometry at 28.6-kHz scan repetition rate,” Opt. Commun., vol. 154, no. 1–3, pp. 1–4, Aug. 1998. [5] G G. Lamouche, M. Dufour, B. Gauthier, V. Bartulovic, M. Hewko, and J.-P. Monchalin, “Optical delay line using rotating rhombic prisms,” Proc. SPIE vol. 6429, Feb. 2007 [Online]. Available: http://proceedings.spiedigitallibrary.org/proceeding.aspx?articleid=1296432, Paper 64292G [6] T. Probst, A. Rehn, S. F. Busch, S. Chatterjee, M. Koch, and M. Scheller, “Cost-efficient delay generator for fast terahertz imaging,” Opt. Lett., vol. 39, no. 16, pp. 4863–4866, Aug. 2014. [7] A. Bartels, R. Cerna, C. Kistner, A. Thoma, F. Hudert, C. Janke, and T. Dekorsy, “Ultrafast time-domain spectroscopy based on high-speed asynchronous optical sampling,” Rev. Sci. Instrum., vol. 78, no. 3, p. 035107, Mar. 2007. [8] P.-L. Hsiung, X. Li, C. Chudoba, I. Hartl, T. H. Ko, and J. G. Fujimoto, “High-speed path-length scanning with a multiple-pass cavity delay line,” Appl. Opt., vol. 42, no. 4, pp. 640–648, Feb. 2003. [9] L. Liu and N. G. Chen, “Double-pass rotary mirror array for fast scanning optical delay line,” Appl. Opt., vol. 45, no. 21, pp. 5426–5431, Jul. 2006. [10] X. Liu, M. J. Cobb, and X. Li, “Rapid scanning all-reflective optical delay line for real-time optical coherence tomography,” Opt. Lett., vol. 29, no. 1, pp. 80–82, Jan. 2004.
[11] K. Locharoenrat and I. Jen Hsu, “Optical delay line for rapid scanning low-coherence reflectometer,” Intern. J. Inf. Electron. Eng., vol. 2, no. 6, pp. 904–906, Nov. 2012. [12] C.-L. Wang and , C.-L. Pan, National Science Council, Taiwan, R.O.C, “Scanning optical delay device having a helicoid reflecting mirror,” U.S. Patent 5907423 A, May 25, 1999. [13] T. D. Dorney, “Scanning optical delay line using a reflective element arranged to rotate,” U.S. Patent 7 046 412, May 16, 2006. [14] G. J. Kim, Y. S. Jin, S. Y. Jeon, and J. I. Kim, Korea Electrotechnology Research Inst, , Korea, “Rotary optical delay line,” U.S. Patent 7453619 B2, Nov. 18, 2008. [15] J. Xu and X.-C. Zhang, “Circular involute stage,” Opt. Lett., vol. 29, no. 17, pp. 2082–2084, Sep. 2004. [16] G.-J. Kim, S.-G. Jeon, J.-I. Kim, and Y.-S. Jin, “High speed scanning of terahertz pulse by a rotary optical delay line,” Rev. Sci. Instrum., vol. 79, no. 10, p. 106102, Oct. 2008. [17] M. Skorobogatiy, “Linear rotary optical delay lines,” Opt. Express, vol. 22, no. 10, pp. 11812–11833, May 2014. [18] H. Qu and M. Skorobogatiy, “Design of the curvilinear reflectors for linear rotary optical delay lines,” presented at the Int. Optical Design Conf.—IM2B Exotic Optics I, Jun. 2014, paper IM2B.4. [19] M. Naftaly, “Metrology issues and solutions in THz time-domain spectroscopy: Noise, errors, calibration,” IEEE Sensors J., vol. 13, no. 1, pp. 8–17, Jan. 2013. [20] Standard Test Methods for Evaporation Rates of Volatile Liquids by Shell Thin-Film Evaporemeter 2011 [Online]. Available: www.astm. org, ASTM D3539-11, ASTM International, West Conshohocken, PA [21] J. R. Birch, “The far infrared optical constants of polyethylene,” Infrared Phys., vol. 30, no. 2, pp. 195–197, 1990. Hichem Guerboukha received the B.S. degree in engineering physics and the M.S. degree in applied science from the Ecole Polytechnique de Montréal, Canada, in 2014 and 2015, respectively, and is currently working towards the Ph.D. degree from the same university. Since 2013, he is a member of the Complex Photonic Structures and Processes Group of Prof. Maksim Skorobogatiy at the Ecole Polytechnique de Montreal, Canada. His research interests include THz instrumentation and waveguides, as well as practical implementation of THz spectroscopy and imaging.
Andrey Markov was born in Troitsk, Russia, in 1986. He received the Diploma degree in physics from the Lomonosov Moscow State University in 2009, and the Ph.D. degree from the Ecole Polytechnique de Montreal, Canada, in 2015. At the time of the publication, he was a member of the Complex Photonic Structures and Processes Group of Prof. Maksim Skorobogatiy at the Ecole Polytechnique de Montreal, Canada. His current research involves designing microstructured and plasmonic terahertz waveguides, as well as THz applications in sensing, spectroscopy, imaging and communications.
Hang Qu received the B.Sc. degree in physics and the M.Sc. degree in engineering physics from Jilin University, China, in 2005 and 2007, respectively, and the Ph.D. degree in engineering physics from Ecole Polytechnique de Montreal, Canada, in 2013. He is currently working as a post-doctoral fellow in Complex Photonic Structures and Processes group in Ecole Polytechnique de Montreal, Canada. His current fields of interest include fabrication of microstructured optical fiber, optical fiber sensing, as well as THz applications in sensing, spectroscopy and communication.
Maksim Skorobogatiy received B.Sc. degree in physics from the Rochester Institute of Technology, Syracuse, NY,USA, in 1995, the M.Sc. degree in physics from the McGill University, Montreal, Canada, in 1997, and the M.Sc. degree in electrical engineering and the Ph.D. degree in physics from the Massachusetts Institute of Technology (MIT), Cambridge, MA, USA, in 2000 and 2001, respectively. Since 2003, he heads a research group on Advanced Photonic Structures in the Ecole Polytechnique de Montreal, Canada.