TOPIC ISLANDS TM – A Wavelet-Based Text Visualization System Nancy E. Miller*, Pak Chung Wong**, Mary Brewster Pacific Northwest National Laboratory
ABSTRACT We present a novel approach to visualize and explore unstructured text. The underlying technology, called TOPIC-O-GRAPHYTM, applies wavelet transforms to a custom digital signal constructed from words within a document. The resultant multiresolution wavelet energy is used to analyze the characteristics of the narrative flow in the frequency domain, such as theme changes, which is then related to the overall thematic content of the text document using statistical methods. The thematic characteristics of a document can be analyzed at varying degrees of detail, ranging from section-sized text partitions to partitions consisting of a few words. Using this technology, we are developing a visualization system prototype known as TOPIC ISLANDSTM to browse a document, generate fuzzy document outlines, summarize text by levels of detail and according to user interests, define meaningful subdocuments, query text content, and provide summaries of topic evolution. Keywords: text visualization, information visualization, wavelet transform, and information retrieval.
1
INTRODUCTION
Consider the large and ever growing number of electronic documents we have to read everyday. We often judge the importance of a document simply by looking at its title and then decide whether to proceed. As we go further into the information age, we are simultaneously tantalized and overwhelmed by the glut of textual information that requires our attention. Several visualization systems, such as DEPICT [16] and SPIRE [19] have attempted to help information consumers sift though massive quantities of text. Such technologies are primarily concerned with the general characterization of a corpus, enabling the user to rapidly focus on a subset of potentially interesting documents. Ultimately, however, the user must endure the often tedious effort of reading the identified documents. This can be especially cumbersome for lengthy documents. Quick ways that adapt to the amount of detail the user is willing to accept are needed. We are creating an interactive software prototype, TOPIC ISLANDSTM, to characterize the content and flow of a text document using only the words within the document and to do so at varying levels of detail. The varying levels of detail are directly available from the multiresolution levels (MRLs) that result from the application of wavelet transforms to a mathematical signal built from the text narrative. Our primary goal is to enable the user to rapidly assess the relevance of documents to his specific interests by providing a tool that connects the text narrative to embedded themes. These methods may also provide multiple ways for the user to interact with the documents at the corpus level. TOPIC-O-GRAPHY may improve the efficiency of our natural text-scanning practices. For documents written in English or *
[email protected] **
[email protected] ‡ Now at Los Alamos National Laboratory ‡‡
[email protected] † P.O. Box 999, Richland, WA 99352, USA †† The Pacific Northwest National Laboratory is operated by Battelle for the U.S. Department of Energy under Contract DE-AC06-76RLO 1830.
‡
, Harlan Foote
‡‡
†, ††
other Latin-based languages, we tend to read only a portion of a word (e.g., “real” instead of “really”) before jumping irregularly to the next position, and repeating the process [4]. We tend to move our eyes from the upper left to the lower right corners of each text column. TOPIC-O-GRAPHY is designed to enhance this natural reading behavior by providing the rich thematic information of a document in such a way that the scanning has already been done. The reader thus has a more balanced viewing window (i.e., without stretching to the right or the bottom of the page) and spends more time in the important parts of the text. Our initial results using TOPIC ISLANDS appear promising. Additional work is in progress. Usability studies are required to quantify the true impact of our technology on reading practices.
2
PREVIOUS WORK
Although we believe our approach is novel, much inspiration for our approach is found in the work of others. Here we discuss important prior work on text visualization, text theme characterization, and wavelet processing in visualization in general.
2.1
Text Visualization
Text visualization is challenging! It is much more difficult to apply scale measures to textual documents than it is to quantitative data sets. Recently, many visualization scientists have developed techniques to browse different kinds of textual data. Eick and Steffen [3] visualize the execution status of a large software program in SeeSoft. In this system, program modules are shown as blocks, and color is used to indicate the frequency count of a line of code being called. SPIRE graphically displays the similarities among documents of a corpus based on word similarities and automatically discovers key topics in the text. The Galaxies view is based on a dimensionality reduction technique called multidimensional scaling (MDS) with closely related documents clustering together in a 2D projection. The Themescape view produces a terrain map of themes found in the corpus. DEPICT uses Kohonen’s [9] Self-Organizing Map (SOM) to visualize the information content of document corpora. The neural-network-based design reduces the highdimensional context vectors of a corpus into a low-dimensional data space for visualization. Card, et al. [2] have developed WebBook to browse and organize Internet web pages. Users can riffle through pages, rip pages from a book, and tack a page to a desk or wall in the 3D room in which the book is located. WebBook is among the latest additions of the Xsoft project, which includes text visualization techniques such as Perspective Wall [9] and Document Lens [15]. Cat-aCone [8] integrates the designs of Cone Tree [14] and WebBook into a powerful visualization tool to search and browse very large category hierarchies with their associated text documents. Closest in intent to our work is Hearst’s TileBars [7], which allows the user to define specific topics of interest and then produces a linear color block map to show where chunks of the documents are likely to contain these topics.
2.2
Thematic Partitioning
Several methods have been used to locate and visualize theme breaks found in electronically formatted text. Salton’s tour [17] is a graph with links and nodes. His “tour” or summary of a docu-
ment is produced by ordering merged paragraphs in chronological (or narrative) order and producing a summary for each of the merged sets. Hearst [6] describes an algorithm for finding subtopic structure in expository text that uses a moving window approach. Adjacent blocks are compared using cosine similarity measured on the full set of words within each block. Boundaries for topic changes are found by identifying the points of greatest change in the smoothed cosine-gap sequence from the moving windows after applying a set of rules.
2.3
Wavelets in Visualization
Wavelet transforms are based on translation (W(t) → W(t-1)) and dilation (W(t) → W(2t)). Without loss of generality, wavelets can be considered as signal filters that accept data streams of n items and generate (n/2) items of approximations and (n/2) items of details. The approximation is a coarse summary of the original data, and the details contain the data lost during the decomposition. A hierarchy of coarse approximations is generated when this process is applied iteratively to the approximations to obtain increasingly coarse data. The fact that wavelet signals are highly localized in both space and frequency domains makes them a better and more reliable choice over the prevailing signal analysis tools, such as the discrete cosine transform (DCT) and even the fast Fourier transform (FFT). Ever since Mallat [11] presented the groundbreaking fast multiresolution implementation of wavelet transforms in 1989, scientists and engineers have found new opportunities in many disciplines and applications. In the last few years, we have successfully used wavelets to visualize the authenticity of multiresolution scientific data sets [20], multidimensional volume data sets [21], and multivariate relational data sets [22, 23]. In the same community, wavelets have also been used to visualize and analyze a variety of structured [6, 18] and unstructured [13, 24] data sets. What differentiates this work from our previous work and all other uses of wavelet analysis is the application to seemingly nonrefinable free text and the new, innovative wavelet implementation, which achieves the highest possible grains of wavelet details. This is the first attempt to analyze the context of a document or corpus in wavelet space.
3
DESCRIPTION OF WAVELET ENERGY
A custom digital signal of a document is constructed from the words, the word associations, and the chronological or narrative order of the words within the document. In this process, several of Bookstein’s [1] ideas regarding identification of content-bearing words, which we refer to as topics or channels in our analysis, are used to extract information from a document. Wavelet transforms are then applied to this custom signal to calculate three types of wavelet energy: channel, composite, and query. The strength of wavelets is that the output signal, which is a function of narrative index (word order), is defined for a suite of MRLs. In this section, we describe the types of wavelet energy used in our visualizations and their interpretation.
3.1
Channel Energy
The most basic wavelet calculation is the channel energy. Each channel or topic signal is processed and stored independently. Mathematically, our implementation of the piecewise constant Haar wavelets is defined as (1)
where y is a vector of associations, m is the channel or topic, k is the MRL, and j corresponds approximately to the narrative index at which the filter is centered. The numbers of resolution k in our analysis are a function of the length of the document. The output signal for each channel at each MRL has the same length as the text narrative.
3.2
Composite Energy
The composite wavelet energy is calculated by generalizing the calculation of the channel energy to include all information across all channels (index m) for a fixed location (index j) and fixed MRL (index k). The multiresolution composite energy is used to identify breaks of the narrative flow in frequency domain, in which the information is related to the overall thematic content of the document using statistical methods. The conceptual flow can be analyzed at varying degrees of detail, ranging from sectionsized text partitions down to partitions consisting of a few words.
3.3
Query Energy
For a more flexible and broad-spectrum query procedure, the composite energy calculation is modified to include information from a specified usage pattern that has been determined to be relevant to the query. The result is the query energy that shows the local relevance between the narrative and the query. A base resolution level, which is determined by the length of the query, is selected. The second summation in Equation (1) is then replaced by a static representation derived from the query. The results shown in this paper use this approach, which generates a singleresolution output signal [12]. It is in the implementation of queries that the importance of the word associations becomes clear. If the zero-order statistics such as word frequency are used, as in many other prevailing systems, there will be no recognition of the synonymous use of different words. Note that in either approach described below, the query words may or may not actually appear in the article; however, similarity in usage pattern may still be noticeable.
3.4
Wavelet Energy Interpretation
The edge-detecting property defined by the wavelet calculation is useful for a variety of analyses. The composite energy is used to detect the point where the narrative topic changes. When the energy is high, we have strong evidence of a change in topical flow in the text. In our visualization, we typically show the upside-down view of the normalized energy for each MRL whereby dips or valleys in the curve correspond to evidence of theme changes. Because we have a suite of MRLs and can examine the evidence from consecutive MRLs simultaneously, we do not need to worry about the optimal size of pseudo-sentences as do many other techniques. The query energy reaches the lowest when a good match to the query is found. We have done a small amount of work to date with the channel energy. The channel energy is most useful for automatic assignment of keywords to text partitions that have been found using the composite energy.
4
TOPIC ISLANDS VISUALIZATIONS
In this section, we present a set of interrelated visualizations, collectively referred to as TOPIC ISLANDS, based on the wavelet energies of two lengthy documents. The composite energy calculations are first shown for the full suite of MRLs. The user selects a subset of the MRLs for further detailed examination. This detailed subset of energies defines a 3D structure that we visualize as a wave. The MRL subset is also used to partition the text into MRL document subchunks; these subchunks are then used to form
volumes whose thematic content is used to create a 3D island visualization. The island visualization has a simple geometrical view. The tree visualization lets the user navigate between the text narrative and the island thematic view. We have created a document viewer in which the wavelet energies have been directly superimposed upon the text to render a color-annotated document view that draws the eye to changes in themes and fertile locations to read for text summarization.
4.1
tion of the line plots to designate this portion of the text for further analysis (see section 4.3.2). All other visualizations are keyed from this selected subset of multiresolution energies and the corresponding text.
Our Goals
The primary goal of TOPIC ISLANDS is to reduce the amount of time the user needs to spend reading long articles to understand the various topics discussed and thus to assess whether this is a document to which he should devote in-depth attention. TOPIC ISLANDS is not an automatic text summarizer per se, but it does draw the attention of the user quickly to the thematic structure of the document and the parts to read for a quick summary. A strong emphasis is placed on interactions, such as brushing and linking, among various visualizations.
4.2
Analysis Data Set
The documents analyzed in this section and Section 5 are part of a collection of Time magazine articles published in 1963.1 This corpus is attractive because it contains some very long articles that are of general interest rather than scientific. (Scientific articles are more thematically cohesive and tend to be easier to analyze.) This data set is somewhat tedious as there are no paragraph breaks in the electronic text, and the character set is all uppercase. A technical editor read each document and identified where paragraph breaks would likely occur and identified theme transitions for our analysis. We make heavy use of the author-inserted subheadings for the articles in the discussion found in Section 5. Within this corpus, there are multiple authors with very different writing styles. The two articles we present here are referred to as the “Buddhist article” and the “Ireland article" in the captions and in the discussions to follow in Section 5. The Buddhist article discusses the violent crackdown of South Vietnam’s Diem regime on the Buddhists. The Ireland article discusses Ireland’s challenges to modernization under the leadership of Sean Lemass.
4.3
TOPIC ISLANDS™ Visualizations
We are developing a highly interactive text visualization prototype using C++, Motif, and OpenGL. The design, which contains a variety of user-friendly visualizations and navigation tools, lets a user to browse and query the content of a single document in a multiresolution fashion. Our definition of multiresolution is somewhat different from the traditional levels-of-detail designation, in the sense that a particular resolution reflects the ranges of the theme breaks being examined instead of the size of the data. In the following discussion, we describe the functionality of individual visualization tools and describe the role of each tool in the overall design. We also show an integrated example and describe how a user can benefit from our approach.
4.3.1
4.3.2
Detail MRL Strip Chart
A detail MRL strip chart is the zoomed view of the highlighted portion of the overall MRL strip chart. In the detail MRL strip chart, a user selects a narrative-based section from the multiresolution plots and then accesses the corresponding portion of the text through a pop-up browsing window. The MRL-specific theme breaks, which can be automatically generated, are presented to the user in the detail MRL strip chart. The detail strip chart and the pop-up text browsing window together allow a user to inspect the system-suggested theme breaks visually and to possibly override the system-generated break points with precision up to the individual word. In Figure 2, five break points are tagged from MRL 8, ten are tagged in MRL 7, and nineteen are tagged from MRL 6. The user selects or deletes break points with mouse clicks. MRL 5 is viewed as evidence but is not used to generate any breaks. The breaks determine a subdividing strategy for the documents using three consecutive MRLs. Once the subdividing is accepted, the result is available for creation of the island view.
Overview MRL Strip Chart
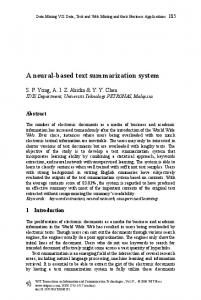
Our discussion starts with a set of MRL strip charts showing various degrees of thematic changes in the narrative flow for a document. Figure 1 depicts a set of nine strip charts, each showing a different multiresolution wavelet energy plotted against the narrative of the same document. The window serves as both a visualization and a navigation tool. A user can highlight any por1
Figure 1: Overview MRL strip chart for 9 MRLs for Buddhist article. MRLs 5-8 have been selected for detailed probing.
These articles may be viewed at http://multimedia.pnl.gov:2080/topicography .
Figure 2: Detail strip chart for Buddhist article. Final break points are shown as white ticks.
4.3.3
Island View
From the detail MRL view, a collection of break points have been selected based on energy changes within the narrative flow, and these break points, in turn, define document subchunks for each
MRL. In the island view, the subchunks are displayed in a 3D visualization where the x-y location is determined from an MDS projection of the document vectors created from the subdividing process. The z-axis represents the MRL in descending order. In Figure 3, each document subchunk is depicted as a geometric object whose centroid coordinates are provided by the MDS calculation and whose base radius is determined by a measure of variability across the cylinders. One variability candidate could be the length of each document subchunk.
4.3.5
Wave
The set of MRL energies presented in the detail overview is also used to create a wave, a 3D-colored surface plot, as shown in Figure 5. This image is formed by taking the x-axis as the narrative order of terms, taking the y-axis as the discrete MRLs, and using color shade (or gray-scale) along the z-axis to indicate energy level. Also, we smooth the surface. Of critical importance for visualization is to animate by rotating the viewing angle. This dynamic surface shows at a glance the entire thematic complexity of the article at the MRLs, including major sections of topics and subsections.
Figure 3: Island view for Buddhist article created from docu-ment sub-chunking shown in Figure 2. See also Color Plate 1 (CP1). The green cylinders, yellow ellipsoids, and orange cones represent subchunks from MRL 8, 7, and 6 respectively. We plan a terrain version that smoothes the volumes of the previous island view to create a 3D manifold. The island visual depiction quickly builds a non-verbal mental model of the thematic interplay in the Buddhist article using the break points tagged in Figure 2.
4.3.4
Tree Navigation Tool
The tree tool, shown in Figure 4, allows the user to navigate between the theme-based island visualization and the text narrative. The crosshairs in the tree correspond to the theme breaks (tick marks from the detail strip chart), which are used to create the island visualization. The tree canopy color indicates the MRL. With this tool, the user can interrogate the visualizations either at the narrative or the theme level. There are two modes of operation: global or local. In the global mode, the position of the slider widget causes all subchunks corresponding to this part of the narrative to light up. In the local mode, only a single MRL is active at a time. In the latter case, the user also has the option of picking islands and observing the part of the narrative to which the slider moves. As in the detail MRL view, a text browser window follows the action of the tree Figure 4: The tree tool tool so that the user can relate facilitates navigation beactual text to narrative index or tween text narrative and the island location. thematic island view.
Figure 5: “Wave” for Buddhist article using MRLs 6 – 8. See also CP2. We call this surface a wave both because as we animate it through various orientation angles, it really looks like waves and because of the connection to wavelets. A wave is the visual equivalent of an outline. Further, the surface representation is more flexible than a standard hierarchical outline such as a tree because instead of requiring each subsection to be strictly contained in one and only one higher-level section, subsections may be fuzzily contained in a section or more than one section. This flexibility is very useful in extending other hierarchical structures such as categorization of subjects for encyclopedias or libraries to more accurately represent interdisciplinary topics.
4.3.6
Color and Stereo Fly-in Document Viewers
In addition to the text browser window previously described, we have created another type of document viewer that directly superimposes the wavelet composite energies onto the text itself. In Figure 6a, the highest energies that correspond to theme changes are shown in pinkish purple; the lowest energies are shown in red. Through comparison of the color patterns, strong evidence for thematic transitions at various levels emerges. In 6b, the energy calculations from MRL 8 shown in Figure 2 have been normalized to a common break-point value to emphasize the user’s breakpoint perspective and smoothed across all words. In this view, the user can quickly see all theme transitions that he has elected to emphasize. We have elected the rainbow color map in Figure 6, as opposed to the heat temperature color map used in Figure 5, to visualize a broader distribution of energy values.
6a
6b
wavelet analysis to paragraph and theme breaks, and interpret the island visualizations.
5.1
Description of the Articles
Figure 8 shows the wavelet energy of the Buddhist article in MRLs 6, 7, and 8 with vertical dashed lines drawn and numbered at each location where the editor-imputed paragraph breaks occur.
Figure 8: Composite energy from Buddhist article with dotted lines at editor-imputed paragraph breaks.
Figure 6a & 6b: The text of the Buddhist article with wavelet energies superimposed using two strategies. See also CP3.
Figure 9 contains the same information for the Ireland article. In addition to the numbered paragraphs, capital letters are inserted at the top to indicate the locations of the articles’ subheadings.
In our design, the user “flies in” to read a color-coded section; he can switch to stereo, where the degree to which words stand out from the page, using anaglyph glasses, is determined by the original energy levels within the given MRL. This is illustrated in Figure 7.
Figure 9: Composite energy from Ireland article with dotted lines at editor-imputed paragraph breaks. Tables 1 and 2 make the correspondence among the paragraph numbering scheme, letter abbreviations, and the full title of the subheadings. Table 1. Buddhist Article – 2,673 words & 17 paragraphs Paragraph Number
Figure 7: Stereoscopic view of part of the Buddhist article. See also CP4.
5
DISCUSSION
So how well does this technology work? To fully address this question, formal usability studies must be conducted. To investigate performance, we must understand the Buddhist and Ireland articles in some detail. In this section, we describe the two articles. We also compare the theme transition points indicated by our
4 8 10 13 14 15 16
Subheading Phrase B - Boola, Boola R - Rope Trick A - Article 44 U - Ugly American A - Anti, Anti, Anti C - Crackdown T - The Course of Events
Table 2. Ireland Article – 4,859 words, 31 paragraphs Paragraph Number
2 4 5 6 9 10 13 14 16 18 21 23 24 27 30
Subheading Phrase H - Holy Ireland P - Porther and Shamrock S1 - Sidebar – Industrial Boom S2 - Sidebar – Sporting Events B - Bloody Baluba T - Two-Way Bridge F - Four R’s P - Poor Risk S - Spanglish & Spells H - Heat with Peat T - Trim Sails TE - Total Effort A - All the Details R - Rebels & Monarchs RG - Radiant Goals
they tried to save ashes of a famous martyr housed in the pagoda where the attack occurred. The wave visualization is a useful device for visual integration of themes captured when using higher frequency filters but missed with lower frequency filters.
5.3
Comparison of Theme Maps
The MDS-based island visualization that results from a specific subchunking strategy presents a useful thematic organization of the text. In Figures 11 and 12, a top view of the islands is augmented with manually generated theme labels and divisions.
Politics of Lemass
Industry and Sidebar Stories
Lemass - Personal
As shown in Table 2, the Ireland article contains three photo captions or sidebar stories inserted toward the beginning of the article, interrupting the narrative flow and introducing unrelated topics to the current discourse. The writing styles for the two articles are very different. In the Buddhist article, the author uses transition paragraphs and takes the reader on an orderly transit across the topics. In the Ireland article, the author jumps from topic to topic, challenging the reader to keep the numerous topics straight through the tangled narrative.
5.2
Comparison of Break Points
The MRL wavelet composite energy for the Ireland article, shown in Figure 10, does a very good job of tracking the paragraph breaks with spikes downward in the signal for at least one MRL — 6, 7, or 8. These three signals collectively catch at least twothirds of the editor-imputed paragraph break points and all but one author subheading (the “All the Details” subheading at paragraph 24). Amazingly tiny dips in energy occur even at the mention of a name, such as John Kennedy, with no other supporting discussion. The paragraph breaks in the Buddhist article are not so easily identified. However, six out of the seven subheadings are identified with dips in the MRL signals shown in Figure 9. The different writing styles of the two authors are evident here.
Social Fabric of Ireland
Mythology
Figure 11: The top island view for the Ireland article showing major themes. See also CP5.
History of Conflict
Violent Attacks by Diem Regime on Buddhists
Missed Opportunity of Regime to Make Peace
Most Recent Attack at Pagoda
domestic
Attacks in Saigon abroad
Political Repercussions Martial Law - Formal Response of Regime to Buddhist Uprising
Figure 12: The top island view for the Buddhist article showing major themes. See also CP6.
Figure 10: Composite energy from Ireland article with dotted lines at editor-imputed paragraph breaks. In both the Ireland and the Buddhist articles, the wavelet decomposition identifies additional dips within paragraphs that catch fine theme shifts. A good example is the dip in paragraph 2 for the Buddhist article at MRL 6. The paragraph begins by talking about specific acts of violence directed against the Buddhists, and then switches to a discussion of acts of bravery by the Buddhists as
Figure 12 results from the subchunking shown in Figure 2. An MDS projection using the author’s subheadings as theme breaks produces theme maps very similar to ours. The narrative order is indicated on the top view island maps using solid black arrows in Figures 13 and 14 for the Ireland and Buddhist articles, respectively. Several author subheadings are also indicated for MRL 8 (in green) using white arrows. Again, the very different writing styles of the authors are obvious as the Buddhist narrative flows easily across the theme map, while the Ireland article’s narrative flow is scattered.
6.1.2
Heat with Peat
Sidebars Trim Sails
Bloody Baluba
Four R’s Poor Risk
Investment paragraph from Bloody Baluba
Intro Holy Ireland Porther Shamrock
All the Details Conclusion Spanglish & Spells (Myths)
Figure 13: The top view of the islands for the Ireland article show the interplay of theme map and the narrative. See CP7. Intro Details of Recent Attack
History of the Buddhist Opposition
Crackdown Conclusion Rope Trick (Other Attacks)
Ugly American Anti, Anti, Anti Curfew & Article 44
Figure 14: The top view of the islands for the Buddhist Article shows the interplay of theme map. See also CP 8.
6
STRENGTHS AND WEAKNESSES
We investigate the strengths and weaknesses of TOPIC ISLANDSTM and compare them to other prevailing text browsing systems including TileBar and Xsoft. The discussion is based on the example presented in Section 5.
6.1
Innovative Design
In many ways we believe that TOPIC ISLANDSTM is a successful attempt to visualize textual data. Its innovative design represents many revolutionary breakthroughs in visualization and analysis of text documents.
6.1.1
Multiresolution Analysis
Our wavelet-based topic-discrimination engine is capable of analyzing textual data with varying degrees of context locally, in the highest possible grains of detail. Different wavelets can be used to analyze different writing styles or to bring out various characteristics of a single article. The fact that our algorithm successfully identifies nearly all the story inserts as well as the major theme changes in Figures 12 and 13 reflects the strength of our design.
Stereoscopic Text Visualization
We share a fundamental design concept with Xsoft that a document browser should always include the “text” during data navigation and exploration. A real challenge for us is to present the discrete multiresolution wavelet energy effectively alongside the text. Our novel stereoscopic image solution in Figure 8 represents a one-of-a-kind text visualization technique to display text attributes (e.g., energy wave) without expensive contouring, textual mapping, and data occlusion of a 3D rendering manifold. Our solution has fewer side effects than mapping the energy to color or font size, which are the obvious choices for many visualization systems.
6.1.3
High-Dimensional Display
The visualization in Figure 3 shows the multiresolution clustering of related topics of a document using a multidimensional scaling (MDS) based display. The scatterplot technique, using the similarities among topics, is a more robust context-sensitive option (over the color-coding scheme in TileBar) as the overall topic distribution of a document is portrayed. Highlighting the islands that contain user queries further strengthens the performance of the system.
6.2
Shortcomings
Our preliminary results also expose the shortcomings of some of our current approaches. The syntactically complex writing styles of many articles can create unpredictable and noisy input signals to the wavelet analysis. The crude nature of the piecewise constant Haar wavelets may not be the optimal basis function for the decomposition. Additionally, our prototype so far has not been able to predict the optimal MRLs from a wavelet hierarchy without human intervention. Many other processes, such as creating the digital signal for the wavelet engine, may require a particular set of run-time parameters to achieve optimal results. We have not yet performed an exhaustive sensitivity analysis to fully automate the selection of these parameters. By far the most important discovery of our initial investigation is that the global extremum (maximum or minimum point) of the wavelet signal is not nearly as important as the local extremum (the highest or lowest in the finite neighborhood). Visualization is the most successful part of our project; we are using TOPIC ISLANDSTM to visualize the performance of our wavelet engine.
7
FUTURE WORK
New and improved features are in the pipeline for our prototype and include • • • •
an extension of this work to cross-document analysis an extension of text query analysis to channel energy data a rule-based wavelet engine to handle a variety of documents a statistic-based power words and power sentences generator for individual island characterization at each MRL • a query energy visualization using topological morphing.
Some of these enhancements extend the theoretical foundations of our wavelet engine, while the others improve the exploration power of the visualization front-end. In the long run, we wish to include ontological extensions to strengthen the query capability, a database management system to handle the corpus metadata, a smart wavelet engine to incorporate the latest digital library technology, and a client-server model to support network environment operations.
ACKNOWLEDGMENTS Research in the TOPIC-O-GRAPHYTM technology and development of the TOPIC ISLANDSTM prototype is sponsored by the P1000 Project of the Office of Research and Development. Enhancements to this technology are also being funded by the Defense Advanced Research Projects Agency (DARPA). We also wish to thank Scott Decker, Vern Crow, Grant Nakamura, David McKinnon, Frank Ryan, Sharon Eaton, Irene Schwarting, Jim Thomas, and Renie McVeety who provided assistance of many forms throughout this research. In 1997, we applied for a U.S. patent for the TOPIC-O-GRAPHY technology.
REFERENCES
[12] Nancy E. Miller and Pak Chung Wong, A New Paradigm of Wavelet-Based Text Data Retrieval, PNNL-SA-29980, 1998. [13] G.M. Nielson, I.H. Jung and J. Sung. Haar Wavelets Over Triangular Domains with Applications to Multiresolution Models for Flow Over a Sphere. In Proceedings of IEEE Visualization ’97, October 1997. ACM Press. [14] George G. Roberston, Stuart K. Card, and Jock D. Mackinlay. Cone Trees: Animated 3D Visualizations of Hierarchical Information. In Proceedings of CHI 91, pages 181188, 1991. ACM Press.
[1]
A. Bookstein, S.T. Klein, and T. Raita. Clumping Properties or Content-Bearing Words. Journal of the American Society for Information Science, 49(2):102-114, 1998.
[15] George G. Roberston and Jock D. Mackinlay. The Document Lens. In Proceedings of UIST ’93, pages 101-107, 1993. ACM Press.
[2]
Stuart K. Card, George G. Robertson, and W. York. The WebBook and the WebForager: An Information Workspace for the World Wide Web. In Proceedings of CHI 96, ACM Conference on Human Factors in Software, pages 111-117, 1996. ACM Press.
[16] David A. Rushall and Marc R. Ilgen. DEPICT: Documents Evaluated as Pictures. In Proceedings of IEEE Information Visualization ’96, pages 100-107, Los Alamitos, CA, October 1996. IEEE CS Press.
[3]
Stephen G. Eick and Joseph L. Steffen. Visualizing Code Profiling Line Oriented Statistics. In Proceedings of Visualization ’92, pages 210-217, Los Alamitos, California, October 1992. IEEE CS Press.
[4]
M.W. Eyesenck and M.T. Keane. Cognitive Psychology: A Student’s Handbook. Lawrence Erlbaum Associates, Hillside, New Jersey, 1993.
[5]
Taosong He, Sidney Wang, and Arie Kaufman. WaveletBased Volume Morphing. In Proceedings of IEEE Visualization ’94, pages 85-92, Los Alamitos, CA, October 1994. IEEE CS Press.
[6]
Marti A. Hearst. Multi-Paragraph Segmentation of Expository Text. In Proceedings of 32nd Annual Meeting of the Association for Computational Linguistics, Las Cruces, NM, 1994.
[7]
[8]
[9]
Marti A. Hearst. TileBars: Visualization of Term Distribution Information in Full Text Information Access. In Proceedings of ACM SIGCHI Conference on Human Factors in Computing Systems (CHI), pages 59-66, Denver, CO, 1995. Marti A. Hearst and Chandu Karadi. Cat-a-Cone: An Interactive Interface or Specifying Searches and Viewing Retrieval Results Using a Large Category Hierarchy. In Proceedings of the 20th Annual International ACM SIGIR Conference, July 27-31, 1997, Philadelphia, PA. ACM Press. Teuvo Kohonen. Self-Organizing Maps. Springer-Verlay, Berlin, 1995.
[10] Jock D. Mackinlay, George G. Roberston, and Stuart K. Card. Perspective Wall: Detail and Context Smoothly Integrated. In Proceedings of CHI 91, ACM Human Factors in Computer Systems, pages 173-179, 1991. ACM Press. [11] Stephane G. Mallat. A Theory for Multiresolution Signal Decomposition: The Wavelet Representation. IEEE Transactions on Pattern Analysis and Machine Intelligence, 11(7):674-693, 1989. IEEE CS Press.
[17] G. Salton and Amit Singhal. Automatic Text Theme Generation and the Analysis of Text Structure. TR 94-1438. Department of Computer Science, Cornell University, July 1994. [18] Hai Tao and Robert Moorhead. Progressive Transmission of Scientific Data Using Bi-orthogonal Wavelet Transform. In Proceedings of IEEE Visualization ’94, pages 93-99, Los Alamitos, CA, October 1994. IEEE CS Press. [19] James A. Wise, James J. Thomas, Kelly Pennock, David Lantrip, Marc Pottier, Anne Schur, and Vern Crow. Visualizing the Non-visual: Spatial Analysis and Interaction with Information from Text Documents. In Proceedings of IEEE Information Visualization ‘95, pages 51-58, Los Alamitos, CA, October 20-21, 1995. IEEE CS Press. [20] Pak Chung Wong and R. Daniel Bergeron. Authenticity Analysis of Wavelet Approximations in Visualization. In Proceedings of IEEE Visualization ’95, pages 184-191, Los Alamitos, CA, October 1995. IEEE CS Press. [21] Pak Chung Wong and R. Daniel Bergeron. Brushing Techniques for Exploring Scientific Volume Datasets. In Proceedings of IEEE Visualization ’97, October 1997. ACM Press. [22] Pak Chung Wong and R. Daniel Bergeron. Dual Multiresolution HyperSlice for Multivariate Data Visualization. In Proceedings of IEEE Information Visualization ’96, Los Alamitos, CA, October 1996. IEEE CS Press. [23] Pak Chung Wong and R. Daniel Bergeron. Multiresolution Multidimensional Wavelet Brushing. In Proceedings of IEEE Visualization ’96, pages 141-148, New York, October 1996. ACM Press. [24] Z. Zhu, R. Machiraju, B. Fry, R.J. Moorhead. Waveletbased Multiresolutional Representation of Computational Field Simulation Datasets. In Proceedings of IEEE Visualization ’97, October 1997. ACM Press.