Hindawi Publishing Corporation Archaea Volume 2014, Article ID 898453, 18 pages http://dx.doi.org/10.1155/2014/898453
Research Article Towards a Computational Model of a Methane Producing Archaeum Joseph R. Peterson,1 Piyush Labhsetwar,2 Jeremy R. Ellermeier,3 Petra R. A. Kohler,3 Ankur Jain,2 Taekjip Ha,2,4 William W. Metcalf,3 and Zaida Luthey-Schulten1,2,4 1
Department of Chemistry, University of Illinois at Urbana Champaign, Urbana, IL 61801, USA Center for Biophysics and Computational Biology, University of Illinois at Urbana Champaign, Urbana, IL 61801, USA 3 Department of Microbiology, University of Illinois at Urbana Champaign, Urbana, IL 61801, USA 4 Department of Physics, University of Illinois at Urbana Champaign, Urbana, IL 61801, USA 2
Correspondence should be addressed to Zaida Luthey-Schulten;
[email protected] Received 14 November 2013; Accepted 18 December 2013; Published 4 March 2014 Academic Editor: Gustavo Caetano-Anoll´es Copyright © 2014 Joseph R. Peterson et al. This is an open access article distributed under the Creative Commons Attribution License, which permits unrestricted use, distribution, and reproduction in any medium, provided the original work is properly cited. Progress towards a complete model of the methanogenic archaeum Methanosarcina acetivorans is reported. We characterized size distribution of the cells using differential interference contrast microscopy, finding them to be ellipsoidal with mean length and width of 2.9 𝜇m and 2.3 𝜇m, respectively, when grown on methanol and 30% smaller when grown on acetate. We used the single molecule pull down (SiMPull) technique to measure average copy number of the Mcr complex and ribosomes. A kinetic model for the methanogenesis pathways based on biochemical studies and recent metabolic reconstructions for several related methanogens is presented. In this model, 26 reactions in the methanogenesis pathways are coupled to a cell mass production reaction that updates enzyme concentrations. RNA expression data (RNA-seq) measured for cell cultures grown on acetate and methanol is used to estimate relative protein production per mole of ATP consumed. The model captures the experimentally observed methane production rates for cells growing on methanol and is most sensitive to the number of methyl-coenzyme-M reductase (Mcr) and methyl-tetrahydromethanopterin:coenzyme-M methyltransferase (Mtr) proteins. A draft transcriptional regulation network based on known interactions is proposed which we intend to integrate with the kinetic model to allow dynamic regulation.
1. Introduction Molecular signatures of ribosomal rRNA evolution were used by Woese and his associates to establish the three primary groupings of living organisms: archaea, bacteria, and eukarya [1–6]. Although the ancestral or communal origins of these three domains remains a matter of debate, increasingly large amounts of data regarding the RNA phylogeny and molecular makeup of cells accumulated over the last several decades continue to support the division between the three primary domains [7]. Furthermore, comparative analysis of the sequences of proteins and RNA involved in translation provides strong evidence that the existence of highly developed translational machinery was a necessary condition for the emergence of cells as we know them [8, 9]. Molecular signatures in the ribosome—idiosyncrasies in its rRNA [7]
and/or r-proteins characteristic of each domain of life—were locked in place at the time of evolutionary divergence, destined to become molecular fossils. As Woese postulated in his theory of genetic annealing, ancestors of the three primary groupings of organisms developed into a number of increasingly complex cell types. The various subsystems of the cell “crystallized,” that is, became refractory to lateral gene transfer with the translation apparatus probably crystallizing first. While the rRNA phylogeny is supported by phylogenetic analysis of concatenated protein sequences of the fundamental genes in the translational machinery, the effects of lateral gene transfer (LGT) among organisms in the three domains of life are clearly seen in the aminoacyl-tRNA synthetases, a modular subsystem that charges tRNA, and helped to establish the genetic code [10–12].
2 As one moves beyond the information processing systems of translation and transcription, an increasing amount of LGT also extends into other cellular networks. If the early community of cells was more like a modern bacterial consortium, the cells could have cross-fed one another not only genetically but also metabolically. Every improvement in translation that increased its accuracy would have permitted new proteins to emerge, which in turn could have further developed the metabolic pathways within cells. With metabolic functions being modular in nature, these genes could be transferred laterally. Many cases are now known in which a bacterial metabolic gene occurs in one or a few archaea or vice-versa and has prompted the search for signatures in the metabolic networks that are distinctive of the archaea [13–16]. Many theories of early life argue for a reducing environment in which anaerobic organisms would likely be the first to have evolved [17]. A phylogenetic analysis of proteins that are distinctive of archaea and its main subgroups has led to hypotheses in which methanogens—anaerobic archaeal organisms that derive all of their metabolic energy by reduction of single carbon compounds to methane—feature prominently in the early evolution of life. Methanogens are phylogenetically diverse group of strict anaerobes estimated to produce a billion tonnes of methane per year [18]. They are found in niche environments including shallow and deep hydrothermal vents [19], swamps, paddy fields, land fills [20], hot-springs, and oxygen-depleted sediments beneath kelp beds [18]. The Methanosarcineae are the most metabolically diverse methanogens known. Only M. acetivorans and other archaea in the genus Methanosarcina use all four known metabolic pathways for methanogenesis under different growth conditions. While systems biology studies have long used E. coli as a model organism in understanding the response of cellular networks to changes in various environmental conditions or gene knock-outs, computational models of methanogen metabolism are just beginning to be established [21, 22]. Based in part on our own work modeling genetic switches in E. coli and the effects of heterogeneity in protein expression on the metabolism of large populations of bacteria [23], we present here our progress toward a comprehensive computational model of a methanogen. In doing so we have been profoundly influenced by our association with Carl Woese, who published the first genome of a methanogen, Methanocaldococcus janaschii, and greatly inspired our interest in characterizing both the translational and metabolic machinery of methanogenic archaea [24]. We have focused our study on M. acetivorans for several reasons. First, the organism can grow on three classes of substrates demonstrating use of three methanogenic pathways: (1) methylotrophic pathway, wherein the organism grows on methyl containing substrates including methanol, tri-, di-, and mono-methylamine (TMA, DMA, MMA), and methylsulfides (DMS, MMS); (2) acetoclastic pathway, wherein the organism grows on acetate; (3) carboxidotrophic pathway, wherein carbon monoxide is oxidized to acetate, formate, and methane [25–27]. Second, the genome of M. acetivorans has been sequenced [25], and considerable effort has been
Archaea expended towards determining the regulation of gene expression of methanogenesis proteins [28]. Third, the genome exhibits considerable homology to two other well studied members of the genus Methanosarcina: M. barkeri and M. mazei and, therefore, a model for one will likely be easily modified to work for the others. Developing a model of the archaeum requires characterization of its physical and biochemical properties. To that end the physical dimensions of the cells, including their length and width, were measured. Modeling also requires estimation of protein/ribosome copy numbers in single cells; the single molecule pulldown (SiMPull) technique [29]—a marriage of the conventional pull-down assay with single molecule fluorescence microscopy—was used to measure the mean copy number of two key proteins. The first protein measured was the 𝛾 subunit (McrG) of methyl-coenzymeM reductase (Mcr) complex as a proxy for number of Mcr complexes, which catalyze the methane producing step of methanogenesis. Second, the ribosomal protein Rpl18p in the large subunit of ribosome was counted as a proxy for the number of ribosomes. A kinetic model for methanogenesis pathways capable of representing growth on methanol and acetate was developed using RNA-seq data and kinetic parameters from the literature. This model captures several features of comparable experimental data [30, 31]. The model further allows us to probe the sensitivity of the growth (and indirectly the methane production) on the copy number of each protein, directing further experimental study. In an effort to extend the model to simulate growth on other substrates, we compile a list of all experimentally known and hypothetical transcriptional regulatory interactions. These interactions will be used to modulate protein expression as a function of growth substrate that we can marry with the kinetic model in future.
2. Experimental and Computational Methods 2.1. Strains, Media, and Growth Conditions. M. acetivorans C2A strains (wild-type, WWM 889 :: SNAP-mcrG, and WWM890 :: rpl18p-SNAP) were grown in single cell morphology [48] at 37∘ C in high-salt (HS) medium containing either 125 mM methanol or 40 mM acetate [49]. Handling and manipulation of all strains were carried out under strict anaerobic conditions in an anaerobic glove box, using sterile anaerobic media and stocks. Solid media plates (HS medium, 1.5% agar) were used for selection of SNAP integrants in two steps: puromycin (Research Products International, Mt. Prospect, IL) at a final concentration of 2 𝜇g/mL was used for selection of strains carrying puromycin transacetylase (pac) and the purine analogue 8-aza-2,6-dia-minopurine (8ADP) (Sigma, St. Louis, MO) at a final concentration of 20 𝜇g/mL was used for selection against the hpt gene [50– 52]. All plates were incubated in an anaerobic intrachamber incubator [53]. Standard methods were used throughout for isolation and manipulation of plasmid DNA from E. coli. DNA purification was performed using appropriate kits (OmegaBio-Tek, Norcross, GA). Growth was quantified by measuring the optical density at 600 nm (OD600 , Milton Roy
Archaea Company Spectronic 21 spectrophotometer) and generation times were calculated during exponential growth. 2.2. Genetic Constructs in Methanosarcina Acetivorans. Genetic fusions with SNAP were made by first constructing plasmids with the SNAP gene near an aphII cassette flanked by NheI restriction sites. pJK1048A was used as the template for making fusions to the C-terminus of genes of interest, while pJK1047B was used for fusions to the N-terminus. DNA oligonucleotides (IDT, Iowa City, IA) with homology to the template and gene of interest were used to amplify the SNAP-aphII constructs. The Lambda Red method was then used to integrate SNAP aphII construct into specific N- or Cterminal locations [54], selecting for kanamycin resistance. The mcrG and rpl18p genes are carried on cosmids created during an M. acetivorans cosmid library construction previously performed in the Metcalf lab (Zhang and Metcalf, unpublished). The aphII allele was then excised from the cosmid by NheI restriction digest, leaving an in-frame SNAP fusion to the gene of interest. The wild type copies of the genes in question were replaced by the SNAP tagged versions using homologous recombination, as previously described [51]. 2.3. Cell Morphology from DIC Microscopy. Cell cultures were grown into exponential phase to an OD600 of 0.6 and 1 mL of cultures was removed and centrifuged at 14,000 g for 5 minutes. The cell pellet obtained was resuspended in 100 𝜇L HS media without resazurin, and the cells were observed using the differential interference contrast (DIC) microscopy technique on a Zeiss LSM700 confocal microscope. 2.4. RNA-Seq Analysis. M. acetivorans C2A wild type was adapted to methanol and acetate for 33 generations. The total RNA was isolated from early exponential phase cultures (OD600 = 0.4) using TRIzole (Invitrogen, Carslbad, CA) and the Zymo Direct-zol RNA MiniPrep kits (Zymo Research, Irvine, CA). The RNA samples were depleted of the 16Sand 23S-rRNA through hybridization to complementary biotinylated oligonucleotides and subsequent removal with streptavidin-magnetic beads (modified from [55]). Construction of cDNA libraries and high throughput sequencing of RNA was carried out by the Roy J. Carver Biotechnology Center at University of Illinois at Urbana Champaign. All measurements were done in triplicate. The Rockhopper [56] bacterial RNA-seq analysis software was used to map RNA reads to the M. acetivorans genome using the default parameters with verbose output enabled. Reads per kilobase per million reads (RPKM) values from the three replicates were averaged and used in subsequent analysis. 2.5. SiMPull Experiments. The single molecule pulldown, or SiMPull technique [57], was used to determine mean protein counts for two proteins in M. acetivorans. Briefly, SiMPull is a microscopy technique wherein a fluorescently labeled protein of interest is “captured” out of cell lysate by an immobilized antibody attached to a passivated microscope slide. In these experiments, the genetic SNAP-tag system (New England
3
SNAP
mcrG
mcrA
(a) rpl19e
rpl18p
SNAP
(b)
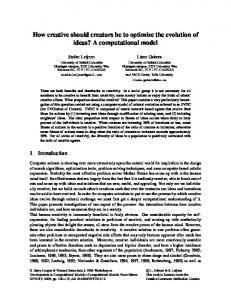
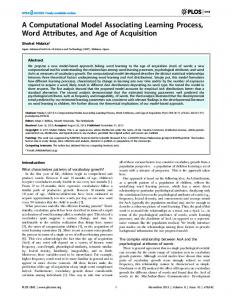
Figure 1: Genetic constructs showing position of SNAP relative to our protein of interest on chromosome of M. acetivorans. (a) Nterminal label on mcrG gene. (b) C-terminal label on rpl18p gene.
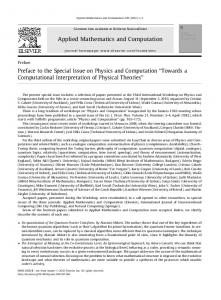
Biolabs (NEB), Ipswich, MA) was used for labeling either the N- or C-terminus of each protein studied (Figure 1). Labeled mutants were grown to exponential phase and harvested at an OD600 of 0.6. Cell density was estimated using a Petroff-Hausser counting chamber. One milliliter of cell culture was centrifuged at 14,000 g for 5 minutes to obtain cell pellets which were subsequently lysed upon re-suspending the cells in 100 𝜇L of the recommended SNAP labeling buffer: 50 mM Tris-Hcl (pH 7.5); 100 mM NaCl; 0.1% Tween 20; 1 mM DTT (NEB) with 1 𝜇g DNAse. The cell lysate was then incubated with AlexaFluor 488 (NEB) at a final concentration of 10 𝜇M at room temperature for one hour. In order to remove free dye, samples were washed three times with SNAP labeling buffer and concentrated using 10 K Amicon ultra centrifugal filters. SiMPull analysis was performed as previously described [57]. Microscope slides were coated with polyethylene glycol (PEG) which minimizes nonspecific biomolecule adsorption. Surfaces were doped with 2–5% biotin-conjugated PEG during slide preparation. The bait recruiting rabbit antiSNAP antibody (NEB) was immobilized onto the surfaces by successively flowing in NeutrAvidin (4 𝜇M) and a biotin conjugated antirabbit antibody (20 nM), as depicted in Figure 3(a). Lysate was washed away and the pulled-down proteins were imaged using a prism type Total Internal Reflection Microscopy (TIRF) with excitation at 488 nm. The resulting images (see Figure 3(b)) were analyzed using custom software as described previously [29], to quantify single spots in the field of view of the microscope. A single spot may correspond to more than one fluorophore which can be discerned by the observation of multiple discrete photobleaching steps (as in the case of Rpl18p, Figure 9) indicating that results are lower bounds on the actual number of proteins. 2.6. Kinetic Model. RNA-seq expression data for M. acetivorans growing on methanol and acetate [59] provide enough parameters for a preliminary kinetic model of the methanogenesis pathways (Table 1). The model includes reactions for the methylotrophic, acetoclastic, and electron transport pathways shown in Figure 4. An additional reaction simulating biomass growth is included to the model that converts ATP created by the methanogenesis driven proton gradient into cell mass. Because 98% of carbons that come into methanogenesis leave as CH4 or CO2 [60], ATP is assumed
4
Archaea
Table 1: Kinetic model of methanogenesis. Reactions are from iMB745 [22]. Rate constants used in the kinetic model are taken from the literature where indicated or were fit to experiments of growth on methanol. Water molecules and the intracellular protons (H+ ), which are shown for completeness, are assumed to be constant and are not explicitly modeled. The “Type” column specifies the reaction mechanism: B: irreversible bimolecular Michaelis-Menten, B/C: irreversible bimolecular Michaelis-Menten for the two underlined reactants with a constant flux term for the others, which is set to the flux calculated for bimolecular reaction, M: irreversible unimolecular Michaelis-Menten, F: first order reaction. Enzyme Ack Ack Pta Pta Cdh Cdh
MtaCBA1 MtaCBA2 MtaCBA3 Mer Mer Mtd Mtd Mch Mch Ftr Ftr Fmd/Fwd Fmd/Fwd Mtr Mtr Mcr HdrDE Rnf Fpo ATP synthase Cell Massa
Reaction Acetoclastic pathway ATP + Ac → AcP + ADP ADP + AcP → Ac + ATP CoA + AcP → AcCoA + Pi AcCoA + Pi → CoA + AcP AcCoA + 2Fdox + H4SPT + H2 O → CO + CoA + 2Fdred + MeH4SPT + 2H+ CO + CoA + 2Fdred + MeH4SPT + 2H+ → AcCoA + 2Fdox + H4SPT + H2 O Methylotrophic pathway + MeOH + CoM + H → MeCoM + H2 O MeOH + CoM + H+ → MeCoM + H2 O MeOH + CoM + H+ → MeCoM + H2 O MeH4SPT + F420 + H+ → MethyleneH4SPT + F420 H2 MethyleneH4SPT + F420 H2 → MeH4SPT + F420 + H+ MethyleneH4SPT + F420 + 2H+ → MethenylH4SPT + F420 H2 MethenylH4SPT + F420 H2 → MethyleneH4SPT + F420 + 2H+ MethenylH4SPT + H2 O → FormylH4SPT + H+ FormylH4SPT + H+ → MethenylH4SPT + H2 O FormylH4SPT + Mfr → H4SPT + H+ + FormylMfr H4SPT + H+ + FormylMfr → FormylH4SPT + Mfr FormylMfr + 2Fdox + H2 O → CO2 + 2Fdred + H+ + Mfr CO2 + 2Fdred + H+ + Mfr → FormylMfr + 2Fdox + H2 O Shared pathway + + H + MeH4SPT + 2Nac + CoM → H4SPT + 2Na+e + MeCoM H4SPT + 2Na+e + MeCoM → H+ + MeH4SPT + 2Na+c + CoM MeCoM + CoB → CoBCoM + CH4 Electron transport pathway CobCoM + MphenH2 + 2H+ → Cob + CoM + Mphen + 2H+e 2Fdred + 3Na+c + Mphen + 2H+ → 2Fdox + 3Na+e + MphenH2 F420 H2 + Mphen + H+ → F420 + MphenH2 + 2H+e Cell growth ADP + Pi + 4H+e → ATP + H2 O + 3H+ ATP → ADP + Pi + Cell mass
𝑘cat (s−1 )
𝐾𝑀 (mM)
Type
Citation
1055 1260 1500 65.8
0.0713 0.098 0.186 0.18
B B B B
[32] [33] [34] [35]
358.5
7.1
B/C
[36]
1130
0.9
B/C
[37]
17 15 5 119.7 815 2650 408 701 100 1787 262 1225 175
50 50 50 0.25 0.3 0.065 0.065 0.57 0.57 0.1 0.1 0.02 0.02
M M M B B B B M M B B B/C B/C
[38, 39] [38, 39] [38, 39] [40] [41] [42] — [43] — [42] — [44] —
50 50 5.0
3.7 3.7 2
B B B
— — [45]
74 80 80
0.092 0.1 0.1
B B/C B
[46] — —
16 0.125b
0.1 —
B/C F
[47] [22, 31]
The reaction that converts ATP into ADP and cell mass, generating proteins via the stoichiometry in Table 2. b This rate is in units of hr−1 which is equivalent to an 8 hr doubling time for M. acetivorans.
a
to be a good analog for the growth of the colony. A model schematic is shown in Figure 5. The kinetic model in Table 1 is based on the reactions from metabolic model iMB745 [22]. The reactions are modeled as a set of coupled differential equations (ODEs) which are solved deterministically using the COPASI software [61]. Rate data for 17 of the 26 methanogenesis reactions were taken from the literature [32–38, 40–47] as reported in the BRENDA database [62]. The other 9 parameters were fit to
experiments wherein a cell culture was grown on 125 mM methanol [30]. Three types of reaction mechanisms are used to model the reactions: irreversible unimolecular MichaelisMenten, irreversible bimolecular Michaelis-Menten, and first order. In cases with more than two reactants, the two most important reactants were selected for bimolecular reaction and a constant flux reaction was added that converts the additional reactants to products at the same flux as the rate of bimolecular reaction. In bimolecular reactions, 𝑘cat and
Archaea
5
𝐾𝑀 for both substrates were assumed to be the same. When missing from the literature, 𝐾𝑀 parameters for reverse reactions were assumed to be the same as that for forward reactions (e.g., Mtd, Mch, Ftr, and Fmd/Fwd). The forward and reverse rate constant are known for Mer giving a ratio of about 6.8. This ratio was assumed for Mtd, Mch, Ftr, and Fmd/Fwd as they are in the same pathway. Because Mtr is known to be nearly at equilibrium [63], we assumed the forward and reverse rates were the same. A value of 50 s−1 was chosen for this reaction. Finally, Rnf and Fpo were assumed to have similar rates to the Hdr protein as they also catalyze the motion of a similar number of ions across the cell membrane. The reactions modeled and rate constants used in the model can be found in Table 1. A value of 15.4 grams of cell mass per mole of ATP [22, 64] was used in the biomass expression to match the stationary phase mass of a culture calculated from experimental OD420 measurements [31]. The rate of the cell mass reaction was set to match the approximate maximal doubling time of 8 hours known for growth on methanol. The accumulation of biomass in the model leads to an accumulation of enzymes; for each gram of biomass, 63% is assumed to be proteins (in accordance with [22]) of which some are the methanogenic enzymes that themselves catalyze growth. The results of RNAseq experiments provide estimates for the stoichiometry of methanogenic enzymes per mole ATP. A linear relationship between methanogenic proteins and mRNA was assumed. We determined the relative mass of protein as 𝑁genes
0.63𝑀total = ∑ 𝑎𝑖 × 𝑚Protein,𝑖 ,
(1)
𝑖=1
where the coefficients 𝑎𝑖 are the mass fraction of 𝑖th protein calculated with (2). From the value of 𝑎𝑖 and the molecular weight of protein 𝑚protein,𝑖 , the number of moles of protein per mole of ATP was determined; these values are provided in Table 2. We have 𝑎𝑖 =
𝑚protein,𝑖 𝑁 ∑𝑖=1genes
𝑚protein,𝑖 × RPKM𝑖
.
(2)
The model was solved in a 1 mL volume with an initial cell mass of 0.1 mg, calculated from the optical density at the start of growth [30, 31]. The concentrations of water and internal protons are assumed to be constant and therefore their effect on the rate constants is implicit and not explicitly modeled. The concentration of extracellular protons was initially set to physiological pH of 7 and protons are modeled explicitly in the ATP synthase reaction. This reduces the complexity of most of the reactions to either one or two substrate MichaelisMenten kinetics. Initial concentrations of ATP, ADP, and Pi were set to physiological concentrations of 10, 1, and 10 mM, respectively [47]. Intermediate energy carriers (CoB, CoM, ferredoxin, etc.) initial concentrations were assumed to be 0.009 mM, which was calculated from the measured value of 474 nmol/g protein measured for coenzyme F420 in M. barkeri grown on methanol [65].
Table 2: A list of enzyme stoichiometries in the cell mass reaction. The moles of the indicated protein that are created from 1 mole of ATP calculated in Section 2.6. Enzyme Ack ATP Cdh Fmd/Fwd Fpo Ftr HdrDE Mch Mcr Mer MtaCBA1 MtaCBA2 MtaCBA3 Mtd Mtr Pta Rnf
Methanol (𝜇mol/mol) 37.5 132.0 151.0 57.4 27.8 9.60 45.3 30.0 321.8 25.5 1.97a 10.78 0.20a 36.9 112.4 36.2 22.8
Acetate (𝜇mol/mol) 102.0 406 134.4 6.4 3.96 4.72 38.1 11.6 398 1.26 3.57 5.66 141.0 1.69 144.4 171.0 17.1
a
Expression values of MtaCBA1 and MtaCBA3 were adjusted such that their ratios to MtaCBA2 were in agreement with the protein expression values measured experimentally [30].
2.7. Transcriptional Model. A putative model of transcriptional regulation was constructed using experimental data and inferred regulatory interactions based on gene annotation and sequence homology with proteins known to be regulated in other archaea. Two different models were developed: the first involving only direct interactions and the second involving indirect and hypothetical interactions. The direct interactions model was based on experimental evidence of actual binding of the activator/repressor to the promoter region causing up/downregulation of target gene. In addition, genes that showed differential expression and contained the known promoter region, were included in the direct model. The indirect interaction model includes interactions reported in the literature where proteins were differentially expressed under different growth conditions or when expression correlated with a regulator that is differentially expressed, but no direct evidence for the interaction exists. Strength of interactions in the direct and indirect models were taken from the literature; when the transcriptional regulator was overexpressed, the strength of interactions was normalized by the overexpression level. A full enumeration of the literature used to develop these transcriptional regulation models is reported in Section 3.5.
3. Results and Discussion 3.1. Cell Characterization. DIC images of methanol and acetate grown cells were obtained and analyzed in order to quantify their physical dimensions. As seen in Figure 7(a), DIC microscopy yields enhanced contrast images by taking
6 advantage of a gradient in optical path length between beams of light passing through adjacent points in the illuminated sample. The enhanced contrast is directional and appears strongest along the shear vector. No contrast occurs perpendicular to the shear vector, which can make the demarcation of cell boundaries difficult. A Hilbert transform has been used in the past with DIC microscopy in order to aid in image segmentation [66]. Custom Matlab scripts were developed to normalize and apply a Hilbert transform to the DIC images. The transformed image shows clearer boundaries around the imaged cells (Figure 7(b)). The CellProfiler software was used to identify cell boundaries [67] and measure the cells’ dimensions. Figure 6 shows the distributions of lengths and widths obtained from approximately 10,000 identified cells. The mean length and width observed were 2.9 𝜇m and 2.3 𝜇m for methanol grown cells, while for acetate grown cell they were 2.3 𝜇m and 1.7 𝜇m, respectively. Assuming the cells to be ellipsoid in shape, volume of a methanol grown cell would be approximately 9 fl and that for acetate is approximately 4 fl. Cells have mean aspect ratios of 1.27 for methanol grown cells and 1.33 for acetate grown cells. 3.2. SiMPull Measurements. SiMPull was used to measure the mean copy numbers of two proteins integral to the growth and physiology of methanogens. The first is the 𝛾 subunit of the methyl-coenzyme M-reductase (Mcr) complex. This complex is a lynchpin in the metabolic network, catalyzing the last step of methanogenesis that produces methane. The second is Rpl18p, a ribosomal protein counted as proxy for the ribosome, the protein producing machinery of the cell. We have inserted SNAP tags at the N-terminus of the mcrG gene and at the C-terminus of the rpl18p gene (Figure 1). The fusion of SNAP at the C-terminus of Rpl18P exposes it to the outside of the ribosome enabling the immobilized anti-SNAP proteins to capture whole ribosomes during the SiMPull assay (see Figure 2). Using these calibration curves (Figure 8), along with estimates of cell density prior to lysing from cell counting experiments, copy numbers of Mcr and ribosomes per cell were obtained (Table 3). Mcr numbers agree qualitatively with a recent study where Mcr was imaged on TEM immunocytochemistry techniques [68]. 3.3. RNA-Seq Experiments. RNA sequencing experiments were performed in order to elucidate the differential expression of methanogenic enzymes on different growth substrates. Comparison of the ratio of mRNA expression on methanol-grown cells to that of acetate-grown cells shows good agreement with the results of quantitative reverse transcriptase polymerase chain reaction (qrtPCR) data previously reported [69]. However, two discrepancies are observed. The first is that Hdr, which was found to be more highly expressed in methanol-grown cells than in acetate-grown cells, was previously reported to be more highly expressed under acetate growth conditions. This is likely attributable to experimental noise as in both cases the expression ratios are close to 1. The other difference is more pronounced; expression of ATP synthase was found to be 3 times higher on acetate in our experiments, whereas the previously reported results indicate
Archaea Table 3: Mean protein copy numbers per cell for Mcr complex and ribosomes as estimated by dividing concentration of McrG and Rpl18p subunits in cell lysates by number of cells in the culture. All experiments were done with three technical replicates and two biological replicates grown in methanol.
Biol. Rep. 1 2 Biol. Rep. 1 2
Methlyl-coenzyme M-reductase Conc. Cells/mL (nM) 1.1 ± 0.13 (5 ± 2) × 108 0.37 ± 0.03 (8 ± 3) × 108 Ribosome Conc. Cells/mL (nM) 5 (3 ± 1) × 108 27.1 (9 ± 3) × 108
Count/cell 1320 ± 713 273 ± 124 Count/cell 10038 ± 3340 18135 ± 6040
only a two fold enhancement. In spite of this, expression of methanogenic proteins generally agree with previous reports [59, 69], and, importantly, our experiments were run in triplicate and, therefore, offer greater confidence in our results in addition to some means of error estimation. Protein numbers, computed using the assumption that they are linearly proportional to mRNA number from RNAseq, were compared with experimentally measured ones from SiMPull. From [26], we know that OD420 of 1 corresponds to 0.41 ± 0.07 mg dry mass per mL of culture grown on CO. Assuming 63% of this mass being protein and Mcr having 1.2% mass fraction in the proteome, we obtain 3.1 ± 0.5 𝜇g of Mcr per mL of culture or 10.3 ± 1.6 picomoles per mL of culture (molecular weight of Mcr = 300 kDa [70]). Using cell density of 500 million cells per mL of culture at OD420 of 1 (data not shown), we obtain around 12,400 ± 2,000 copies of Mcr per cell grown in methanol and approximately 6,000 for cells grown on CO estimated due to size differences. SiMPull measurements for Mcr in methanol grown cells ranged from 273 to 1320 copies per cell (see Table 3). 3.4. Kinetic Model. A kinetic model of the methanogenesis pathways inM. acetivorans with single-reaction resolution was developed. The model was fit to cell culture growth experimental results reported previously [30] wherein the methanol consumption rate and OD420 of cell culture were studied over time. A comparison of the model fit, seen in Figure 10, demonstrates that the chosen rate parameters capture the methanol behavior within 10%. The cell mass in the culture was calculated from OD420 traces from [30] using the calibration point of 0.41 ± 0.07 mg/mL at OD420 1.0. At maximum growth rate, the model predicts methane formation of 565 nmol/mL × min (slope of simulated curve in Figure 10) compared with 372 ± 69 nmol/mL × min measured experimentally [31]. The model correctly predicts the mass of the cells in culture (within 10%), and it captures the 3 : 1 methane to CO2 efflux ratio that is necessary for the correct redox intermediate behaviors. Using a stoichiometry of 3.5 protons per ATP, as measured in some experiments for other
Archaea
7
Ribosome
Mcr complex
SNAP attachment site McrG Rpl18p
Not to scale
(a)
(b)
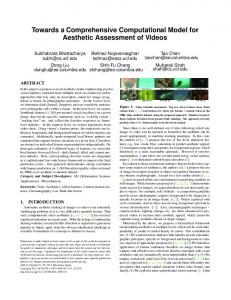
Figure 2: (a) The Mcr complex from M. barkeri (1E6Y [58]) with the McrG subunit shown in red with the SNAP attachment site shown in blue. (b) The large subunit of an archaeal ribosome (Haloarcula marismortui, 4HUB) showing the L18p subunit in red and the C-terminus where the SNAP is attached in blue. These suggest that the position of SNAP is on the outer part of the complexes, which enables capture by the SNAP antibody.
Bound Mcr-SNAP Rabbit anti-SNAP Antirabbit
NeutrAvidin Biotin
PEG Quartz slide (a)
(b)
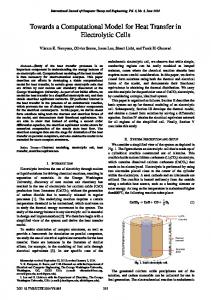
Figure 3: SiMPull experiments for protein count measurement. (a) Anti-SNAP antibody immobilized on a microscope slide using biotin. The antirabbit antibody captures SNAP labeled McrG. (b) A TIRF microscopy image obtained for captured McrG, where each spot corresponds to at least one immobilized protein.
organisms [71], would make the modeled cell mass growth exactly match the experiments. Acetate growth uses a different methanogenesis pathway and is a good test for the rate constants. Using RNA expression values of proteins in acetate-grown cells and the same kinetic parameters obtained from the methanol fit, the results along with experimental results for cells grown in 120 mM acetate [31], shown in Figure 11, were obtained. Cell mass entering stationary phase is of the right level, but the rate of growth is much too high. The model predicts a significant buildup of carbon monoxide, which should be converted to CO2 as that step produces more electrons used to drive protons across the membrane. The methane production rate was determined to be 269 nmol/mL × min, which is less
than the rate of methane production on methanol but is quite a bit higher than experimental measurements of 82 ± 31 nmol/mL × min [31]. This model represents a powerful tool for its ability to be used in testing the sensitivity of cell growth to model parameters such as enzyme copy numbers and rate constants. Moreover, because the growth rate can be thought of as a proxy for the amount of methane produced, understanding its sensitivity to enzyme expression is interesting from a biofuels perspective. The relative sensitivity, 𝑠, is calculated using the standard expression: 𝑠=
𝑥 𝜕𝑌 (𝑥) , 𝑌 (𝑥) 𝜕𝑥
(3)
8
Archaea
EX co2(e)
CO2
co2(e)
h
CO2t
CO2 efflux
CO utilization h2o
Coo co
COt
co(e)
EX co(e)
EX ac(e)
co2
CO
fdred
mfr(b)
Ac
fdred
fdox
h
Fmd/Fwd h2o
h(e)
h
fdox
Formmfr(b) h
ACt2r
h4spt
Acetate utilization
Ftr
ac
mfr(b) pi
Methanol utilization
formh4spt atp h
h
EX meoh(e)
Mch EX tma(e)
tma(e) MEOHt2
h
Mtd MeOH
tma
EX dma(e)
dma(e)
DMAt
com
meoh
Mta
accoa f420-2h2
Cdh
f420-2 h
h
MMA EX mma(e)
mma(e)
h4spt
fdox
Mer Mtb
com
Pta
mleneh4spt
dma
h(e)
coa
pi
f420-2 f420-2h2
h2o
Mtt
h
DMA
actp
h
TMAt2
com
h2o
menylh4spt
TMA
Methylamine utilization
adp
h2o
meoh(e)
h(e)
ACYP 2
Ack
fdred
mh4spt
MMAt
h2o
coa
mma
CO2
h(e)
Mtm
com EX nh4(e)
EX dms(e)
dms(e)
nh4
NH4t
DMSt
dms
CH4St
ch4s
com
na1
Electron transport chain
Mtr na1
nh4
EX na1(e)
fdox
fdred
h4spt
Mts
h
Rnf
na1
EX h(e)
MeCoM EX ch4s(e)
ch4s
na1(e)
com
h
MMS
com
mphen
F4D
f420-2h2
cob
Fpo
Hdr
Mcr
Methylsulfide utilization
mphenh2
hsfd
f420-2
h
CH4
CH4t
Methane efflux
ch4
EX ch4(e)
Figure 4: Methanogenesis pathways in metabolic map of M. acetivorans [22]. Enzymes and metabolites are depicted as nodes while reactions are depicted as edges between these nodes. Enzymes that catalyse reactions are shown as green diamonds and metabolites are shown as red circles. Enzyme names are in black and select metabolite names are in red.
Archaea
9 Proteins
Substrate
Metabolism model EX co2(e)
CO2
co2(e)
h
CO2t
CO2 efflux
CO utilization h2o
Coo COt
co(e)
EX co(e)
Cell mass growth
co
EX ac(e)
co2
CO
fdred
mfr(b)
Ac
fdred
fdox
h
Fmd/Fwd h2o
h(e)
h
fdox
Formmfr(b) h
ACt2r
h4spt
Acetate utilization
Ftr
ac
mfr(b) pi
Methanol utilization
formh4spt atp h
h
EX meoh(e)
EX tma(e)
tma(e)
Mtd MeOH
tma
EX dma(e)
dma(e)
DMAt
com
f420-2h2
meoh
accoa f420-2h2
Cdh
f420-2 h
h
MMA EX mma(e)
mma(e)
h4spt
fdox
Mer Mtb
com
Pta
mleneh4spt
Mta
dma
h(e)
coa
pi
f420-2
h2o
Mtt
h
DMA
actp
h
MEOHt2
h TMAt2
com
h2o
menylh4spt
TMA
Methylamine utilization
adp
h2o
meoh(e)
h(e)
ACYP 2
Ack Mch
fdred
mh4spt
MMAt
h2o
coa
mma
CO2
h(e)
Mtm
com
EX dms(e)
EX nh4(e)
nh4
dms(e)
DMSt
dms
CH4St
ch4s
NH4t
com
na1
Electron transport chain
Mtr na1
nh4
EX na1(e)
fdox
fdred
h4spt
Mts
h
Rnf
na1
EX h(e)
MeCoM EX ch4s(e)
ch4s
na1(e)
com
h
MMS
com
F4D
mphen
f420-2h2
cob Fpo
Hdr
Mcr
Methylsulfide utilization
mphenh2
hsfd
f420-2
h
CH4
CH4t
Methane efflux
ch4
EX ch4(e)
ATP
Figure 5: A schematic of the kinetic model. Flux of ATP from the methanogenesis pathway (see Figure 4) feeds into a cell growth term that updates protein numbers used by the kinetic model, simulating the growth when fed on a certain substrate. The inset in the cell mass growth expression is from DIC microscopy with a 5 𝜇m scale bar.
where 𝑌 is the observable (e.g., growth rate) and 𝑥 is the parameter (e.g., enzyme copy number). Performing this analysis for methanol growth shows that cellular growth rate is most sensitive to the copy number of Mcr and, in order from greatest to least sensitivity, the copy numbers of Mtr, Rnf, Fpo, MtaCBA2, HdrDE, Mer, and MtaCBA1. This suggests that growth rate is most dependent on the rate at which methyl-coenzyme M can be reduced to methane. These results also indicate that growth rate depends on the equilibrium of species at the branching point that directs substrates either to CO2 or to methane via the Mtr reaction. This is in line with the fact that the acetoclastic pathway is highly downregulated during growth on methyl substrates, driving flux through that reaction in the reverse direction. In addition, the rate at which protons are pumped across the membrane and the intermediates regenerated (via Hdr and Rnf) effect the rate significantly. Finally, it is of no surprise to see that the rate of methane production is strongly dependent on the rate at which methanol is brought into the methanogenesis pathway as demonstrated by the dependence on Mta proteins.
Examination of the sensitivity of growth rate to various enzyme copy numbers under acetate-growth conditions yields a different trend, in order of decreasing sensitivity, Mer, Mcr, HdrDE, Rnf, and Mtr. The sensitivity to Mer is directly due to the fact that the reaction can divert flux away from methane production to CO2 production. Ongoing work on this model aims to test the behavior on other growth substrates such as CO, MMA, DMA and MMS, as well as mixtures of growth substrates. Future work to refine the rate parameter estimates in order to better capture growth defects with gene knockouts of nonessential methanogenesis genes such as heterodisulfide reductase is planned [31]. 3.5. Transcriptional Regulation Model 3.5.1. Direct Interactions. The direct interaction map, seen in Figure 12(a), is largely made up of TATA binding proteins (TBPs) which are common across all archaea. Other direct interactions were largely identified only for methyltransferases, nitrogen fixation proteins, and oxidative stress proteins. Three TATA-box binding proteins (TBPs) were
10
Archaea 1.4
2.5
1.2 2
Relative probability
Relative probability
1
0.8
0.6
1.5
1
0.4 0.5 0.2
0 1.5
2
2.5
3 Length (𝜇m)
3.5
4
0
4.5
1.5
2
2.5
3
3.5
Width (𝜇m) Methanol grown
Acetate grown
1
Acetate grown
(a)
Methanol grown (b)
Figure 6: Distributions of (a) lengths and (b) widths of single M. acetivorans cells grown on methanol (red) and acetate (blue) as determined by DIC microscopy and image analysis. Data corresponds to approximately 10,000 cells.
(a)
(b)
(c)
Figure 7: (a) DIC images of Methanosarcina acetivorans grown on methanol. (b) After applying Hilbert transform to DIC images and adding them to the original image, the boundaries of the cells become clearer. (c) CellProfiler is used to perform segmentation on images in (b). Here identified cell boundaries are superimposed onto original DIC image to illustrate segmentation.
identified in Methanosarcina spp. and one experiment characterized their role in regulation [72]. While TBP1 is required for growth, and likely the main transcription regulator, TBP2 and TBP3 are dispensable. These two differentially regulate approximately 123 genes on acetate versus methanol growth, and the authors of the study concluded that the two transcription factors optimized protein expression for lowenergy substrate (e.g., acetate) growth [72]. These interactions are shown in Figure 12(a). The second type of direct regulators—those interacting with methyltransferases—act as the mediators for methyl containing organic chemicals entering the methanogenesis
pathway. There are separate methyltransferases for each substrate, including methanol, trimethylamine, dimethylamine, monomethylamine, and methylsulfide. Because methyltransferases are some of the most highly expressed genes, they are tightly regulated to preserve the energy balance in the cell [28]. Considerable experimental effort has uncovered eight methyltransferease specific regulators (Msr’s). Msr’s can act as both up- and downregulators. It was found that in the case of MsrA and MsrB, both proteins act in concert to upregulate expression of MtaCB1, and knockout of either can prevent expression [73]. Similarly, knockout of either msrD or msrE will prevent expression of MtaCB2 [73]. MsrD and to a lesser
Archaea
11
500
gene in M. acetivorans contain the two binding sequences upstream of the TATA box. Their study shows support for a homodimer with cysteine residues which likely are oxidized in an oxygen rich environment, causing the dimer to be released from the binding site. Overall, the total number of interactions in the direct model is 248, with 10 regulators. Strengths of interaction, where known, are indicated by the width of the arrows in Figure 12.
Number of molecules
Linear fit y = 7.85x + 67.5
250
250x diluted SNAP-Mcr
0 0
25 (SNAP) (pM)
50
Figure 8: Calibration curve for SiMPull experiments that provides a mapping between protein concentration in cell lysate and number of spots observed on the slide.
extent MsrE also repress MtaCB3 [73]. Some Msr’s upregulate one gene, while downregulating other genes; for example, MsrF enhances expression of methylsulfide methyltransferase mtsD on all growth substrates except methanol, while MsrC enhances expression of mtsF when on all three methylamines [74, 75]. The full set of interactions can be seen in Figure 12(a). Nitrogen fixation regulation is the third direct set of regulation interactions identified. Two widely conserved nitrogen regulatory proteins named NrpRI and NrpRII have been studied in Methanosarcinales. In M. mazei G¨o1 they were found to regulate 23 proteins that shared a similar DNA regulatory sequence. Overall about 5% of all of M. mazei G¨o1 genes were regulated under nitrogen limitation, with 83 genes being upregulated [76]. Another study showed that several of the upregulated genes under nitrogen limitation were methylamine specific proteins [77]. However, support for direct regulation of all 83 genes by Nrp regulators was not established, and these connections are instead included in the indirect interaction map. The method of action for repression was shown to be that NrpRI binds the DNA and NrpRII which interacts directly with the TBPs, preventing the RNAP from binding [78]. Importantly, homologs of NrpRI and NrpRII have been identified in M. acetivorans that were differentially expressed under nitrogen limiting versus nitrogen sufficient growth [79], and it is likely that these highly conserved (92–94% identical amino acid sequences) regulators have similar function. An additional two small RNA (sRNA) molecules, sRNA154 and sRNA159 whose function is as of yet unknown, include Nrp binding sites upstream of the start codon [80]. One final set of strongly supported interactions include the repression of certain proteins involved in oxidative stress. As Isom et al. point out [81], the MsvR regulator is homologous to a well characterized variant in Methanothermobacter thermautotrophicus and 43 genes in addition to the msvR
3.5.2. Indirect/Hypothesized Interactions. Studies of nitrogenrelated regulation in M. mazei [76] have led to the identification of 69 proteins that were differentially expressed by at least 3-fold [76, 77]. Of the proteins, 35 were involved in nitrogen and energy metabolism, 7 were transport system genes, and 10 were potential regulators. Of particular interest was the upregulation of the mtb and mtm genes used in methylamine degradation to generate energy or ammonia, the latter of which must be synthesized from N2 under starvation conditions. Because many of the identified genes did not have the binding site for the Nrp regulators upstream of their start sites, they are likely regulated by another protein. One of the more exciting regulations that has been discovered in archaea is an sRNA that targets both cis- and trans-encoding mRNAs called sRNA162 [82]. Overexpression of sRNA162 in M. mazei greatly upregulated many of the methylamine processing proteins. The work also implicated an ArsR family transcription factor as the mediating component in the regulation [82]. Homologs with high sequence identity (>90%) to both the sRNA and the ArsR regulators (gene MA1531) exist in M. acetivorans; therefore, we have included the same interactions in our hypothetical map. MreA (Methanosarcina regulator of energy-converting metabolism) was recently implicated as the global regulator of methanogenesis after it was observed to be 38-fold more highly expressed on acetate than on TMA or methanol [59]. A study comparing the ratio of methanogenesis protein encoding genes in a strain containing a knockout to the wild type indicated that MreA acts to upregulate acetoclastic proteins and downregulate methylotrophic pathways [59], the latter of which is mediated by changes in expression of the Msr proteins previously discussed. Therefore, MreA could act as a switch between methanol and acetate utilization. Adding the interactions reported in the paper to the indirect graph allows MreA to have the greatest putative sphere of influence on gene expression (Figure 12(b)). Cadmium resistance has been studied in a number of different archaea and bacteria. A well known CadC regulator represses cadmium resistance genes. It is stimulated to unbind by Cd2+ , Bi3+ , and Pb2+ [83]. This is a particularly interesting regulation as M. acetivorans growing on acetate in the presence of cadmium chloride shows between a twoand fivefold increase in methane production, likely attributed to higher levels of acetate kinase and carbonic anhydrase and lower phosphate kinase (Pta) [84]. Furthermore, it has been shown that levels of Coenzyme M increased roughly proportionally to Cd2+ concentration [85]. A homolog of the cadC gene, MA3940, likely regulates two cadmium efflux
12
Archaea 500 1 photobleaching step
4 photobleaching steps
900
Intensity (a.u.)
Intensity (a.u.)
1200
600
250
300 0
0 0
20
40
0
60
10 Time (s)
Time (s) (a)
20
(b)
0.14
1.4
0.12
2.5
0.12
1.2
0.1
2
0.08 1.5 0.06 1
0.04
0.5
0.02 0
0
20
40
60
80
0 100
1
0.1 0.08
0.8
0.06
0.6
0.04
0.4
0.02
0.2
0
0 0
100
200
Time (hr) Exp. MeOH Sim. MeOH
Exp. mass Sim. mass
Sim. CO2 Sim. CH4
Figure 10: Results of the kinetic model. Comparison of the kinetic model for growth of M. acetivorans culture on 125 mM methanol to the experiment to which it was fit [30]. Lines indicate model results while symbols indicate experimental measurements.
encoding genes MA3366 and MA3632 in M. acetivorans. In addition, evidence exists for a putative interaction between CadC or one of the genes it regulates and ack, pta, and carbonic anhydrase. The former two of these interactions are shown in Figure 12(b). 3.5.3. Methanogenesis Gene Regulation. Simplification of the two regulation maps to only those interactions that directly modulate expression of methanogenesis genes yields the map shown in Figure 13. From this map it can be seen that two regulators (sRNA162 and MreA) interact broadly with methanogenesis genes. Correlations of regulator and methanogenesis proteins across several substrates (data not shown) indicate three broad classes of regulation: methanol, acetate, and other methyl-containing substrates (MMA, DMA, TMA, and MMS). Regulation motifs usually embody one of two modes of action in many different species: (1) a global regulator that
Cell mass (mg)
3
Concentration (M)
0.14
Cell mass (mg)
Concentration (M)
Figure 9: Multiple photobleaching steps in SiMPull experiments with rpl18p-SNAP strains (a) indicate multiple immobilized proteins as compared to pure SNAP protein which shows only single photobleaching step (b).
Exp. mass Sim. mass Sim. CH4
300
400 500 Time (hr)
600
700
Sim. CO2 Sim. CO
Figure 11: Results of the kinetic model. Comparison of the kinetic model for growth of M. acetivorans culture on 120 mM acetate to the experiment [31]. Lines indicate model results while symbols indicate experimental measurements.
activates/represses many genes or (2) activation of a single or handful of genes via very specific interaction [86]. Therefore, a possible energetically efficient way to regulate metabolism may be to have a few global regulators that activate/repress many genes, some of which may in turn act as specific regulators capable of fine tuning individual gene expression. With this knowledge in mind and assuming that the MreA and sRNA162 regulators interact in the way proposed in the literature, it can be hypothesized that between the two regulators the three classes of regulation can be covered. In this hypothesis MreA is a global regulator that facilitates the switch between methyl substrates and acetate. It does this primarily by turning off the CO2 efflux pathway while turning on the acetate utilization pathway. Upregulation of TMA, DMA, and MMA utilizing proteins is accomplished by expression of the specific regulator sRNA162 , which turns off
Archaea
13
MsvR MA2139
MA4297 MA1592
MA2690
MA1200
MA4519
MA1593
MA0502 MA3985
MA3875
TBP3
MA3621
MA3148
MA2824
MA2449 MA0829 MA1591 MA3246
MA1346 MA0741
MA4281 MA3310
MA2450
MA2288
MA2346
MA4520
MA1527
MA1458 MA2138
MA2959
MA3319
MA1679
MA1364
MA3322
MA2304
MA0989
MA3609
MA0887
MA0760
MA3753
MA2150
MA3880
MA1525
MA2084
MA3876
MA0812
MA2324
MA4078
MA1974
MA3981
MA3044 MA0653 MA4563
MA3896
MA0334
MA2997
MA3186
MA4391
MA4165 MA1942
MA2785
MA2231
MA4393
MA3161
MA3051
MA2689
MA4079
MA2609
MA3107
MA2267 MA3970
MA1165 MA4163
MA3461
MA0849
MA4164 MA4152
MA0848
MA2230
MA3163
MA0547
MA4383
MA4385 MA0704
MA0460
MA0620
MA3103
MA0539
MA3895
MA0857
MA4166 MA4634
MA4558
MA0459
MA2972
MA4384
MA4608
MA4656 MA0859
MA4331
MA0455 MA4392
MA4389
MA4661
MA1616
MA4560
MA0964
MA4168 MA2971 MA0862
MA3382
MA4397
MA0546 MA2974
MA0301 MA4386
MA2992
MA4607
MA2149
MA4095 MA1418
MA4216
MA0300
Msr
MA1417
MA3918
MA0297 MA1617
MA0456
MA3916 MA3907
MA1475
MA3917 MA4398
MA3512
MA1761
TBP2
MA1743 MA1742
MA1132
MA1340 MA4024
MA0699
MA0299
MA1760 MA4426
MA1752 MA0179 MA0172
MA2486 MA4023 MA3457 MA3453
MA1764
MA1746 MA0303
MA3046
MA4199
MA3905
MA1751 MA4673
MA3049
MA3047
MA1748
MA3452
MA4197
MA3050
MA1750 MA2991
MA4198
MA4425
MA3048 MA1915
MA2147
MA1745 MA1341
MA1128 MA1131
MA0701
MA0302
MA1759 MA2482
MA0715 MA3458
MA3450
MA1130 MA3105 MA4427
MA4536
MA3456 MA0298
MA3455
MA3451 MA3449
(a) Direct interactions MA0502 MA4297 MA1346 MA1592
MA3985
MA2824
MA1593
MA4078 MA2449 M MA3310 MA1525 MA2324 MA4519 MA2689 MA3875 MA2138 MA4152 MA1679 MA A MA3981 MA3246 M MA MA2304 04 MA1165 MA3876 76 6 A4281 M MA2609
MA3322 MA4163M MA4079 MA2084
MsvR
MA1458
Msr MA4560
MA2450MA MA1591 M MA2785
MA4397 MA4398 MA0456
MA4164
MreA
MA1517
MA4520
MA4558
MA3733 MA15722 MA2407 MA0942 MA2636 MA2703 MA2686 MA4380 MA2647 MA2383 MA MA1573 MA1400 MA1542 MA1353 MA3589 MA0774 74 MA0486 MA1950 MA1497 M MA MA2635 MA0443 MA1502 02 2 MA0929 M MA MA1871 MA0492 MA2001 MA3254 MA4008MA MA2568 MA0922 MA1327 27 MA0871 M MA MA0305 MA1495 MA MA3622 MA2308 MA3260 MA2278 MA3594 MA4212 MA2382 MA4565 MA1789 MA3664 MA2156 MA4379 MA4596 MA3387 MA3199 MA3340 MA3339 MA0619 MA2323 MA3603 MA3129
MA0862
MA0455 MA1616 MA1617
MA3621
MA3366 MA39400M3632
CadC
MA1739
MA2631
MA2148 MA3341 MA03077MA3641
MA2645
MA2646
MA0755
MA3278
MA4559
MA3922 MA1140MA4167
MA3640
MA2684
MA0872
MA3595
MA2882
MA1614
MA3130 MA4213
MA0864 MA2694 MA2442
MA3609 MA4563
MA0849 MA0848 M
MA2702
MA2150
MA2325
MA3186 MA4165
MA4331
MA2640
MA3512
MA4386
MA0653
MA2974 MA1475
MA4166 MA0297 MA0715 MA0299
MA2724
MA3381
MA2997
MA4095
MA4389
MA4168
MA0300
MA4607 MA4608MA3917 MA1417
MA0302 MA0298
MA0865 MA0978 MA2257 MA1323
MA0857 MA2231 MA4634
MA4385 MA0301 MA2149
MA3845
MA2065
MA3916
MA0303 MA1752
MA1494
MA0976 MA0551 MA2309 MA3255 MA4030 MA2657 MA3170
MA3697
MA0460
MA3161 MA0539 MA3107 MA4393
MA4391
MA0873 MA3596
MA2454 MA1949 MA1996 MA2637
MA4399 MA3498 MA4346 MA4067 MA1646
MA4667 MA2445
MA2936
MA1504
MA3604
MA2630 MA4355 MA0863
MA1015 MA3949 MA2262
MA3302
MA2998 MA3037 MA2929
MA0310 MA1149 M MA MA3862
MA2644
MA3634
MA1671
MA MA0490 MA3639 MA0296MA0275
MA4392
MA1498
MA0262
MA3413
TBP3
MA4383 MA3499 MA3376
MA1138
MA2003 MA2687
MA0547
MA0459
MA3607
MA2925
MA1723
MA0779 MA0780 80 80
MA4266
MA0975
MA0484 MA1800
MA0308
MA1364 MA3051 MA2346 MA MA0704 MA3044 MA3103 MA2267 MA1974 MA3880 MA0760 MA0334 MA3319 MA3896 MA3461 MA3970 MA0741 MA4656 MA3895 MA0989 MA2959 MA1942 MA0887 MA2288 MA3753 MA3163 MA0620
MA0859
MA3907 MA4198 MA1746 MA3046
MA0934 MA0179
MA2453
MA3050
MA1645 MA4173 MA0463 MA0434 MA1501
MA09322MA3860 MA3865 MA0274 MA1505 05MA1011 MA0272 MA MA1012 MA1016 MA1503 MA3861 MA1507 M A MA1014 MA0276 MA0933M MA3732 322 MA1506 MA0273 MA1499 MA0931 MA0304 MA1500 MA A MA0144
MA1340 MA3905
MA2971 MA2972 M MA A
MA1571 MA2923
MA4023
MA1418 MA2147 MA4197 MA3049 MA4024 MA4536 MA1745 M MA4425 MA1751 MA1130 30 MA4673 MA4199
MA2992
TBP2
MA2991 MA3452 MA1764 MA4427 MA 47 MA3047
MA17500 MA3456
MA3451 MA3105 MA3455 M MA MA3458 MA1759 MA3450 MA24822MA3453 MA3048 MA3449 MA1915 MA2486 MA3457 MA0701 MA1748 MA0699 MA1132 MA1128
MA1131
MA1742 MA0333 MA1384
MM1531
MA4606 MA3166 66 MA1339
HxlR
MA1633
MA2424 MA4473 73 3
MA3731 MA4592 MA16366MA2868 MA1490 M 90MA4329 MA4594 M MA MA2981 MA0573 MA1919 MA4063 MA45933MA1710 MA0384 84MA0529 MA0832 MA4595 M MA0143 MA4196 MA MA0530 30MA2425 MA0642 42 2 A0116 MA2989 M 16MA3864 MA32988MA3126 MA0528 MA3127 MA934 MA1610 MA4615 MA4591 91MA3022 MA2990 MA4262 MA4544
sRNA 126
(b) Indirect interactions
Figure 12: Graph representations of the direct and indirect regulations and associated spheres of influence. Red arrows indicate downregulation and blue arrows indicate up regulation. The regulator name is indicated by the large black text.
14
Archaea
MeOH
TMA
Ac
tbp2 tbp3
mreA
sRNA162
fmdB mer
fmdEFADCB
mtbA
ftr
mch mtd fmdE
mtbBC1
msrG msrF
mtmBC1 msrC
mtbBC3
mtsH
mtbBC2 mttBC2
mtmBC2 mttBC1
msrB mtsD
mtsF msrD cdhA3 cytC pta cdhA1 msrA
msrE msrH
rnf mrp
mtaBC2 fpoF
mtaBC1
fpoA
mtaA2 mtaBC3
mtaA1
fpoPO
ack
cdh1
cdhA2 cdh2
cam
fpoD
Figure 13: A graph representing the regulation of methanogenesis genes. Red arrows indicate downregulation, blue arrows indicate upregulation, and green arrows indicate weak regulation. The thickness of the arrow shows the strength of the interaction. Turquoise nodes are known regulators. Red nodes are CO2 efflux proteins. Olive green nodes are growth substrates. Green nodes are methyl-sulfide methyltransferase proteins. Purple nodes are methanol methyltransferase proteins. Blue nodes are acetate utilization proteins and gold nodes are methylamine methyltransferase proteins.
expression MA1531, which may be a repressor of methylamine genes.
4. Conclusions We have shown that SiMPull can be used as a method to measure the number of proteins in anaerobic organisms. This entailed genetically engineering a SNAP tag gene into the chromosome along with the gene encoding for the protein of interest, McrG and ribosomal protein Rpl18p. Using this technique we were able to estimate the number of protein complexes in single cells in their exponential growth phase which is important data for modeling. With Mcr’s unique position in the methanogenic pathway, knowledge of its copy number is important for modeling metabolic dynamics. As ribosomes are known to be one of the dominant components of molecular crowding, their numbers are important to generate accurate in silico whole cell models of methanogens. Using SiMPull and RNA-seq expression data from monoclonal cell cultures of the methanogens growing on acetate and methanol, we were able to estimate the number of proteins in the methanogenesis pathways. Coupling the
resulting cell mass growth reaction to the methanogenesis reactions, we were able to fit unknown rate constants to experiments for growth on methanol. Applying the model to growth on acetate, we were able to capture the correct timescale for use of acetate and production of the methane; however, the cell mass growth rate in exponential phase was too high. In order to apply the model to more complex scenarios, especially time-varying growth substrate conditions potentially found in the environment, we need a regulation mechanism for expression of the proteins. Examining correlations of protein expression across different substrates leads to the observation that there appear to be three classes of growth: methanol, acetate, and another methyl substrate (TMA, DMA, MMA, and MMS). Towards the goal of developing a regulation model, we have compiled known transcriptional regulation with putative regulation interactions to create a draft model for M. acetivorans. Reducing the draft regulation map to just interactions with methanogenesis protein encoding genes, two regulators arise as global regulators. MreA appears to switch between the acetoclastic pathway and the CO2 efflux pathway and, therefore, is hypothesized as
Archaea the switch between acetoclastic growth and methylotrophic growth. sRNA162 appears to turn on expression of genes necessary for utilizing methylamines and, therefore, optimizes the organism for methylamine growth. The physical and stoichiometric properties and kinetic model reported here complement the metabolic reconstructions and constitutes significant progress towards a full computational model of M. acetivorans. Spatial heterogeneity, such as that caused by large crowders like the ribosome, is known to cause stochastic effects in similar cells from a monoclonal culture; therefore, quantifying the number and distribution is necessary. Because many reactions in methanogenesis occur in the membrane, stochasticity due to the local environment could have a large effect. Larger spatial organization, such as membrane bound protein complex locality and number, can be determined by cryoelectron tomography. Such data could be used with the kinetic and regulation models developed here to construct detailed full cell reactiondiffusion models similar to those that have been created previously [87]. Such models would allow study of stochasticity in individual organisms. Ultimately, these models could be used with hybrid reaction-diffusion master equation/flux balance analysis techniques [88] that provide full metabolic modeling with spatial effects due to cell culture organization. The utility of the computational models is that they should be easily extendable to the other Methanosarcina spp.
15
[4]
[5] [6]
[7]
[8]
[9]
[10]
[11]
Conflict of Interests The authors declare that there is no conflict of interests regarding the publication of this paper.
Acknowledgments The authors thank John A. Cole for helpful review of this paper and Elijah Roberts for the code that segments cells as well as initial DIC measurements. This work was supported by Office of Science (BER), U.S. Department of Energy Grant no. DE-FG02-10ER6510, NASA Astrobiology Institute Grants nos. NNA13AA91A (ZLS, PL) and DE-FG0202ER15296 (WWM, JRE, and PRAK) National Institutes of Health (NIH) grants U19 AI083025 and GM065367 (TH and AJ) and National Science Foundation (NSF) Physics Frontier Center Grant no. PHY-0822613 (TH and ZLS), and Molecular Biophysics Training Grant no. PHS 5 T32 GM008276 (JRP).
[12]
[13]
[14]
[15]
[16]
[17]
References [1] C. R. Woese, O. Kandler, and M. L. Wheelis, “Towards a natural system of organisms: proposal for the domains archaea, bacteria, and eucarya,” Proceedings of the National Academy of Sciences of the United States of America, vol. 87, no. 12, pp. 4576– 4579, 1990. [2] S. Winker and C. R. Woese, “A definition of the domains Archaea, Bacteria and Eucarya in terms of small subunit ribosomal RNA characteristics,” Systematic and Applied Microbiology, vol. 14, no. 4, pp. 305–310, 1991. [3] G. E. Fox, L. J. Magrum, W. E. Balch, R. S. Wolfe, and C. R. Woese, “Classification of methanogenic bacteria by 16S
[18]
[19]
[20]
ribosomal RNA characterization,” Proceedings of the National Academy of Sciences of the United States of America, vol. 74, no. 10, pp. 4537–4541, 1977. C. R. Woese and G. E. Fox, “Phylogenetic structure of the prokaryotic domain: the primary kingdoms,” Proceedings of the National Academy of Sciences of the United States of America, vol. 74, no. 11, pp. 5088–5090, 1977. C. R. Woese, “Bacterial evolution,” Microbiological Reviews, vol. 51, no. 2, pp. 221–271, 1987. R. R. Gutell and C. R. Woese, “Higher order structural elements in ribosomal RNAs: pseudo-knots and the use of noncanonical pairs,” Proceedings of the National Academy of Sciences of the United States of America, vol. 87, no. 2, pp. 663–667, 1990. E. Roberts, A. Sethi, J. Montoya, C. R. Woese, and Z. LutheySchulten, “Molecular signatures of ribosomal evolution,” Proceedings of the National Academy of Sciences of the United States of America, vol. 105, no. 37, pp. 13953–13958, 2008. C. Woese, “The universal ancestor,” Proceedings of the National Academy of Sciences of the United States of America, vol. 95, no. 12, pp. 6854–6859, 1998. C. R. Woese, “On the evolution of cells,” Proceedings of the National Academy of Sciences of the United States of America, vol. 99, no. 13, pp. 8742–8747, 2002. C. R. Woese, G. J. Olsen, M. Ibba, and D. S¨oll, “Aminoacyl-tRNA synthetases, the genetic code, and the evolutionary process,” Microbiology and Molecular Biology Reviews, vol. 64, no. 1, pp. 202–236, 2000. P. O’Donoghue and Z. Luthey-Schulten, “Evolution of structure in aminoacyl-tRNA synthetases,” Microbiology and Molecular Biology Reviews, vol. 67, no. 4, pp. 550–573, 2003. P. O’Donoghue, A. Sethi, C. R. Woese, and Z. A. LutheySchulten, “The evolutionary history of Cys-tRNACys formation,” Proceedings of the National Academy of Sciences of the United States of America, vol. 102, no. 52, pp. 19003–19008, 2005. J. N. Reeve, J. N¨olling, R. M. Morgan, and D. R. Smith, “Methanogenesis: genes, genomes, and who’s on first?” Journal of Bacteriology, vol. 179, no. 19, pp. 5975–5986, 1997. J. R. Brown and W. F. Doolittle, “Archaea and the prokaryoteto-eukaryote transition,” Microbiology and Molecular Biology Reviews, vol. 61, no. 4, pp. 456–502, 1997. D. E. Graham, R. Overbeek, G. J. Olsen, and C. R. Woese, “An archaeal genomic signature,” Proceedings of the National Academy of Sciences of the United States of America, vol. 97, no. 7, pp. 3304–3308, 2000. B. Gao and R. S. Gupta, “Phylogenomic analysis of proteins that are distinctive of archaea and its main subgroups and the origin of methanogenesis,” BMC Genomics, vol. 8, article 86, 2007. F. Gaillard, B. Scaillet, and N. T. Arndt, “Atmospheric oxygenation caused by a change in volcanic degassing pressure,” Nature, vol. 478, no. 7368, pp. 229–232, 2011. R. K. Thauer, A.-K. Kaster, H. Seedorf, W. Buckel, and R. Hedderich, “Methanogenic archaea: ecologically relevant differences in energy conservation,” Nature Reviews Microbiology, vol. 6, no. 8, pp. 579–591, 2008. S. Burggraf, H. Fricke, A. Neuner et al., “Methanococcus igneus sp. nov., a novel hyperthermophilic methanogen from a shallow submarine hydrothermal system,” Systematic and Applied Microbiology, vol. 13, no. 3, pp. 263–269, 1990. R. J. Cicerone and R. S. Oremland, “Biogeochemical aspects of atmospheric methane,” Global Biogeochem Cycles, vol. 2, no. 4, pp. 299–327, 1988.
16 [21] A. M. Feist, J. C. M. Scholten, B. Ø. Palsson, F. J. Brockman, and T. Ideker, “Modeling methanogenesis with a genome-scale metabolic reconstruction of Methanosarcina barkeri,” Molecular Systems Biology, vol. 2, no. 1, 2006. [22] M. N. Benedict, M. C. Gonnerman, W. W. Metcalf, and N. D. Price, “Genome-scale metabolic reconstruction and hypothesis testing in the methanogenic archaeon Methanosarcina acetivorans C2A,” Journal of Bacteriology, vol. 194, no. 4, pp. 855–865, 2012. [23] P. Labhsetwar, J. Cole, E. Roberts, N. Price, and Z. LutheySchulten, “Heterogeneity in protein expression induces metabolic variability in a modeled Escherichia coli population,” Proceedings of the National Academy of Sciences, vol. 110, no. 34, 2013. [24] C. J. Bult, O. White, G. J. Olsen et al., “Complete genome sequence of the Methanogenic archaeon, Methanococcus jannaschii,” Science, vol. 273, no. 5278, pp. 1058–1073, 1996. [25] J. E. Galagan, C. Nusbaum, A. Roy et al., “The genome of M. acetivorans reveals extensive metabolic and physiological diversity,” Genome Research, vol. 12, no. 4, pp. 532–542, 2002. [26] M. Rother and W. W. Metcalf, “Anaerobic growth of Methanosarcina acetivorans C2A on carbon monoxide: an unusual way of life for a methanogenic archaeon,” Proceedings of the National Academy of Sciences of the United States of America, vol. 101, no. 48, pp. 16929–16934, 2004. [27] J. G. Ferry and C. H. House, “The stepwise evolution of early life driven by energy conservation,” Molecular Biology and Evolution, vol. 23, no. 6, pp. 1286–1292, 2006. [28] P. Browne and H. Cadillo-Quiroz, “Contribution of transcriptomics to systems-level understanding of Methanogenic Archaea,” Archaea, vol. 2013, Article ID 586369, 11 pages, 2013. [29] A. Jain, R. Liu, B. Ramani et al., “Probing cellular protein complexes using single-molecule pull-down,” Nature, vol. 473, no. 7348, pp. 484–488, 2011. [30] A. Bose, M. A. Pritchett, M. Rother, and W. W. Metcalf, “Differential regulation of the three methanol methyltransferase isozymes in Methanosarcina acetivorans C2A,” Journal of Bacteriology, vol. 188, no. 20, pp. 7274–7283, 2006. [31] N. R. Buan and W. W. Metcalf, “Methanogenesis by Methanosarcina acetivorans involves two structurally and functionally distinct classes of heterodisulfide reductase,” Molecular Microbiology, vol. 74, no. 4, pp. 843–853, 2010. [32] C. Ingram-Smith, A. Gorrell, S. H. Lawrence, P. Iyer, K. Smith, and J. G. Ferry, “Characterization of the acetate Binding Pocket in the Methanosarcina thermophila acetate Kinase,” Journal of Bacteriology, vol. 187, no. 7, pp. 2386–2394, 2005. [33] A. Gorrell, S. H. Lawrence, and J. G. Ferry, “Structural and kinetic analyses of arginine residues in the active site of the acetate kinase from Methanosarcina thermophila,” Journal of Biological Chemistry, vol. 280, no. 11, pp. 10731–10742, 2005. [34] S. H. Lawrence, K. B. Luther, H. Schindelin, and J. G. Ferry, “Structural and functional studies suggest a catalytic mechanism for the phosphotransacetylase from Methanosarcina thermophila,” Journal of Bacteriology, vol. 188, no. 3, pp. 1143– 1154, 2006. [35] M. E. Rasche, K. S. Smith, and J. G. Ferry, “Identification of cysteine and arginine residues essential for the phosphotransacetylase from Methanosarcina thermophila,” Journal of Bacteriology, vol. 179, no. 24, pp. 7712–7717, 1997. [36] D. A. Grahame and T. C. Stadtman, “Carbon monoxide dehydrogenase from Methanosarcina barkeri. Disaggregation,
Archaea
[37]
[38]
[39]
[40]
[41]
[42]
[43]
[44]
[45]
[46]
[47]
[48]
[49]
[50]
purification, and physicochemical properties of the enzyme,” Journal of Biological Chemistry, vol. 262, no. 8, pp. 3706–3712, 1987. R. I. L. Eggen, R. van Kranenburg, A. J. M. Vriesema et al., “Carbon monoxide dehydrogenase from Methanosarcina frisia G¨o1: characterization of the enzyme and the regulated expression of two operon-like cdh gene clusters,” Journal of Biological Chemistry, vol. 271, no. 24, pp. 14256–14263, 1996. M. A. Pritchett and W. W. Metcalf, “Genetic, physiological and biochemical characterization of multiple methanol methyltransferase isozymes in Methanosarcina acetivorans C2A,” Molecular Microbiology, vol. 56, no. 5, pp. 1183–1194, 2005. R. B. Opulencia, A. Bose, and W. W. Metcalf, “Physiology and posttranscriptional regulation of methanol:coenzyme M methyltransferase isozymes in Methanosarcina acetivorans C2A,” Journal of Bacteriology, vol. 191, no. 22, pp. 6928–6935, 2009. K. Ma and R. K. Thauer, “Purification and properties of N5,N10methylenetetrahydromethanopterin reductase from Methanobacterium thermoautotrophicum (strain Marburg),” European Journal of Biochemistry, vol. 191, no. 1, pp. 187–193, 1990. B. W. J. te Brommelstroet, W. J. Geerts, J. T. Keltjens, C. van der Drift, and G. D. Vogels, “Purification and properties of 5,10-methylenetetrahydromethanopterin dehydrogenase and 5,10-methylenetetrahydromethanopterin reductase, two coenzyme F420-dependent enzymes, from Methanosarcina barkeri,” Biochimica et Biophysica Acta, vol. 1079, no. 3, pp. 293–302, 1991. S. Shima and R. K. Thauer, “Tetrahydromethanopterin-specific enzymes from Methanopyrus kandleri,” Methods in Enzymology, vol. 331, pp. 317–353, 2001. B. W. te Brommelstroet, C. M. H. Hensgens, W. J. Geerts, J. T. Keltjens, C. van der Drift, and G. D. Vogels, “Purification and properties of 5,10-methenyltetrahydromethanopterin cyclohydrolase from Methanosarcina barkeri,” Journal of Bacteriology, vol. 172, no. 2, pp. 564–571, 1990. M. Karrasch, G. Borner, M. Enssle, and R. K. Thauer, “The molybdoenzyme formylmethanofuran dehydrogenase from Methanosarcina barkeri contains a pterin cofactor,” European Journal of Biochemistry, vol. 194, no. 2, pp. 367–372, 1990. P. E. Jablonski and J. G. Ferry, “Purification and properties of methyl coenzyme M methylreductase from acetate-grown Methanosarcina thermophila,” Journal of Bacteriology, vol. 173, no. 8, pp. 2481–2487, 1991. E. Murakami, U. Deppenmeier, and S. W. Ragsdale, “Characterization of the intramolecular electron transfer pathway from 2-Hydroxyphenazine to the heterodisulfide reductase from Methanosarcina thermophila,” Journal of Biological Chemistry, vol. 276, no. 4, pp. 2432–2439, 2001. R. Iino, R. Hasegawa, K. V. Tabata, and H. Noji, “Mechanism of inhibition by C-terminal 𝛼-helices of the ∈ subunit of Escherichia coli FoF1-ATP synthase,” Journal of Biological Chemistry, vol. 284, no. 26, pp. 17457–17464, 2009. K. R. Sowers, J. E. Boone, and R. P. Gunsalus, “Disaggregation of Methanosarcina spp. and growth as single cells at elevated osmolarity,” Applied and Environmental Microbiology, vol. 59, no. 11, pp. 3832–3839, 1993. W. W. Metcalf, J.-K. Zhang, X. Shi, and R. S. Wolfe, “Molecular, genetic, and biochemical characterization of the serC gene of Methanosarcina barkeri Fusaro,” Journal of Bacteriology, vol. 178, no. 19, pp. 5797–5802, 1996. W. W. Metcalf, J. K. Zhang, E. Apolinario, K. R. Sowers, and R. S. Wolfe, “A genetic system for Archaea of the genus
Archaea
[51]
[52]
[53]
[54]
[55]
[56]
[57]
[58]
[59]
[60]
[61]
[62]
[63]
[64]
[65]
Methanosarcina: liposome-mediated transformation and construction of shuttle vectors,” Proceedings of the National Academy of Sciences of the United States of America, vol. 94, no. 6, pp. 2626–2631, 1997. M. A. Pritchett, J. K. Zhang, and W. W. Metcalf, “Development of a markerless genetic exchange method for Methanosarcina acetivorans C2A and its use in construction of new genetic tools for methanogenic archaea,” Applied and Environmental Microbiology, vol. 70, no. 3, pp. 1425–1433, 2004. A. M. Guss, M. Rother, J. K. Zhang, G. Kulkarni, and W. W. Metcalf, “New methods for tightly regulated gene expression and highly efficient chromosomal integration of cloned genes for Methanosarcina species,” Archaea, vol. 2, no. 3, pp. 193–203, 2008. W. W. Metcalf, J. K. Zhang, and R. S. Wolfe, “An anaerobic, intrachamber incubator for growth of Methanosarcina spp. on methanol-containing solid media,” Applied and Environmental Microbiology, vol. 64, no. 2, pp. 768–770, 1998. K. A. Datsenko and B. L. Wanner, “One-step inactivation of chromosomal genes in Escherichia coli K-12 using PCR products,” Proceedings of the National Academy of Sciences of the United States of America, vol. 97, no. 12, pp. 6640–6645, 2000. F. J. Stewart, E. A. Ottesen, and E. F. Delong, “Development and quantitative analyses of a universal rRNA-subtraction protocol for microbial metatranscriptomics,” ISME Journal, vol. 4, no. 7, pp. 896–907, 2010. R. McClure, D. Balasubramania, Y. Sun et al., “Computational analysis of bacterial RNA-seq data,” Nucleic Acids Research, vol. 41, no. 14, p. e140, 2013. A. Jain, R. Liu, Y. K. Xiang, and T. Ha, “Single-molecule pulldown for studying protein interactions,” Nature Protocols, vol. 7, no. 3, pp. 445–452, 2012. W. Grabarse, F. Mahlert, S. Shima, R. K. Thauer, and U. Ermler, “Comparison of three methyl-coenzyme M reductases from phylogenetically distant organisms: unusual amino acid modification, conservation and adaptation,” Journal of Molecular Biology, vol. 303, no. 2, pp. 329–344, 2000. M. Reichlen, V. Vepachedu, K. Murakami, and J. Ferry, “MreA functions in the global regulation of methanogenic pathways in Methanosarcina acetivorans,” mBio, vol. 3, no. 4, Article ID e00189-12, 2012. S. T. Yang and M. R. Okos, “Kinetic study and mathematical modeling of methanogenesis of acetate using pure cultures of methanogens,” Biotechnology and Bioengineering, vol. 30, no. 5, pp. 661–667, 1987. S. Hoops, S. Sahle, R. Gauges et al., “COPASI—a complex pathway sImulator,” Bioinformatics, vol. 22, no. 24, pp. 3067–3074, 2006. I. Schomburg, A. Chang, S. Placzek et al., “BRENDA in 2013: integrated reactions, kinetic data, enzyme function data, improved disease classification: new options and contents in BRENDA,” Nucleic Acids Research, vol. 41, pp. 764–772, 2013. R. K. Thauer, “Biochemistry of methanogenesis: a tribute to Marjory Stephenson: 1998 Marjory Stephenson Prize Lecture,” Microbiology, vol. 144, no. 9, pp. 2377–2406, 1998. R. K. Thauer, K. Jungermann, and K. Decker, “Energy conservation in chemotrophic anaerobic bacteria,” Bacteriological Reviews, vol. 41, no. 1, pp. 100–180, 1977. M. W. Peck, “Changes in concentrations of coenzyme F420 analogs during batch growth of Methanosarcina barkeri and Methanosarcina mazei,” Applied and Environmental Microbiology, vol. 55, no. 4, pp. 940–945, 1989.
17 [66] B. Obara, M. Roberts, J. Armitage, and V. Grau, “Bacterial cell identification in differential interference contrast microscopy images,” BMC Bioinformatics, vol. 14, no. 134, 2013. [67] A. E. Carpenter, T. R. Jones, M. R. Lamprecht et al., “CellProfiler: image analysis software for identifying and quantifying cell phenotypes,” Genome Biology, vol. 7, no. 10, 2006. [68] C. Wrede, U. Walbaum, A. Ducki, I. Heieren, and M. and Hoppert, “Localization of methyl-coenzyme M reductase as metabolic marker for diverse Methanogenic archaea,” Archaea, vol. 2013, Article ID 920241, 7 pages, 2013. [69] L. Rohlin and R. P. Gunsalus, “Carbon-dependent control of electron transfer and central carbon pathway genes for methane biosynthesis in the Archaean, Methanosarcina acetivorans strain C2A,” BMC Microbiology, vol. 10, article 62, 2010. [70] U. Ermler, W. Grabarse, S. Shima, M. Goubeaud, and R. K. Thauer, “Crystal structure of methyl-coenzyme M reductase: the key enzyme of biological methane formation,” Science, vol. 278, no. 5342, pp. 1457–1462, 1997. [71] B. E. Krenn, H. S. van Walraven, M. J. C. Scholts, and R. Kraayenhof, “Modulation of the proton-translocation stoichiometry of H+ -ATP synthases in two phototrophic prokaryotes by external pH,” Biochemical Journal, vol. 294, no. 3, pp. 705–709, 1993. [72] M. J. Reichlen, K. S. Murakami, and J. G. Ferry, “Functional analysis of the three TATA binding protein homologs in Methanosarcina acetivorans,” Journal of Bacteriology, vol. 192, no. 6, pp. 1511–1517, 2010. [73] A. Bose and W. W. Metcalf, “Distinct regulators control the expression of methanol methyltransferase isozymes in Methanosarcina acetivorans C2A,” Molecular Microbiology, vol. 67, no. 3, pp. 649–661, 2008. [74] A. Bose, G. Kulkarni, and W. W. Metcalf, “Regulation of putative methyl-sulphide methyltransferases in Methanosarcina acetivorans C2A,” Molecular Microbiology, vol. 74, no. 1, pp. 227–238, 2009. [75] E. Oelgeschl¨ager and M. Rother, “In vivo role of three fused corrinoid/methyl transfer proteins in Methanosarcina acetivorans,” Molecular Microbiology, vol. 72, no. 5, pp. 1260–1272, 2009. [76] K. Veit, C. Ehlers, A. Ehrenreich et al., “Global transcriptional analysis of Methanosarcina mazei strain G¨o1 under different nitrogen availabilities,” Molecular Genetics and Genomics, vol. 276, no. 1, pp. 41–55, 2006. [77] K. Veit, C. Ehlers, and R. A. Schmitz, “Effects of nitrogen and carbon sources on transcription of soluble methyltransferases in Methanosarcina mazei strain G¨o1,” Journal of Bacteriology, vol. 187, no. 17, pp. 6147–6154, 2005. [78] K. Weidenbach, C. Ehlers, J. Kock, and R. A. Schmitz, “NrpRII mediates contacts between NrpRI and general transcription factors in the archaeon Methanosarcina mazei G¨o1,” FEBS Journal, vol. 277, no. 21, pp. 4398–4411, 2010. [79] T. J. Lie, J. A. Dodsworth, D. C. Nickle, and J. A. Leigh, “Diverse homologues of the archaeal repressor NrpR function similarly in nitrogen regulation,” FEMS Microbiology Letters, vol. 271, no. 2, pp. 281–288, 2007. [80] D. J¨ager, C. M. Sharma, J. Thomsen, C. Ehlers, J. Vogel, and R. A. Schmitz, “Deep sequencing analysis of the Methanosarcina mazei G¨o 1 transcriptome in response to nitrogen availability,” Proceedings of the National Academy of Sciences of the United States of America, vol. 106, no. 51, pp. 21878–21882, 2009. [81] C. Isom, J. Turner, D. Lessner, and E. Karr, “Redox-sensitive DNA binding by homodimeric Methanosarcina acetivorans
18
[82]
[83]
[84]
[85]
[86]
[87]
[88]
Archaea MsvR is modulated by cysteine residues,” BMC Micro-Biology, vol. 13, no. 163, 2013. D. J¨ager, S. Pernitzsch, A. Richter, R. Backofen, C. Sharma, and R. Schmitz, “An archaeal sRNA targeting cis- and trans-encoded mRNAs via two distinct domains,” Nucleic Acids Research, vol. 40, no. 21, pp. 10964–10979, 2012. G. Endo and S. Silver, “CadC, the transcriptional regulatory protein of the cadmium resistance system of Staphylococcus aureus plasmid pI258,” Journal of Bacteriology, vol. 177, no. 15, pp. 4437–4441, 1995. E. Lira-Silva, M. Santiago-Martinez, V. Hern´andez-Ju´arez, R. Garcia-Contreras, R. Moreno-S´anchez, and R. Jasso-Ch´avez, “Activation of methanogenesis by cadmium in the marine archaeon Methanosarcina acetivorans,” PLoS ONE, vol. 7, no. 11, 2012. E. Lira-Silva, M. Santiago-Martinez, R. Garcia-Contreras et al., “Cd2+ resistance mechanisms in Methanosarcina acetivorans involve the increase in coenzyme M content and induction of biofilm synthesis,” Environmental Microbiology Reports, vol. 5, no. 6, Article ID 10.1111/1758-2229.12080, pp. 799–808, 2013. L. Gerosa, K. Kochanowski, M. Heinemann, and U. Sauer, “Dissecting specific and global transcriptional regulation of bacterial gene expression,” Molecular Systems Biology, vol. 9, p. 658, 2013. E. Roberts, A. Magis, J. O. Ortiz, W. Baumeister, and Z. LutheySchulten, “Noise contributions in an inducible genetic switch: a whole-cell simulation study,” PLOS Computational Biology, vol. 7, no. 3, p. e1002010, 2011. J. Cole, M. Hallock, P. Labhsetwar, J. Peterson, J. Stone, and Z. Luthey-Schulten, Stochastic Simulations of Cellular Processes: From Single Cells to Colonies, Chapter 13, Academic Press, 2013.