Availability. Open. Project. GB-BOHEME-2014. Project number. 320521 ...... Watson, D., Clark, L. A., and Tellegen, A. (1988). Development and validation of brief.
Towards a Generic Assessment Framework – Ideas and Cases
Note no Contributor Date
DART/02/2015 Wolfgang Leister July 2015
About the contributor to this note Dr. rer.nat. Wolfgang Leister is assistant research director at Norsk Regnesentral.
The front picture shows the Generic Assessment Framework that is presented in this note.
Norwegian Computing Center Norsk Regnesentral (Norwegian Computing Center, NR) is a private, independent, nonprofit foundation established in 1952. NR carries out contract research and development projects in the areas of information and communication technology and applied statistical modeling. The clients are a broad range of industrial, commercial and public service organizations in the national as well as the international market. Our scientific and technical capabilities are further developed in co-operation with The Research Council of Norway and key customers. The results of our projects may take the form of reports, software, prototypes, and short courses. A proof of the confidence and appreciation our clients have for us is given by the fact that most of our new contracts are signed with previous customers.
Title
Towards a Generic Assessment Framework: Ideas and Cases
Contributor
Wolfgang Leister
Quality assurance
Trenton Schulz
Date
July 2015
Publication number
DART/02/2015
Abstract This note describes ideas for a generic assessment framework (GAF) that can be applied to a variety of application areas. The GAF is structured into four Layers: the Scenario Layer, the Data Collection and Observer Layer, the Assessment Layer, and the Assessment Process Layer. The GAF can be used for purposes of estimation, validation, and decision making.
Keywords
assessment, framework, estimation, QoE
Target group
Research Community
Availability
Open
Project
GB-BOHEME-2014
Project number
320521
Research field
Smart information systems
Number of pages
23
© Copyright
Norwegian Computing Center
3
4
Towards a GAF
Contents 1
Introduction . . . . . . . . . . 1.1 Framework Concept. . . . . 1.2 The Use Phases of the GAF . 1.3 Where can the GAF be used? .
. . . .
. . . .
. . . .
. . . .
. . . .
. . . .
. . . .
. . . .
. . . .
. . . .
. . . .
7 7 8 8
2
The Generic Assessment Framework . . . . . 2.1 The GAF Scenario Layer . . . . . . . . . 2.2 The GAF Data Collection and Observer Layer 2.3 The GAF Assessment Layer . . . . . . . 2.4 The GAF Assessment Process Layer . . . .
. . . . .
. . . . .
. . . . .
. . . . .
. . . . .
. . . . .
. . . . .
. . . . .
. . . . .
. . . . .
9 9 10 10 10
3
Some Elements of the GAF Revisited . . . . 3.1 Subjective Assessment . . . . . . . . 3.2 Objective Assessment . . . . . . . . . 3.3 Physiological Assessment . . . . . . . 3.4 Observations and Assessment of Behaviour 3.5 Assessment of Context and Environment . 3.6 Collective Assessment. . . . . . . . .
. . . . . . .
. . . . . . .
. . . . . . .
. . . . . . .
. . . . . . .
. . . . . . .
. . . . . . .
. . . . . . .
. . . . . . .
. . . . . . .
12 12 12 12 13 13 14
4
Applying the Generic Assessment Framework. . . . . . . . 4.1 Framework for Assessment of Media Experience . . . . . 4.2 Framework for Assessment in the MOSKUS project . . . . 4.3 Framework for Assessment of Visitor Experience . . . . . 4.4 Framework for Assessment in the ASSET project . . . . . 4.5 Framework for Assessment of Trust . . . . . . . . . . 4.6 Framework for Assessment of Transparency and Openness .
. . . . . . .
. . . . . . .
. . . . . . .
. . . . . . .
15 15 16 17 17 18 19
5
Conclusion
. . . . . . . . . . . . . . . . . . . . . . . . . .
20
References . . . . . . . . . . . . . . . . . . . . . . . . . . . .
21
. . . .
. . . .
. . . .
. . . .
. . . .
. . . . . . .
Towards a GAF
5
1 Introduction There is a variety of applications where (technical) processes use opinions and feelings as input from a subject. Often, it is practically not viable to ask the subject about this information. Asking a subject at random moments would be considered as intrusive, disturb the concentration of the subject on other tasks or give irrelevant data when the subject has not decided or the decision process is complex. Extracting this information from other sources and estimating a subject’s opinion is the idea of this work. Instead of asking the subject, we intend to observe the subject’s actions and interaction with objects and individuals, measure the subject’s reactions, and evaluate the context to estimate the opinion on behalf of the subject. This work is related to how to assess the Quality of Experience (QoE) a subject experiences when interacting with an object and other subjects. QoE is a subjective measure of a user’s experience with a service or system. Without a sufficient score in QoE, a system or service will not be used and eventually be abandoned. System aspects of functionality, usability, universal design, security, etc. are ingredients of such a measure. The Generic Assessment Framework (GAF) is a further development of previous work to estimate user experience (Leister and Tjøstheim, 2012). There, the following assessment categories were used: a) subjective assessment based on questionnaires and ratings; b) objective assessment based on measurements at the object; c) physiological assessment based on sensor data from a subject; d) behaviour and interaction assessment: based on observations of the subject and the subject’s behaviour and interaction with both the object and other subjects; e) estimation models that use measurements from the object, its environment and context; and f ) collective assessment 1 based on measures that describe the collective experience of a group of subjects. In this note, we intend to extend and re-arrange this list and adapt it to a more generic framework. The goal of this work is to develop a comprehensive and practical framework for assessment and estimation of the parameters in question. In the remainder of this section, a simplified framework is presented and put into context. Section 2 defines the framework and describes its components. Section 3 describes elements of the GAF in detail with references to the literature. Section 4 applies the GAF to a variety of cases. Section 5 concludes this document.
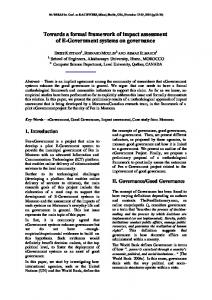
1.1 Framework Concept Figure 1 presents the GAF from a simplified perspective to identify the main concepts. The grey box on top represents the scenario under assessment containing the artifact, actions and interactions, the subject, other subjects, and stakeholders. The second row contains the type of assessments that can be performed. These are classified into the third row. The fourth row describes the process that is used: An estimation model is used to
1. The research note by Leister and Tjøstheim (2012) uses the term compound assessment. However, after discussion with colleagues, it was decided to use the term collective assessment instead.
Towards a GAF
7
Figure 1. Simplified view of the Generic Assessment Framework
estimate the subject’s opinion based on measurable properties. The estimation model in the GAF is intended to estimate properties from measured values. The values of these estimated properties are supposed to be close to those values that an observer or a subject would answer if asked in such a situation.
1.2 The Use Phases of the GAF For the use of the GAF, we distinguish between three phases, as also shown in Figure 1: a) the establishment of a relationship between observed values and the values of an index that represents the opinion of a subject or an observer; b) the calibration phase where measured values are assessed, e.g., in panel sessions, and related to the observed or subjectively assessed values described above. This will result in an estimation function that takes the measured values and outputs an estimated value; and c) the use phase where the estimation function is used to take the measured values and outputs estimated values for further processing on other modules.
1.3 Where can the GAF be used? The GAF can be used for a variety of purposes: a) estimation of the quality of some properties, such as experience, engagement, etc.; b) evaluation of properties, e.g., when evaluating technical solutions where it is difficult to retrieve opinions directly from subjects.; c) decision support where the output from the estimation model can be used to make decisions without bothering the user; decision support can be done both knowledge-driven and data-driven.
8
Towards a GAF
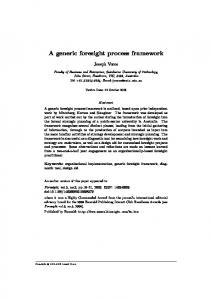
Figure 2. Generic Assessment Framework
2 The Generic Assessment Framework In this section, we describe the layers of the Generic Assessment Framework (GAF) that are: a) the scenario, b) the data collection methods, c) the assessment types, and d) the assessment process. We also describe how these elements play together. An outline of the GAF is shown in Figure 2. Note that the GAF needs to be adapted to application areas. In doing so, elements might be added or removed, and some objects might be re-arranged within the same layer.
2.1 The GAF Scenario Layer The GAF Scenario Layer describes what is assessed, who the actors are, what the actions are, and the relationships between them. We define the following elements and their graphical representation for the use in diagrams: 1) The artifact, also denoted as the object ; the artifact is represented by the symbol a cloud containing elements of the artifact.
as
2) The subject that is interacting with an object; the subject is represented by the yellow person symbol . 3) The action or interaction performed by the subject in relation to both the object and other subjects; the interaction is represented by varieties of the arrow symbol . 4) Other subjects can interact with both the subject and the artifact; these are represented with the red person as symbol (a group of red persons for groups). 5) Stakeholders are represented by the office building symbol . 6) The observer who might observe the other actors without interfering; the observer can be a human observer, represented by the blue person symbol , or a sensor-based observer (e.g., camera), represented by a camera symbol .
Towards a GAF
9
7) Groups of subjects, e.g., used in collective assessment, are denoted as a group of yellow persons .
2.2 The GAF Data Collection and Observer Layer The GAF Data Collection and Observer (DCO) Layer describes which data are collected and how these are collected from the elements of a scenario. We can distinguish between a) collection of technical data and parameters from an artifact such as files, log-files and event lists; b) data collected from artefact’s, subjects, or environment by sensors; c) data collected from sensors of various kinds; d) data from questionnaires given by, e.g., subjects; e) observers, both human observers and technical observers ; and f ) miscellaneous data sources.
2.3 The GAF Assessment Layer The GAF Assessment Layer describes the types of assessment that is performed. We identify some of the most relevant assessment types that are generic; however, other assessment types might be used in some occasions, and not all assessment types listed here need to be used in all assessments. The assessment types for the GAF are as follows: 1) Objective Assessment: Data from the artifact or object are retrieved, e.g., log data or measurements at the object. 2) Physiological Responses: Physiological responses of the subject, e.g., via sensor data or observations. 3) Behaviour and Interaction: Behaviour, actions, and interaction of subject with object and other subjects. These data can be quantitative and qualitative observations and also measurements, e.g., using an analysis programme. 4) Subjective Assessment: Opinions and scores given by the subject, e.g., by using surveys and questionnaires. 5) Observation of Subject: Observations by an observer who is not part of the interaction or other parts of the scenario. 6) Context (subjective): Indications about the subjective context of the subject. 7) Situation (objective): Data about the environment and context; these data can be static descriptions or measurements, such as temperature, humidity, weather conditions, light conditions, noise, olfactory data, and so on.
2.4 The GAF Assessment Process Layer The GAF Assessment Process Layer describes how the data from the Assessment Layer are processed in the estimation model. We distinguish between the following data: i) data that can be automatically retrieved and processed, e.g., technical parameters or sensor data; ii) data from surveys where a subject is asked to answer a questionnaire; these data
10
Towards a GAF
are often not in-situ, and the answering process might be intrusive, i.e., disturb the subject; iii) observation data by an external observer ( or
);
iv) static data that are stored, available, or known, e.g., from data bases, historical data. Data that can be automatically retrieved and processed, such as technical data or sensor data, can be used as the input to the estimation model and used for further processing and decision making. As input to the estimation model the values denoted with a bold arrow are used. Additionally, the values with stippled lines can be taken into consideration. Data that are visualised with dotted lines are used in the calibration process or for evaluation purposes only. Most of these data cannot be automatically processed; processing then needs human intervention of some kind. The GAF Assessment Process Layer contains the following elements: 1) Estimation Model: The estimation model is a mathematical model that takes the measurable assessment data as input and returns estimated values expressed in suitable metrics. These values will then be used further in the decision making. Note that the estimation model usually returns an estimated value for one subject at a time since personal data specific to the subject are involved in the calculation. Machine learning approaches (Bishop, 2006) are well suited to establish the estimation model. For the further use of the output from the estimation model, e.g., for decision support, both data-driven and knowledge driven approaches can be employed. 2) Collective Assessment: Collective assessment presents the rating for one installation based on the individual assessments by many subjects. Instead of assessing the data from subject the collective assessment shall show the opinion or values of a group . of subjects 3) Measures for evaluated properties: The result of the assessment process consists of measures for the evaluated properties. If suitable, this can be a vector of values that will be used in the process that requires such assessment data.
Towards a GAF
11
3 Some Elements of the GAF Revisited In this section, we present background information and references regarding elements of the GAF in more detail.
3.1 Subjective Assessment Subjective assessment is based on the opinion of the subject. The goal of a subjective assessment is to tell how a subject feels about the object (artifact). Usually, a standardised opinion questionnaire2 is used for subjective assessment. Metrics, such as the mean opinion scale (MOS), often used to assess the quality of media content, or the Likert-scale (Likert, 1932) are used.3 A Likert scale is a psychometric scale commonly involved in research that employs questionnaires. Watson et al. (1988) developed the Positive and Negative Affect Schedule (PANAS) scales that can be used for self-reporting of mood parameters. The PANAS scales are based on twenty different feelings and emotions that are mapped onto two axes, the Positive Affect (PA) and the Negative Affect (NA). PA and NA can be seen as orthogonal dimensions. Feelings and emotions are rated by a subject in a scale from 1 (very slightly or not at all) to 5 (extremely) given for different time horizons from the moment, via one to several days, weeks, months, and years to a general feeling. Thus, the PANAS can be used to rate both trait (long-term affect) and state (short term affect).
3.2 Objective Assessment Objective assessment methods use technical parameters and measurable values that are relevant to the assessment. As an example, when assessing media content, measures like the peak-signal-noise ratio (PSNR), variances in frame rate, dropout rate, and network parameters such as jitter, and delay. can be assessed (Leister et al., 2011). These parameters are often identical to parameters used to assess the Quality of Service (QoS) of an object. Other objective data could be retrieved from data that an object can register internally and report. Examples include timestamps, log data, paths taken in a decision sequence, finishing a decision sequence, and so on.
3.3 Physiological Assessment Physiological assessment is different from both subjective and objective assessment; physiological assessment results in data measured at the subject, but these data are not an opinion. However, physiological data might be correlated with subjective and objective data, a fact that is the idea behind the use of the GAF. Wilhelm and Grossmann (2010) present an extensive review of psycho-physiological monitoring, types of bio-signals, and emotion research. In medicine and in some of the subfields of psychology, biomedical sensor data are used for a range of purposes. Biomedical
2. See http://www.usabilitynet.org/tools/subjective.htm. 3. See http://en.wikipedia.org/wiki/Likert_scale.
12
Towards a GAF
sensor readings and their relation to emotions have been a research topic during the last two decades (Cacioppo et al., 1993; Cacioppo and Gardner, 1999; Cutmore and James, 2007; Gross and Levenson, 1995; Hatfield et al., 1993; Larsen et al., 2008; Rapson et al., 1993). These studies suggest that emotional reactions can be captured using biomedical sensors. Wang and Minor (2008) distinguish fifteen primary categories of human emotions. Russell (1980) associates two dimensions to emotions – valence and arousal. This model indicates that some types of emotion can be inferred from biomedical data. Valence is regarded as an individual dimension. Arousal, however, has been strongly correlated with physiological measures such as the galvanic skin response (GSR) (Boucsein, 1992). Lang (1995) reports a linear correlation between electrical conductivity and arousal, which might enable technologies for a fast physiological indication of arousal. Money and Agius (2009) demonstrate a system for video content summarisation using electro-dermal response, respiration amplitude, respiration rate, blood volume pulse, and heart rate as the physiological responses to video content. The heartbeat rate, measured with the electrocardiogram (ECG), has been shown to correlate significantly with skin conductance (Malmstrom et al., 1965; Sanches, 2008). Physiological reactions to emotions have an influence on the ECG, electro-myogram (EMG), galvanic skin resistance (GSR), skin temperature, pulse, etc. from the autonomous nervous system via peripheral signals, whereas signals from the central nervous systems can be measured by, for instance, electro-encephalograms (EEG).
3.4 Observations and Assessment of Behaviour Observations of subjects’ behaviour is quite common in visitor studies; observing and making notes, as well as video capture of the visitor are quite common research approaches. We can also think of automatic recognition of behaviour patterns, such as using the output of a Kinect (e.g., stick figures) or using a location system. There have been various studies in capturing the location and path of a visitor (Leister et al., 2007) using diverse location technology. Other approaches include the use of cameras that can extract certain features, e.g., a stick figure of a subject, analysis of a subject’s movements, emotions from faces (see the FaceReader software by Noldus Terzis et al., 2010), or similar approaches (Hernandez et al., 2012).
3.5 Assessment of Context and Environment Information about environment and context of the assessment needs to be part of any estimation of the QoE. There are many obvious examples that support that view, such as environmental variables including temperature and humidity, intrusiveness of the assessment equipment, whether the assessment is done in a lab or in a more natural setting, and so on. When using sensors, conflicting or incorrect results may occur through a large number of heterogeneous data sources, technical limitations in the sensors, aggregation, and defective sensor-generated data. Quality of Context (QoC) models have been proposed to quantify this inaccuracy (Neisse et al., 2008; Zimmer, 2006).
Towards a GAF
13
The evaluation and verification of QoC information will play a central role for applications depending on the consistency and correctness of provided context-aware data. This has been emphasised by Arnrich et al. (2010) for eHealth applications, where the tradeoff between a patient’s comfort and signal quality is highlighted (e.g., an unobtrusive dry ECG electrodes embedded into clothes may offer a higher level of comfort to end-users than classical wet electrodes). Therefore, there is a strong need to apply automatic quality control mechanisms to raw sensed data, by running error compensation algorithms; e.g., error detection in ECG signal based on changes in the electrode-skin impedance (Ottenbacher et al., 2008) or on accelerometers (Gibbs and Asada, 2005).
3.6 Collective Assessment Collective assessment presents the rating for one installation based on the individual assessments by many subjects. In principle, the results from the estimation model for each subject are retrieved and applied to a formula r = f ({ei }) where {ei } is the set of results from the estimation model. The Application Performance Index (APDEX) (Sevcik, 2005) is an open standard for a numerical measure of consumer satisfaction for groups of consumers, e.g., for evaluating response times. Leister et al. (2011) apply the APDEX to assess the collective QoE of video content for groups of subjects watching video over the Internet by using objective assessment data as input. Loosley (2010) presents the APDEX-G, where several APDEX concepts are generalised. APDEX-G defines the measurement domain as the set of all possible values to calculate the index from the Apdex tool, which calculates and reports APDEX Values. The values from the measurement domain are categorised into satisfaction levels (also denoted as quality levels, and defined by performance intervals. The satisfaction levels of satisfied, tolerating, and frustrated are defined, but it seems that the APDEX-G also can work with a different number of performance intervals. As described above, the APDEX-G is calculated as weighted sum of the members in each satisfaction level, divided by the number of measurements.
14
Towards a GAF
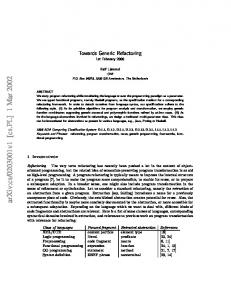
Figure 3. Assessment framework for the MOVIS project
4 Applying the Generic Assessment Framework In this section, we present how the GAF can be applied to various application areas. For this, we develop graphs with a similar layer structure as in the GAF and align the elements of these graphs with the elements of the GAF.
4.1 Framework for Assessment of Media Experience The MOVIS project developed a method that uses technical parameters from Internet traffic to predict how satisfied customers of a video service currently are. Leister et al. (2011) present an estimation model to rate media content from objective measurements, such as networking parameters for packet loss, jitter, and delay. For the development of the estimation model, subjective assessments of video quality using the SAMVIQ method were used. Assuming that the perceived quality depends on the influence of several factors in the delivery chain, the QoE value is expressed as a product of the original quality and a number of influencing factors. Each factor is related to a certain entity of the delivery chain and hereby represents the respective impact on the consumer quality. Thus, the estimated QoE for one consumer is defined as ˜ = QO · Q
Y
Mi ,
i∈{E,S,N,U,V,A}
where QO is the original quality measure, MA ≥ 1, and 0 < Mi ≤ 1 for i ∈ {E,S,N,U,V} being quality-relevant contributions from the members of the delivery chain. Setting Mi = 1 denotes the lack of influence, such as a transparent channel. Each of the values Mi = ai · mi (. . . ) consist of a weighting factor ai and a function mi (. . . ) that expresses the degradation for a specific member of the delivery chain. The weighting factors ai are calculated in a calibration step from subjective assessments. In this case, the evaluation phase of the project showed that the decision making in the MOVIS project could be done by using thresholds of certain mi values. The assessment framework for the MOVIS project is shown in Figure 3. In the terms of
Towards a GAF
15
Figure 4. Estimation Model for the MOSKUS project
the GAF, the artifact in the MOVIS project comprises of the video content and service. The action is observation of the video stream by a subject . In the DCO-layer of the GAF, the technical parameters were retrieved from the Internet traffic. The subjective assessment was done with user panels by a rating software developed for the SAMVIQ software. In the collective assessment, the assessed data from several subjects were used to develop the final model using a variant of the APDEX .
4.2 Framework for Assessment in the MOSKUS project The MOSKUS project develops a concept for self-management for patients suffering from arthritis. In a self-management system, the assessment of the current health conditions of the patient and processing these assessed data is necessary to present decisions to the patient. The MOSKUS concept uses both sensor data and subjective data assessed with questionnaires to evaluate a patient’s health condition (Leister et al., 2014a). The sensor data are retrieved when the patient performs exercises defined by the BASMI index. As questionnaires, the clinically approved indices ASDAS, BASDAI, and BASFI are used. It is envisaged that other types of data are retrieved to be used in the estimation model that produces input to the patient guidance module. Figure 4 shows the assessment framework for MOSKUS that contains the following elements: 1) The patient is the subject . 2) Data about context and situation are retrieved; some of these data might be measurable by sensors. 3) Technical parameters from sensors and applications using the sensors are used, e.g., the output from the BASMI/BASDAI as. 4) Physsessments. The sensors and training equipment are considered as the artifact iological responses that can be measured with sensors, e.g., FaceReader, pulse, skin conductance. 5) Subjective assessment is performed using questionnaires, e.g., using the ASDAS and BASDAI indices. 6) the interaction is the patient performing the assessment exercises and responding to the questionnaires. 7) Behaviour and interaction can be retrieved from observations; some of these might be sensor-based. Collective assessment is not performed in MOSKUS since the goal is to assess the health conditions for one patient and give advice to a specific patient.
16
Towards a GAF
Figure 5. Experience assessment framework for V ISITOR E NGAGEMENT, including interaction with other visitors
4.3 Framework for Assessment of Visitor Experience The V ISITOR E NGAGEMENT project develops methods to measure the engagement and experience of visitors in science centres and museums without bothering the visitors too much with intrusive methods (Leister et al., 2015; Tjøstheim et al., 2015). However, engagement and experience cannot be measured directly; therefore, the project envisages to assess engagement by measuring various data from the visitor, the installations, and the context and use these in a suitable estimation model. The project’s goal is to develop assessment methods for visitor experience that are not perceived as being intrusive. Intrusive assessment methods usually reduce the QoE, and, thus, impact the result of an assessment negatively. The assessment should last as long as a subject interacts with an artifact or simply consumes a service. Note that the goal of the V ISITOR E NGAGEMENT framework is not to assess the QoE of one specific visitor (the subject ), but to assess the experience a visitor gets when using an installation in a science centre. Figure 5 shows the assessment framework for the V ISITOR E NGAGEMENT project that contains the following elements: 1) The visitor is the subject . 2) The installation is the artifact . 3) The interaction is the visitor interacting with the installation and other visitors . 4) Data about context and situation are retrieved; some of these data might be measurable by sensors. 5) Technical parameters from the installations are retrieved. 6) Physiological responses and emotions are assessed with sensors, e.g., FaceReader, pulse, skin conductance. 7) Subjective assessment is performed using questionnaires. 8) Diverse types of context are taken into account, e.g., personal, physical, and social context as defined by Dierking and Falk (1992).
4.4 Framework for Assessment in the ASSET project Leister et al. (2014b) present an assessment framework for the ASSET project that can be used for evaluation purposes and as input for estimation models used for decision mak-
Towards a GAF
17
Figure 6. Assessment framework for adaptive security (ASSET project)
ing in adaptive security processes. The ASSET evaluation framework is based on scenarios and storylines that describe possible situations for the use of devices in the Internet of Things (IoT). Along these storylines, one can assess technical parameters, e.g., from sensors or the devices, while experts can observe these situations and give ratings for parameters qi that contribute to the measures to be assessed, e.g., ratings about security or QoS. The ASSET assessment framework is shown in Figure 6. It contains the following elements: 1) The patient using equipment from the IoT is the subject . 2) The artifact includes sensors, software systems, and communication systems from the IoT in eHealth. 3) The interaction is the patient using the eHealth equipment for monitoring and other health-related purposes. 4) Technical parameters are retrieved from the artefact’s . 5) The situation is rated by experts . 6) Subjective ratings by patients can be included in the process. Note that the ASSET assessment framework uses expert ratings rather than subjective data that express opinions by a subject.
4.5 Framework for Assessment of Trust Leister and Schulz (2012) present ideas for a trust indicator for the IoT. This indicator is intended to give a user information whether it is advisable to trust or distrust devices of the IoT at a given moment. The trust indicator is capable of giving an indication on one thing, service, or person at a time and does not take into account context or subjective factors. Trust cannot be captured directly. Therefore, measures of trust need to be estimated from other input and observations, such as the situation, objective assessment data, the trust indicator, behaviour and interaction, subjective assessment, context, and observation of subjects. Note that the estimation of trust is related to the term QoC, introduced in Section 3.5 The assessment framework for trust is shown in Figure 7. It contains the following elewith the IoT . 2) Other subjects and stakeholders ments: 1) The user interacts might be involved in the interaction, both knowingly and unknowingly for the subject. 3) The context plays a role in whether an item of the IoT can be trusted. 4) Technical
18
Towards a GAF
Figure 7. Assessment model for trust (uTRUSTit project)
parameters, data from sensors, observations, and surveys are part of the assessment process. 5) Since the trust of an artifact is in the foreground rather than the behaviour of the step is performed to estimate trust. single subject, a collective assessment
4.6 Framework for Assessment of Transparency and Openness We have worked on estimating the openness and transparency levels, including user satisfaction, corruption level, and other measures of public service organisations, e.g., municipalities (Leister, 2014). Here, it is intended that an indicator shall show an estimate of the current transparency level based on certain observations. This indicator can be implemented as an index value based on diverse input. The assessment model for openness has similarities to the assessment model for trust (see Section 4.5). To assess the transparency level of, e.g., a governmental website, the majority of the following aspects have to be taken into consideration: a) For the sake of transparency, the technology infrastructure needs to be robust and easy to use for the tasks of gathering, classifying, storing, and presenting information; b) information from a wide variety of sources must be accessed and presented to citizens in an intuitive, easy to use fashion; c) service performance must be satisfactory; d) financial information must be available for the citizen; e) access to public documents must be easy, and it must be easy to select a variety of documents. f ) relevance and accessibility, as well as comprehensible language, appropriate formats, etc. g) universal design is required by European law; access must be free from barriers to ensure accessibility for all. For instance, the Web Content Accessibility Guidelines by the W3C (WCAG) and other related accessibility guidelines need to be fulfilled for a service to be conformant. h) Information should be managed so that it is up-to-date, accurate, and complete. The assessment model for openness is shown in Figure 8. This model consists of 1) The is the use and citizen and diverse stakeholders are the subjects . 2) The interaction co-creation of content when communicating with municipalities. 3) The municipality and
Towards a GAF
19
Figure 8. Assessment framework for estimation of openness and transparency levels.
. 4) the context in which the its services, data, processes, etc. comprise of the artifact municipalities, citizen, and stakeholders operate is part of the model. We foresee the following detail-assessments: a) context and situation; b) licenses; c) data and metadata metrics; d) trust, privacy, and security metrics; e) simplicity and performance; f ) metrics for use and co-creation; and g) subjective assessment. The detail assessments (a)-(f) will be used as input to an estimation model that has as an output a raw transparency measure. This transparency measure needs to be calibrated and adjusted using both subjective assessment and information from the context and environment.
5 Conclusion This research note proposed the Generic Assessment Framework (GAF) that is applicable in a variety of areas. We presented how the GAF is built and how it can be applied. The GAF uses a layer structure with four layers: I) the Scenario Layer, II) the Data Collection & Observer Layer, III) the Assessment Layer, and IV) the Assessment Process Layer. The purpose of these layers is to structure the assessment process into independent building blocks that can be used flexibly. Within each layer, the elements may vary according to the application area. The intention is that the elements in each layer are as independent from each other as possible. The GAF has been applied to a selection of application cases. While doing this, the GAF has been refined and reached its current maturity degree. Further refinements and adjustment will be applied to the framework as possible weaknesses are found.
20
Towards a GAF
References Arnrich, B., Mayora, O., Bardram, J., and Tröster, G. (2010). Pervasive healthcare – paving the way for a pervasive, user-centered and preventive healthcare model. Journal of Methods of Information in Medicine, 49(1):67–73. Bishop, C. M. (2006). Pattern Recognition and Machine Learning (Information Science and Statistics). Springer-Verlag New York, Inc., Secaucus, NJ, USA. Boucsein, W. (1992). Electrodermal activity. Plenum Press. Cacioppo, J. T., Berntson, G. G., Klein, D. J., and Hatfield, E. (1993). The psychophysiology of emotion, chapter 9, pages 119–142. R. Lewis, J. M. Haviland-Jones, and L. F. Barrett (Eds.): The handbook of emotions. Guilford, New York. Cacioppo, J. T. and Gardner, W. L. (1999). Emotion. Annu Rev Psychol., 50:191–214. Cutmore, T. R. and James, D. A. (2007). Sensors and sensor systems for psychophysiological monitoring: A review of current trends. Journal of Psychophysiology, 21(1):51–71. Dierking, L. D. and Falk, J. H. (1992). Redefining the museum experience: the interactive experience model. Visitor Studies, 4(1):173–176. Gibbs, P. and Asada, H. H. (2005). Reducing motion artifact in wearable bio-sensors using MEMS accelerometers for active noise cancellation. American Control Conference, 2005. Proceedings of the 2005, 3:1581–1586. Gross, J. J. and Levenson, R. W. (1995). Emotion elicitation using films. Cognition & Emotion, 9(1):87–108. Hatfield, E., Cacioppo, J. T., and Rapson, R. L. (1993). Emotional contagion. Current Directions in Psychological Science, 2:96–99. Hernandez, J., Hoque, M. E., and Picard, R. W. (2012). Mood meter: large-scale and long-term smile monitoring system. In ACM SIGGRAPH 2012 Emerging Technologies, SIGGRAPH ’12, pages 15:1–15:1, New York, NY, USA. ACM. Lang, P. (1995). The emotion probe: Studies of motivation and attention. American psychologist, 50:372–372. Larsen, J. T., Berntson, G. G., Poehlmann, K. M., Ito, T. A., and Cacioppo, J. T. (2008). The psychophysiology of emotion, chapter 11, pages 180–195. R. Lewis, J. M. Haviland-Jones, and L. F. Barrett (Eds.): The handbook of emotions. Guilford, New York, 3rd edition. Leister, W. (2014). Estimation model for openness and transparency levels. personal notes. Leister, W., Berre, V., Boye, L. T., Østerås, N., Tjøstheim, I., Schulz, T., and Hagen, K. B. (2014a). Assessment with sensors for SpA patients, first iteration. NR Notat DART/03/2014, Norsk Regnesentral.
Towards a GAF
21
Leister, W., Boudko, S., and Røssvoll, T. H. (2011). Adaptive video streaming through estimation of subjective video quality. International Journal On Advances in Systems and Measurements, 4(1&2):109–121. Leister, W., Hamdi, M., Abie, H., Poslad, S., and Torjusen, A. (2014b). An evaluation framework for adaptive security for the IoT in eHealth. International Journal on Advances in Security, 7(3&4). Leister, W. and Schulz, T. (2012). Ideas for a trust indicator in the internet of things. In Leister, W. and Dini, P., editors, SMART 2012 (The First International Conference on Smart Systems, Devices and Technologies), pages 31–34. International Academy, Research and Industry Association (IARIA). Leister, W. and Tjøstheim, I. (2012). Concepts for User Experience research. NR Notat DART/14/2012, Norsk Regnesentral. Available from: http://publications.nr.no/ 1359467976/DART-14-2012.pdf. Leister, W., Tjøstheim, I., Joryd, G., and Schulz, T. (2015). jlifsci15v7n34-33025. In Leister, W., editor, Proc. PESARO 2015, The Fifth Intl. Conf. on Performance, Safety, and Robustness in Complex Systems and Applications, pages 21–27. IARIA. Leister, W., Tjøstheim, I., and Lous, J. (2007). Market research using a virtual test store on gaming technology. In Schulze, T., Preim, B., and Schumann, H., editors, Simulation und Visualisierung 2007, pages 399–411. ASIM - Arbeitsgemeinschaft Simulation, SCS Publishing House. Likert, R. (1932). A technique for the measurement of attitudes. Archives of Psychology, 22(140):1–55. Loosley, C. (2010). Apdex-G and Apdex-R composite sections 15. web pages. Available from: http://apdex.org/index.php/2010/09/ apdex-g-and-apdex-r-composite-sections-1-5. Malmstrom, E. J., Opton, E., and Lazarus, R. S. (1965). Heart rate measurement and the correlation of indices of arousal. Psychosom Med, 27(6):546–556. Money, A. G. and Agius, H. (2009). Analysing user physiological responses for affective video summarisation. Displays, 30(2):59–70. Neisse, R., Wegdam, M., and van Sinderen, M. (2008). Trustworthiness and quality of context information. In ICYCS, pages 1925–1931. IEEE Computer Society. Ottenbacher, J., Kirst, M., Jatobá, L., Huflejt, M., Grossmann, U., and Stork, W. (2008). Reliable motion artifact detection for ecg monitoring systems with dry electrodes. Proc. Annual International Conference of the IEEE Engineering in Medicine and Biology Society. IEEE Engineering in Medicine and Biology Society, 2008:1695–1698. Rapson, R. L., Hatfield, E., and Cacioppo, J. T. (1993). Emotional Contagion. Cambridge University Press.
22
Towards a GAF
Russell, J. A. (1980). A circumplex model of affect. Journal of Personality and Social Psychology, 39:1161–1178. Sanches, P. A. N. (2008). Supporting self-reflection in everyday life: An exploratory review of physiological input methods for the affective health system. Master’s thesis, Department of Computer and Systems Sciences, Stockholm University / Royal Institute of Technology. Sevcik, P. (2005). Defining the application performance index. Business Communications Review, pages 8–10. Terzis, V., Moridis, C. N., and Economides, A. A. (2010). Measuring instant emotions during a self-assessment test: the use of FaceReader. In Proceedings of the 7th International Conference on Methods and Techniques in Behavioral Research, MB ’10, pages 18:1–18:4, New York, NY, USA. ACM. Tjøstheim, I., Leister, W., Larssen, A., and Schulz, T. (2015). The role of emotion and enjoyment for qoe – a case study of a science centre installation. In Proc. QoMeX 2015, The 7th International Workshop on Quality of Multimedia Experience. IEEE. Wang, Y. J. and Minor, M. S. (2008). Validity, reliability, and applicability of psychophysiological techniques in marketing research. Psychology & Marketing, 25(2):197–232. Watson, D., Clark, L. A., and Tellegen, A. (1988). Development and validation of brief measures of positive and negative affect: the PANAS scales. Journal of Personality and Social Psychology, 54:1063–1070. Wilhelm, F. H. and Grossmann, P. (2010). Emotions beyond the laboratory: Theoretical fundaments, study design, and analytic strategies for advanced ambulatory assessment. Biological Psychology, 84:552–569. Zimmer, T. (2006). QoC: Quality of Context – improving the performance of contextaware applications. In Advances in Pervasive Computing. Adjunct Proceedings of Pervasive 2006. APC.
Towards a GAF
23