TOWARDS AN OPERATIONAL BIRD AVOIDANCE SYSTEM: COMBINING MODELS AND MEASUREMENTS Willem Bouten1*, Jelmer van Belle2, Ammar Benabdelkader3, Luit Buurma2, Hans van Gasteren2, Albert de Hoon2, Gerard Heuvelink1, Ruud Foppen4, Guido van Reenen1, Harry Seijmonsbergen1, Judy Shamoun1, Henk Sierdsema4 1
University of Amsterdam, Institute for Biodiversity and Ecosystem Dynamics (IBED) 2 Royal Netherlands Air Force (RNLAF) 3 University of Amsterdam, Informatics Institute 4 Dutch Centre for Field Ornithology (SOVON) * Corresponding author: Tel: +31-20 5257451, Fax: +31-20 5257431 Email:
[email protected]
Abstract The MPRadar in the north of the Netherlands plays a crucial role in RNLAF flight safety. Although this radar is one of the best for this purpose and detects birds at 150 km distance, less than 5 % of the relevant total 3D air volume over the Netherlands is measured. Especially the lower air layers are poorly sampled. Presently, expert knowledge of the “nature and ecotechnology” section of RNLAF is needed to extrapolate these measurements to the non-measured 3D air volume and to predict the expected short-term changes in bird densities. The BAMBAS team, a multidisciplinary team of biologists, physical geographers, modellers, and computer scientists, is working towards a Bird Avoidance System (BAS). First a grid cell based Bird Avoidance Model (BAM) will be developed by integrating existing knowledge and data into four concept driven and data driven interlinked sub-models, 1) an individually based model for passerine migration, including the simulation of hourly fuel dynamics, the bird’s use of meteorological opportunity windows, stopover decisions related to landscape characteristics, and wind drift corrections, 2) a multiple regression model for the 2D distribution of staging birds, based on habitat quality, vegetation characteristics and the spatial structure of the landscape, 3) a fuzzy logic model for birds that fly locally in the lower air layer, and 4) a regression model for local movements of soaring and gliding birds, based on weather conditions, including thermal convection. The latter two models will be superimposed on the model of staging birds. Results of the HIRLAM model, a European meso-scale meteorological model, will be used as meteorological input for the BAM. Model results will always deviate from the true bird densities to a certain extent. In the BAS, on-line radar measurements will be assimilated into the model. It is a major challenge to develop a BAM first and then a BAS by merging the local information of radar measurements with model results for the prediction of bird density dynamics in a reproducible and operator independent way. This system will be used to reduce the risk of bird strikes in real-time on a regional scale.
1.
Introduction
Bird strikes to aircraft are a major safety risk for military and civilian flights. Collisions often result in severe damage, occasionally in the destruction of an aircraft, and sometimes even in the loss of human life. Since the beginning of aviation, 52 civil aircraft have been lost due to bird strikes, involving 190 fatalities (THORPE, 1996). In Europe, 168 destroyed military aircraft were reported over a period ranging from 15 to 46 years, depending on the country involved (RICHARDSON, 1996). Every autumn 3-5 * 109 birds migrate over Europe to Africa. A country as small as the Netherlands houses up to 108 birds, that do not only sit on the ground or in trees but also share the air space. As an aircraft at full speed can not avoid a flying bird, there is a high need for the reconstruction of the complex spatio-temporal density distributions of birds. A forecast of these distributions would enable planners of military training missions to avoid periods and areas with high bird densities. This paper presents a multidisciplinary research working towards an operational next generation Bird Avoidance System (BAS). This BAS can be used to monitor and predict bird densities. We discuss the potentials and limitations of the reconstruction of time dependent 3D bird densities. First, we introduce the BAS requirements in relation to bird dynamics. Second, we present some radar features that show the necessity to model radar reflection to improve the interpretation of radar images. Third, and we discuss the development and calibration of simulation models that describe the flight behaviour of birds at different spatial and temporal scales. And finally, we introduce data-assimilation as a means to merge data flows of measurements and models into optimal predictions.
2.
BAS requirements in relation to bird dynamics
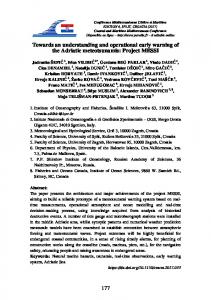
The BAS must consider the multi scale complex spatial and temporal dynamics of migration and local movements of birds [Figure 1]. On the one hand we have the seasonal trend of birds migrating to the south during autumn and to the north during spring. But on the other hand, there are also within-day trends during the migration seasons. Large birds with flapping flights, such as geese, ducks and waders, migrate at day and night. Small longdistance migrants, such as passerines, fly mostly at night. They take off around dusk and a peak density occurs at about 2 hours after dusk. After one or more days of stopover to forage, they wait for favourable meteorological conditions to take off again. Birds migrate at altitudes up to 4000 m with a median around 700 m. The flight height depends on the vertical wind distribution and the height of clouds. Diurnal migration occurs at lower heights and starts when nocturnal migration ceases. Peak densities are reached around sunrise. Soaring and gliding migrants like storks have their peak migration when atmospheric thermal updraft is highest. Local movements of birds are very dependent on habitat quality and on the connectivity of the landscape. Some birds have a very small action radius as they sleep and forage within their territory, whereas gulls may fly up to 100 km a day to bridge the distance between a garbage dump and their sleeping place. Locally soaring birds again take profit of thermal activity. During rainy weather, flight activity is low. This enumeration of general trends demonstrates the necessity to consider different temporal and spatial scales in the models that we are developing.
12
Mean echo density [echo/km3]
A 10
8
morning
6
evening 4
2
0 0
50
100
150
250
300
350
400
daynumber
12
mean echo density [echo/km3]
200
10
B
8
6
4
2
0 90
91
92
93
94
95
daynumber
Figure 1. Temporal dynamics of migrating birds, monitored in the 0-1000m air layer. A: Dynamics throughout the year 2001; B: dynamics throughout the day.
If we define the needs of the BAS from the applications viewpoint, we also need to consider different scales which are related to different users. As a cyclist in the Tour de France and a meteorologist are both interested in the weather forecast but from different points of view, so is the concern of bird densities of the pilot different from that of the expert, the biologist, who supports flight safety. In a typical military training mission, an F16 rises with 7 degrees while crossing the air layer with the highest bird densities and reaching a height of 2000 m at 20 km distance from the runway. Then the pilot flies to the “Temporarily Reserved Air space” (TRA) freed from civilian flights but sharing the air space with birds. After approximately 1.5 hours of exercises at various heights and a flight distance of 1200 km the pilot returns to the base. The pilot would like to have a pre-presentation of the bird strike risk over the planned route and scheduled period of time, with a high level of detail around the runway, and clear alarms for high risk areas. Like the cyclist, the pilot is not interested in any information beyond the route he will follow.
The expert who supports the flight safety of the air force, however, needs a much wider view for his task to predict the temporal dynamics of bird densities. As the meteorologist, the biologist makes interpretations by combining sources of information at different nested spatial and temporal scales. The overview of migration at the scale of Europe and the information on local flights of birds around airports are equally important. For his interpretation, the biologist does not only use measured bird densities but also model results and information on the environmental factors. Landscape features are more important when birds fly at a low altitude whereas the meteorological opportunity windows become more important the longer the distance and the higher the birds fly. The BAS must satisfy both these diverging needs. This means that it must be capable of presenting the data in such a way that the expert experiences the complex nature of bird behaviour at different scales, while the end-user experiences the simplicity of risk on his planned flight.
3.
Bird observations
The Netherlands has one of the densest networks of bird observations. About 7500 volunteers of the Dutch Centre for Field Ornithology (SOVON) map the territories of breeding birds and monitor staging birds in various projects of which some started already more than 40 years ago. All these data are available in digital format and most are processed in a GIS. In addition, the RNLAF has a separate database of birds around air fields including also weekly field observations with flight heights. In our research we also use two different radar systems: 1) A military Medium Power Long-range Surveillance Radar (MPR) currently forms the basis for the RNLAF bird warning system (BUURMA, 1995). It is a 20-40 kW, 3 GHz radar which is able to detect a songbird of 10 cm2 at 65 km distance with a 30 m range discrimination. The maximum detection range for larger birds is 150 km. It has a parabolic antenna with 12 stacked beams of which the two lowest beams are useful for bird detection. As these are very narrow angle beams (1.2o), not only the distance from the birds to the radar antenna is known but also a rough indication of the flight height is obtained. Ground clutter hampers the observation of birds in the lowest air layers up to 400 m.
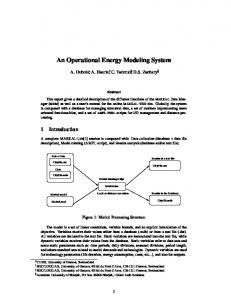
Figure 2. Inside view of the long-range air defence radar
2) A Tracking Radar with a wide angle search beam and a pencil beam with a small aperture and a 10 km range. This radar is used for scientific research. By superimposing subsequent rotations of horizontal scans with a beam tilted at a specified angle, flight altitude, speed and direction are calculated. Scans in the vertical plane yield precise altitudes and distances. By taking a sub-sample of the radar image around the bird and analysing it in the time domain, wing beat frequencies are calculated to identify the bird species. This radar is also used to study the lower air layers that are not sampled by the MPR. Figure 3. The mobile tracking radar with a fan beam for searching and a pencil beam for tracking birds
4.
Interpretation of radar screen images
Each bird or cluster of birds within the air volume appears as a speckle, projected on the 2D radar screen. Previously, these radar displays were time-lapse filmed and interpreted subjectively by an expert, but from the 1980s the analysis has become more and more automated. The bird echo extractor ROBIN (Radar Observation of Bird Intensity) samples either single passages of the radar beam or accumulates several beam rotations. From the size, strength and spatial distribution of echoes, ROBIN recognises rain clouds, ground clutter, aircraft and birds [Figure 4]. For bird detection and motion analysis ROBIN connects corresponding echoes in sequences of e.g.10 beam rotations (100s real time) into potential bird tracks. Connected bird echo’s in sequential frames are found on the basis of reflectivity and preset limits of speed and direction. Thus the obtained maps of bird movements [Figure 5 a, b and c] can be subjected to further statistical analyses.
Figure 4. A sequence of 25 superimposed radar images resulting in 10 minutes of time-lapse. This radar in Wier, in the North of the Netherlands (positioned in the middle) has a 1.3-2.5o beam (radius of 150 km). The image shows rainclouds (purple), groundclutter (purple), aircraft (long dashed lines) and a few birds (short full lines). The altitude of the birds (about 2000m) can be calculated from their distance from the middle and the tilting angle of the radar beam.
Figure 5. An example of a subsample of the radar image to demonstrate the motion analysis. Bird flight direction and speed is determined by searching connected points in subsequent images. These points are selected on the basis of limited variations of reflection intensity, motion speed, flight direction.
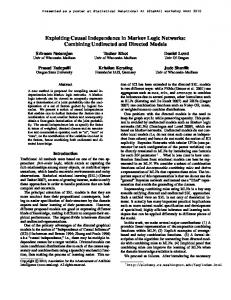
However, interpreting radar images generated by ROBIN is still not a trivial activity. Clearly, the interpretation is hampered by the projection of the time dependent 3D density distribution of birds onto a 2D radar screen. But there are also several other problems that need to be solved in the trajectory from speckles on the 2D radar screen to the reconstruction of the full 3D density distribution. These problems will be demonstrated in view of some examples of radar screens: 1. Back at the receiver, the power density of the radar signal is inversely proportional to the 4th power of the distance between the bird and the antenna. Figure 6A shows a radar screen that is saturated by high reflections close to the antenna whereas small birds at 150 km distance are below the detection limit. Figure 6B shows the result of the ROBIN motion analyses. 2. A narrow beam does not measure the total 3D air volume but only a small cone-shaped part of the total [Figure 7A]. 3. As the tilted beam crosses layers with varying bird density, figure 7A and 7C show how a donut appears on the screen in case of a bimodal density distribution as a function of height.
Figure 6A. A radar image (-0.1-1.1o beam) that is saturated as a result of an extremely high bird density
4. Birds may fly in flocks, but the radar cannot distinguish between a single large bird or a flock of small birds. 5. The reflection of a bird does not only increase with mass but it also varies with the angle between the bird’s orientation and the direction of the radar beam. 6. Part of the energy of the lowest beam may be deflected towards the earth surface. In the worst case, saturation of the screen with ground clutter makes the radar signal useless. In the best case, the deflection affects the interpretation of heights. The problems of 1, 2 and 3 can only be solved by either using many more radar installations, or by accepting that only about 5% of the relevant birds are detected by the radar. In the last case, dynamic bird distribution models are needed for spatial extrapolations. Aspect 4 may
be a problem for scientific research, but not that much for the flight safety warning system as it is not the number of birds that matters but merely the mass per km3. Problems 5 and 6 can not be solved without additional information. Radar reflection models are needed for a “correct” interpretation of the measurements themselves. Figure 6B. ROBIN motion analysis of the SSW window at 40-75 km from the radar: flight direction and speed (direction and length of lines) and mass of birds or birdflocks (colour of bullets)
A
B
C
Figure 7. Radar images of tilted beams. A: a scetch of a rotating tilted beam crossing a bimodal vertical distributions of bird densities (the speckles are hypothetical birds), B: Lowest beam (-0.1 to 1.1o), with some ground clutter, C: second beam (1.3 to 2.5o) which clearly shows the “donut” caused by a high bird density at an altitude of about 1700 m (W: wind direction, T: target direction, H: heading of birds).
5.
Modelling radar reflections
The aim of modelling radar images is to account for physical behaviour of the radar as mentioned under 5 and 6 and to make a 3D visualisation of bird mass density such that the expert does not need to make corrections while interpreting the 2D radar screen. The aspects of bird orientation and beam deflection will be further discussed. If the radar irradiates a bird from aside, the cross section area of its water containing body is much higher than when viewed head-on or tail-on. This effect of bird orientation is illustrated in figure 7C, which shows apparent higher bird densities in the NNE and SSW directions while temporal analyses point at a more homogeneous density distribution. If we look at figure 7C, birds seem to fly in almost eastern direction. In reality, however, birds face the ESE direction in order to establish their almost eastern flight direction with a SW wind. On the other way round, a known wind speed and direction and the tracked motion speed and direction of the birds allows us to calculate the bird’s orientation by simple vector mathematics, finally enabling us to make corrections. Anomalous propagation of the radar signal also hampers the direct interpretation of the radar image. Changes in the refractive index of the atmosphere affect the propagation of microwaves. As the refractive index of the atmosphere is a function of its density and thus of temperature, air pressure and water vapour pressure, and as these properties change with altitude, radar waves do not propagate in straight lines but tend to follow air layers with the lowest density. This anomalous propagation must me modelled as a function of the atmospheric conditions as the location of the reflecting bird may not be in the direction where the radar antenna is pointing. Moreover, if the radar beam bends down to the earth surface, this gives rise to an increased ground clutter. This ground clutter is recognisable by its zero motion speed and its non-unique appearance when long term temporal dynamics are included in the analyses (GRECU AND KRAJEWSKI, 2000). The inverse modelling of radar images, incorporating bird orientation and anomalous propagation of the radar signal, is necessary to translate speckle intensities and densities into density distributions of birds in mass per km3 of air.
6.
Modelling spatio-temporal dynamics of bird densities
Even if we are able to obtain reliable measurements by accounting for the above mentioned effects, we still have the problem of the limited air volume being measured. The aim of modelling bird flight behaviour is therefore to describe and predict full distributions of time dependent 3D bird densities. If this model is capable of mimicking the measurements, it can be used to extrapolate the measurements to non-measured locations and to predict potentially hazardous bird strike conditions hours or even days in advance. The different trajectories in the pilot’s training mission and the various types of bird flight activities require models at different scales. Bird migration in the higher air layers is largely driven by meteorological conditions with low spatial variability which reduces the demands for the spatial resolution. Bird flight paths around the runway of air fields, however, are highly determined by the structure of the landscape that shows a very high spatial variation. Therefore, modelling local flight behaviour of birds requires a spatial resolution of roughly 0.1-0.5 km2. Our time dependent 3D bird density model consists of four sub-models. As these sub-models describe different types of bird movements each with another extent of knowledge, and as the movements have dissimilar scales, different modelling techniques are being used, including data-driven as well as concept driven models. First, we discuss the top-layer with
migrating birds. Second, we describe the lowest layer with staging birds within the landscape. Finally we discuss the sub-models with local flight behaviour. 6.1
Model of migrating birds
The Netherlands lies on the migration route from Scandinavia to Spain and to Western Africa. Therefore, the modelled system for migration is as large as NW Europe. The model is based on the simulation of fuel dynamics of individual birds, superimposed on a grid cell framework that determines the local environmental conditions (ERNI et al., 2003). As meteorology is the main environmental factor determining flight behaviour of birds, grid cells (44x44 km) are taken equal to the grid cells of a High Resolution Limited Area Model (HIRLAM) (KÄLLEN, 1996), a European model that is being used for weather forecast. HIRLAM extends from the southern part of the Scandinavian countries to the north of Spain and generates hourly output of the main meteorological variables. After take off in Scandinavia, a bird flies towards a presumed final target area while optimising its flight path and dynamics. The flight speed is more or less constant which makes the use of fuel dependent on wind speed and direction. A nocturnal migration flight ends around sunrise or earlier if the meteorological conditions are unfavourable or if a certain fuel threshold value is reached. Then the bird searches a proper foraging area, forages for some days, and waits for a meteorological favourable condition to take off again. With the theoretical model of ERNI et al. (2003) as a starting point, we will adapt the model in such a way that it mimics the actual situation instead of the general trends. To this end, we include observations of the take-off of birds and the actual meteorological conditions as boundary conditions for the model. To improve the birds’ decisions-rules on flight height, wind drift compensation, and stop-over dynamics we will analyse field observations and radar data with artificial neural networks (ANN’s). An ANN is an adaptable non-linear data transformation structure that can “learn” the generalised relations between input and output data while being insensitive to measurement noise (HAYKIN, 1994). ANN’s originally were developed to imitate human mind but now they are also commonly used to model input-output relations. Although they have some properties in common, ANN’s substantially differ from multivariate regression analysis. While regression techniques always require a basic model type (linear, logarithmic, exponential), ANN’s do not need an a-priory model. An ANN thus is an appropriate tool to analyse the observed bird behaviour in relation to its environmental conditions. When the input-output response relations are found, these can be translated into fuzzy-rules. Fuzzy logic is a mathematical tool that enables the representation of (human) decision and evaluation processes in algorithmic form. It gives the possibility to model linguistic uncertainty by relating quantitative data to human logic expressions like “hot days’, ‘heavy rainfall’ and ‘high bird activity’. This type of model contains a still undefined number rules and parameters. These parameters sets are first constrained by published results and the limits set by flight optimisation and the chance of survival. Then, modelled flight dynamics will be compared with radar measurements of migrating birds. Finally, Bayesian parameter identification techniques (VRUGT et al., 2002) will be used to further reduce the prior parameter ranges and to identify correlations within the posterior parameter distributions.
6.2
Model of staging birds within the landscape
With this sub-model we aim at predicting the static 2D density distribution of birds, and in some cases the monthly dynamics, within the landscape at a 1 km2 spatial scale. Remote sensing data and vegetation maps are used to quantify the habitat quality and its spatial structure. Geo-referenced densities of the numbers of nest sites, territories and staging birds per km2 are related to habitat quality and landscape structure. Regression techniques and spatial interpolation techniques, like Kriging, are used to take advantages of both. Regression predicts the expected value based on independent control variables while spatial interpolation can describe the spatial structure in the errors of the regression model. In concept-driven models the knowledge obtained in this data-driving modelling and information on the auto-ecology from literature are used to create individualbased or patch-based spatial models (PETTIFOR et al. 2000, GOSS-CUSTARD et al. 2003). 6.3
Models of local flight movements
Time dependent 3D density distributions of locally flying birds are superimposed on 2D maps of birds within the landscape. Daily flight distances are deduced from landscape characteristics such as sleeping and foraging sites, open fields and corridors. Thereupon, field observations of flying birds, especially around airfields, and data of the tracking radar are correlated with landscape characteristics to model the daily flight paths and temporal trends. With respect to birds that forage in the air and soaring birds, the meteorological conditions and the landscape characteristics together determine the locations with favourable thermal updraft where scattered birds assemble to higher densities. Densities of flying birds are related to the 2D maps to calculate the flight characteristics which are thereupon summarised in fuzzy logic rules. Fuzzy logic is a promising method for modelling ecological processes if data availability is low, if processes are working at different spatial and temporal scales, and if only uncertain knowledge is available (ZIMMERMANN, 1996). Fuzzy logic also gives the opportunity to incorporate expert knowledge into mathematical models (DROESEN, 1996).
7.
Merging data from measurements and models
All model concepts, rules and parameterisations are based on existing bird data, combined with 2D landscape characteristics and time dependent 3D ambient meteorological conditions as controlling variables. But with the current knowledge neither these models nor the radar measurements are good enough on itself to forecast bird density. Therefore, we will merge the data flows of both sources to optimise the reconstruction and predictability of time dependent 3D bird density distributions. Data assimilation is a versatile methodology for estimating the distribution and evolution in space and time of state variables by combining all available information of the system, including measurements and dynamic models. Basically, it corrects for errors in the initial and boundary conditions of the model and it nudges the model towards the measurements, while accounting for uncertainties of observations and models and within the preset constraints of biological and physical causation as determined by the model. Data assimilation has been used traditionally in atmospheric and oceanic modelling (LE MARSHALL, 1998). There seems to be considerable potential for data assimilation to contribute powerfully to understanding, modelling and predicting biological-physical interactions over multiple scales in time and space. A data assimilation system consists of three components: a set of observations, a dynamic model, and a data assimilation scheme. Central to the concept of data assimilation is the
concept of errors, error estimation and uncertainty modelling. The systematic error sources of radar measurements were already discussed above. Temporal and spatial autocorrelations of measurements are used to quantify uncertainty ranges. But models may also deviate from reality as concepts, rules, discretisation, parameterisations, initial and boundary conditions are imperfect. Model uncertainty ranges are automatically obtained as a by-product of the Bayesian sensitivity analyses and parameter identification procedure. The fundamental question is, to what extent we “trust” our measurements and our model output. The data assimilation scheme and the specific use of data assimilation depend on the quality and quantity of data sets and models, and the purposes of estimates of state variables and parameters. The use includes the control of errors in the reconstruction and prediction of bird density dynamics, the identification of model parameters, the elucidation of model concepts and rules, or the design of optimal observation networks. Therefore, the combination of the 3D dynamic bird distribution model and the data-assimilation technique can certainly contribute to specifying the requirements of future automated observation networks and thus to infer what radars are best suited for the next generation BAS. The combination also enables us to answer the question of what the added value is of specific observations, in terms of prediction accuracy of the time dependent 3D bird density distribution.
8.
The operational Bird Avoidance System
From the foregoing, it is clear that the BAS cannot be based on the raw data of radar measurements only. Once we have succeeded 1) to interpret and correct radar measurements of bird reflections, and 2) to develop and calibrate spatial explicit dynamic models of bird movements at different scales, and 3) to quantify uncertainties that are involved in the measurements and model results, and 4) to use all this data to generate the best possible reconstruction and prediction of the spatio-temporal distribution of bird densities, then we still need to make the last step and translate these data into an operational system. The expert wishes to interactively interrogate the data in order to make his own interpretation, to understand the underlying system and to improve his skills. For this purpose, he expects an environment for opening up the 3D distribution, letting him move forward and backward in time and zoom in and out for interpreting the structures at different scales. The expert not only wants to gain insight in the data that is either based on the measurements or on the model extrapolations, but also the uncertainty ranges involved. To understand the spatio-temporal dynamics of birds, the bird densities should be shown in combination with the meteorological conditions and landscape features as these are the main controlling environmental variables. The pilot is more interested in a pre-presentation of the bird strike risk on the planned route. The combination of a flight simulator with the landscape as a reference and the ambient bird density presented as a bird strike risk would be best perceivable by the pilot.
9.
Conclusions
For almost three centuries, science was based on experiments and observations on the one hand and on theories and models on the other. Today, powerful computers enable a new kind of science based on the combination of three fundamental concepts: observations, theories and simulations. The same holds for the next generation Bird Avoidance Systems: an operational system should not be based on either radar measurements or theories only. Multiple realisations of computer simulations and data assimilation enable us to profit from measurements as well as theories and to quantify the ranges of uncertainties of our predictions. In this paper we presented our vision of how the next generation BAS should be implemented. Currently our research focuses on better models of bird densities. In the near future we shall use these models to improve the data assimilation aspects and to work toward an operational system. The development of this Bird Avoidance System doesn’t stand alone. It may be considered as an example of promising multi-disciplinary scientific approach in which observations, theories and simulations are vital components of the operational system. This approach of data-assimilation has already proven to be of great value for weather forecasts. Almost no ecological application has been published until now.
References BUURMA, L.S., 1995, Long-range surveillance radars as indicators of bird numbers aloft. Israel J. Zool. 41:221-236. DROESEN, W.J., 1996, Formalisation of ecohydrological expert knowledge applying fuzzy logic techniques. Ecol. Model., 85(1): 75-81. ERNI, B., F. LIECHTI & B. BRUDERER, 2003, How does a first year passerine migrant find its way? Simulating migration mechanisms and behavioural adaptations. Oikos (in press). GOSS-CUSTARD, J.D., R.A. STILLMAN, R.W.G. CALDOW, A.D. WEST & M. GUILLEMAIN 2003. Carrying capacity in overwintering birds: when are spatial models needed? J. of Appl. Ecology 40 (1): 176-187. GRECU, M. & W.F. KRAJEWSKI, 2000, An efficient methodology for detection of anomalous propagation echoes in radar reflectivity data using neural networks. J. Atm. Ocean. Technol.17: 21-129. HAYKIN, S., 1994, Neural networks, a comprehensive foundation. MacMillan College Publ. Comp., New York, 696pp. KÄLLEN, E. 1996, HIRLAM documentation manual, System 2.5, SMHI, 178 pp [Available from Erland Källen, SMHI, S-60179, Norrköping, Sweden]. LE MARSHALL, J., 1998, Cloud and water vapour motion vectors in tropical cyclone track forecasting – A review. Meteor. Atm. Phys. 65:141-151. VRUGT, J.A., W. BOUTEN, H.V. GUPTA & S. SOROOSHIAN, 2002. Toward improved identifiability of hydrologic model parameters: The information content of experimental data. Water Res. Res., 38 (12), 48-1: 48-13. PETTIFOR R.A, R.W.G. CALDOW, J.M. ROWCLIFFE, J.D. GOSS-CUSTARD, J.M. BLACK, K.H. HODDER, A.I. HOUSTON, A. LANG & J. WEBB 2000. Spatially explicit, individual-based, behavioural models of the annual cycle of two migratory goose populations. J. of Appl. Ecology 37 (Suppl. 1): 103-135. RICHARDSON, W.J., 1996, Serious birdstrike-related accidents to military aircraft of Europe and Israel: list and analysis of circumstances. Working paper 2, Proc 23th IBSC, London, May 1996. THORPE, J., 1996, Fatalities and destroyed civil aircraft due to bird strikes 1912-1995. Working paper 1, Proc. 23th IBSC, London, May 1996.
ZIMMERMANN, H.J., 1996, Fuzzy set theory and its applications, Kluwer Acad. Pupl., Boston, 435pp