This article has been accepted for publication in a future issue of this journal, but has not been fully edited. Content may change prior to final publication. Citation information: DOI 10.1109/ACCESS.2018.2832442, IEEE Access 1
Towards Energy Efficient Device-to-Device Content Dissemination in Cellular Networks Yanli Xu, Member, IEEE, Shengming Jiang, Senior Member, IEEE, Jinsong Wu, Senior Member, IEEE,
Abstract—Considering that future cellular networks are more content-centric, and content sharing among user equipments (UEs) is more universal, device-to-device (D2D) communication techniques become attractive for their applications to content delivery due to the characteristic of proximal transmissions without needs of high-rate backhaul. However, D2D content delivery may not be energy efficient due to shortage of useful contents for neighbor UEs when content caching and delivery are not well designed. In this paper, we propose an architecture using D2D multicast for content delivery in cellular networks and a practical methodology, which can indicate the time for delivery, the content to be disseminated, and the UEs to receive the delivery, to achieve more energy efficient content delivery for future green cellular networks. Index Terms—D2D communications, content delivery, energy efficiency, green cellular networks.
I. I NTRODUCTION ECENTLY, data traffic grows rapidly due to the development of mobile devices and wireless communication technologies. Mobile data traffic is expected to increase by a factor of 40 over the next five years [1]. Unlike the previous growth of mobile traffic, which mainly depended on the demands of connection-centric communications, such as phone calls and text messages, the recent and future growth would come from the explosion of content-centric communications such as video streaming and content sharing. However, content delivery aggravates the burden of the core network and is not energy efficient due to frequent content retrieval from base stations (BSs). Towards green fifth-generation (5G) cellular networks, some researchers have studied the utilization of small cell BSs with large storage units (such as hard-disks, solid-state drives) for content delivery to reduce the resource consumption by bringing content closer to users [2]–[5]. For example, system performance metrics such as outage probability and content delivery rate were analyzed in [2]. Caching strategies about how to store data at small cell BSs were studied in [3]– [5]. However, such small-cell architecture may cause bottlenecks of content delivery due to the requirement of highrate backhaul links as indicated in [6]. In device-to-device (D2D) communications, data are directly transmitted between user equipments (UEs) without the traverse of BSs and the transmission distance is usually short [7], [8], which will improve the resource efficiency. In addition, there is a large
R
Yanli Xu and Shengming Jiang are with the College of Information Engineering, Shanghai Maritime University, Shanghai, China. E-mail: {ylxu,smjiang}@shmtu.edu.cn Jinsong Wu is with the Department of Electrical Engineering, Universidad de Chile, Santiago, Chile. E-mail:
[email protected]
amount of content reuse among UEs, especially for popular contents. Thereby, D2D communications for content delivery have attracted great attention recently [9]–[11]. In [9], D2D pairs with common interests construct a cluster for D2D content sharing, where the number of requests from D2D UEs that could be served in a cluster and the optimized global density of served requests were analyzed. The work [10] analyzed the optimal cluster size for random and fixed caching via assuming that users cache popular video files and send them after receiving requests from other users in the same cluster. A tractable closed-form equation to find when redundant caching should be used in order to minimize the expected energy consumption was derived in [11]. However, these research works were based on a simplistic system model with the assumptions which did not accurately consider the effects of D2D interference or fading. Thus, some works analyzed the D2D content delivery problem based on stochastic geometry theory [12] with the Poisson Point Process (PPP) UE distribution [13]–[15]. For example, caching policy was studied for D2D communications in millimeterwave (mmWave) networks and the offloading gain of the proposed policy was analytically derived based on stochastic geometry theory in [13]. The work [14] optimized the D2D caching to maximize the total success probability of content delivery. The work [15] analyzed sharing content failure rate in a certain range and proposed an algorithm to determine the probability that content is cached in a server to minimize the failure probability. Particularly in [16], based on social relationships among mobile users and a heterogeneous but overlapping interests of users model, a graph based socialaware algorithm was proposed, in which cellular links and D2D links were established according to social ties and social contributions of users for efficient multi-file delivery. Through integrating network coding with D2D communication, [17] demonstrated the benefits of network coding for D2D content delivery and that the performance can be improved even by simple network coding. Note that the architecture of D2D content delivery was based on request-and-response pattern in most existing proposals. As advocated in [18], the multicast gain can play an important role in proactive caching for the 5G cellular networks. Realizing the advantage of multicast, UE multicast were used for content recovery of UEs in the same multicast group as an assistant method of cellular multicast in [19]–[21]. For content delivery based on D2D multicast, a model based on PPP was proposed and the system performance was analyzed in [22]. Considering that proximal UEs have clustering distribution and there may be multiple potential transmitters in a cluster,
2169-3536 (c) 2018 IEEE. Translations and content mining are permitted for academic research only. Personal use is also permitted, but republication/redistribution requires IEEE permission. See http://www.ieee.org/publications_standards/publications/rights/index.html for more information.
This article has been accepted for publication in a future issue of this journal, but has not been fully edited. Content may change prior to final publication. Citation information: DOI 10.1109/ACCESS.2018.2832442, IEEE Access 2
a multicast model based on Poisson cluster process was investigated for D2D cache and delivery in [23]. To distinguish appropriate conditions of employing unicast and multicast, performance metrics under different transmission environment parameters are investigated in [24]. In addition to the content delivery pattern, the energy efficiency of D2D content delivery needs to be considered for the sake of green 5G [25]. Towards energy efficient content delivery, centralized and distributed Medium Access Control (MAC) strategies are studied in [26], [27] to achieve balance between conserving energy and content delivery. In [28], social awareness was exploited in order to improve the energy efficiency of D2D cooperative communication. Different from previous works, we target to design energy-efficient D2D multicast from the perspective of network control in this paper, such as multicast range, multcast strategy and mode selection. Firstly, we propose a multicast content delivery architecture for content-centric cellular networks to improve the energy efficiency of video transmissions, based on which a transmission zone is defined and optimized to minimize the expected energy consumption for a required file per UE. In addition, a new caching and delivery strategy is proposed to maximize the number of UEs that can receive their required files. Furthermore, an evaluation metric is proposed to determine when to use D2D delivery. The contributions of this work are listed as follows. •
•
•
•
A novel architecture is proposed for D2D content delivery, by which a D2D UE multicasts cached files following an optimized distribution and other UEs are scheduled to receive it. A transmission zone is defined for the content delivery, which gives a constraint to UEs receiving the delivery. This zone is optimized to minimize the expected energy consumption of a required file per UE. A new caching and delivery strategy is proposed to maximize the number of UEs that can receive their required files. It can be used for determining which file is cached or disseminated. The energy efficiency problem is analyzed for D2D content delivery in comparison with that of cellular content delivery. Furthermore, an evaluation metric is proposed to determine which content delivery mode is better.
The remaining part of the paper is organized as follows. The system model is described and the D2D delivery problem is formulated in Section II. In Section III, the transmission energy of content delivery is analyzed and optimized, and the delivery distribution is modeled as an optimal problem and the solution is provided. Then the energy efficiency problem of D2D delivery is discussed and compared with that of BS content delivery in Section IV. Simulation results and related discussion are presented in Section V. Finally, Section VI concludes this paper. II. S YSTEM M ODEL A. Network and Channel Models For the sake of clarity, Table I lists main symbols used in the paper.
TABLE I D EFINITION OF U SED S YMBOLS Symbol
Meaning
λt λb λr Ei hij n0 dij Hij N0 α Ij γj γth fs (n) fr (n) β N Ti d0 k η0 Mj (n)
UE transmitter density BS density Receiver density Transmission power of transmitter i Coefficient of channel between nodes i and j Noise at receiver Distance between nodes i and j Fast fading power of the channel between nodes i and j Noise power Path loss factor Interference at the receiver j SINR at the receiver j SINR threshold for correctly decoding data Transmission probability for file n at a transmitter Required probability for file n at a UE Zipf exponet Number of files Targeted sharing zone (TSZ) of transmitter i Radius of TSZ Path loss compensatory exponent Targeted receiving power Conditional probability that receiver j requires file n when the transmitter transmits n Probability that receiver j correctly receives its required file Caching probability for file n at a UE Infinite small area Number of receivers that correctly receive the required file in a TSZ The upper bound of Nr Transmission efficiency coefficient Optimal transmission power of UE i Maximal transmission power of a UE Optimal radius of TSZ Caching and delivery efficiency coefficient Lagrange multiplier The probability that a UE j receives a required file under the D2D delivery mode Empty set The expectation of a UE receiving a required file under the D2D delivery mode The probability that a UE j receives a required file under the BS delivery mode Probability distribution function (pdf) of distance between UE and its served BS The expectation of a UE receiving a required file under the BS delivery mode D2D energy efficiency coefficient
ωj fc (n) dσ Nr Nru.b. ρ Ei∗ Emax d∗0 ζ δ ξD (j) ϕ ξD ξC (j) f (r) ξC εe
1) Network Model: We consider a cellular network where UEs are randomly located. UEs transmit data under either cellular mode or D2D mode. The transmission mode of a UE is selected by the BS based on a given mode selection criterion. Two UEs are neighbors if the Euclidean distance between them is smaller than a distance threshold and may communicate in the D2D mode. This maximally allowable distance for
2169-3536 (c) 2018 IEEE. Translations and content mining are permitted for academic research only. Personal use is also permitted, but republication/redistribution requires IEEE permission. See http://www.ieee.org/publications_standards/publications/rights/index.html for more information.
This article has been accepted for publication in a future issue of this journal, but has not been fully edited. Content may change prior to final publication. Citation information: DOI 10.1109/ACCESS.2018.2832442, IEEE Access 3
D2D communication is determined by the transmission power and the used power control scheme of transmitters. There are two ways for the in-band coexistence of different modes, i.e., D2D UEs reusing resource of cellular UEs (underlaying coexistence) and using the orthogonal resource of cellular UEs (overlaying coexistence), respectively. Both of coexistent ways have been widely studied in prior works [29]– [31]. Compared to orthogonal resource allocation, a resource reuse scheme may improve spectrum efficiency while leads to severer interference and higher implementation complexity. In this paper, we focus on the efficiency of orthogonal resource allocation case and readers can refer to prior works on the spectrum efficiency of different coexistence ways such as [32]– [34]. For simultaneous D2D transmitters, uplink resources are spatially reused to save bandwidth since interference among them can be well controlled due to the short transmission range of these communication links. Similar to [22], stochastic geometry is used for the modeling of UE distributions for D2D multicast. Particularly, the positions of multicast D2D transmitters form an independent PPP Ψt with density λt . For each D2D transmitter, the positions of its intended receivers are independently uniformly scattered around the transmitter in the multicast range which is centered at the transmitter with radius d0 . Thereby, the receiver density of a multicast transmitter is a constant independent to d0 , which is denoted as λr here. 2) Channel Model: We assume that UEs are half-duplex constraint. All UEs are synchronized with BSs. For a communication link i → j, the signal received at the node j can be expressed as √ yj = Ei hij xi + n0 , (1) where Ei denotes the transmission power of node i, and n0 is the thermal noise. hij denotes the channel coefficient 2 2 between nodes i and j, which satisfies |hij | = h′ij d−α ij , h′ij characterizes the rapid fading, dij is the distance between i and j, and α is the path loss exponent. It is assumed that the channel undergoes the flat Rayleigh fading and h′ij follows zero-mean circular-symmetric complex Gaussian distribution CN (0, 1/µij ). Signal-interference-ratio (SIR) distribution is independent of µij in the interference limited system while µij will affect the system performance when the noise is considered. Here we let µij = 1 for simplification when noise is ignored. In this work, we focus on the performance of multicast delivery, which is analyzed by randomly selecting a multicast transmitter i and its corresponding receivers. Considering that the transmitter is the same for these receivers, with a slight abuse of notation, we omit i when we analyze the multicast performance of a receiver of i in the left part of this work, e.g., receiving signal strength, SINR and the probability that the multicast file meeting the requirement of a receiver. For a receiver j, the received signal to noise and interference ratio (SINR) γj can be expressed as γj =
Ei d−α ij Hij Ij + N 0
,
(2)
2 where Ij is the interference at the receiver j and Hij = h′ij .
Then, a successful transmission of the link i → j needs to satisfy γj ≥ γth , (3) where γth is the required SINR for an effective communication. B. Content Delivery Models e , which is populated with Each UE has a cache with size N some video files with the same size. We assume that the probability that a UE caches a file n is fc (n), and the distribution of cached files is independent identically distributed (iid) at each UE. Not all of these cached contents are required by the UE itself. However, it may provide useful contents to its neighbors by D2D multicast. Similarly, this UE can also benefit from the content cached by other UEs. Hence, this caching policy is mutually beneficial. Assuming that all contents have the same size, UEs disseminate these cached contents to nearby UEs in their transmission resources to bring popular contents closer to users. Here two ways for content delivery can be utilized according to a pre-defined mode selection strategy, i.e., D2D delivery and cellular delivery. The pre-defined delivery strategy is that UE or BS transmits content following a certain distribution fs , which is iid at each UE and BS. Based on this distribution, the transmission probability of a content in a cache is determined. For example, multicast transmitters transmit file n with probability fs (n) in allocated bandwidth during a multicast period. All neighbor UEs of a multicast transmitter will be potential receivers. These potential receivers which have no data to transmit will be scheduled by BS to listen the muticast files of their neighbor transmitters. When a UE be a potential receiver of multiple multicast transmitters, BS randomly selects a multicast transmitter for it. The neighbor relationship among UEs can be obtained by BS during the neighbor discovery period which is an essential procedure before D2D communications standardized by the 3rd Generation Partnership Project (3GPP) [35]. We use popularity to describe the probability of a file being required by a UE. That is, the required statistics for video files are modeled by a Zipf distribution, which has been shown to fit well with video requirement and widely used for the analysis of D2D caching [36]–[38]. Hence, the probability fr (n) that file n is required by UE can be expressed by [N ]−1 1 ∑ 1 fr (n) = β , (4) n lβ l=1
where β is the Zipf exponent, n is the nth most popular video e ). and N is the number of files (N ≤ N III. D2D C ONTENT D ELIVERY S TRATEGIES A. Delivery Energy and Coverage We call a UE, which can benefit from the content delivery by receiving its required file, as a benefiting UE (BUE). For D2D delivery, the number of BUEs is one key evaluation metric to determine the efficiency of delivery. Since the
2169-3536 (c) 2018 IEEE. Translations and content mining are permitted for academic research only. Personal use is also permitted, but republication/redistribution requires IEEE permission. See http://www.ieee.org/publications_standards/publications/rights/index.html for more information.
This article has been accepted for publication in a future issue of this journal, but has not been fully edited. Content may change prior to final publication. Citation information: DOI 10.1109/ACCESS.2018.2832442, IEEE Access 4
number of BUEs depends on the coverage of a transmitter, we first give the following definition. Definition 1. A targeted sharing zone (TSZ) is the area that a transmitting UE targets to cover for sharing its cached files. For a transmitter i, its TSZ Ti can be modeled as a circle with center i and radius d0 . We assume that the path loss is compensated by power control, i.e., Ei = η0 dkα 0 ,
(5)
where k is the path loss compensatory exponent, and η0 is the targeted receiving power at the receiver. Since the goal of D2D caching and delivery is to meet file requirement of UEs in the network through proximal transmission, a UE having no data to transmit is scheduled to receive files as long as it locates in the TSZ of a transmitter. Several transmitters may cover a receiver simultaneously and the receiver randomly selects a transmitter. Since simultaneous transmitters spatially reuse transmission resources, the signals from different transmitters may be interfered with each other at the receiver. For a receiver j and its transmitter i, the SINR of the received signal γj at j can be expressed as γj = =
Ei Hij d−α ij Ij + N0 −α η0 dkα 0 Hij dij ∑ −α η0 dkα 0 Hlj dlj + N0 ∑
l∈Ψt \i
Hij d−α ij Hlj d−α lj +
N0 η0 dkα 0
Pr {Rj = n, Sj = n} Pr {Sj = n}
= Pr {Rj = n} [N ]−1 1 ∑ 1 = β . n lβ
(9)
l=1
Including (8) and (9) into (7) yields the conditional probability that file n meets the requirement at j as follows: ( ) exp −κd2ij n1β . (10) Mj (n) = N ∑ 1 l=1
lβ
For the receiver j, the probability ωj that its receiving file meets its requirement when it is in the TSZ of transmitter i can be given by N ∑
Pr {Sj = n} Mj (n),
(6)
.
where Pr {Sj = n} is the probability that transmitter i caches file n and sends it, which can be written as Pr {Sj = n} = fc (n) fs (n) ,
Mj (n) = Pr {γj ≥ γth } Pr {Rj = n|Sj = n} ,
(7)
where Pr {Rj = n|Sj = n} is the conditional probability that UE j requires file n when UE i sends this file. We assume that Hij is exponentially distributed and noise is negligible. The first part in (7) can be calculated by (8), i.e., { } ∑ −α α Pr {γj ≥ γth } = Pr Hij ≥ γth dij dlj Hij l∈Ψt
[ ( )] ′ = E exp −γth dα ij Ij ( ) = LI ′ j γth dα ij ( ) m 2 = exp −πλt mΓ (m) (1 − m) γth dij ( ) = exp −κd2ij , Ij′
=
(11)
n=1
Denote the file sent by transmitter i as Si and the file required by receiver j as Rj . When i transmits file n, the conditional probability Mj (n) that n meets the requirement of j is
where LI ′ j is the Laplace transform of
Pr {Rj = n|Sj = n} =
ωj =
l∈Ψt \i
=
density of simultaneous transmitters. From (8), we see that the average successful transmission is affected by path loss (determined by link distance) and the density of simultaneous transmitters (determined by scheduling). The second part in (7) can be derived by
where fc (n) and fs (n) are probabilities that the transmitter caches file n and sends it, respectively. Including (10) and (12) into (11), we have ωj =
N ∑
l∈Ψt
(8) d−α lj Hij ,
m , m = α2 and Γ (·) is the Gamκ = πλt mΓ (m) (1 − m) γth ma function. The impact of interference from simultaneous transmitters is implicitly embodied by κ based on stochastic geometry analyses (Appendix A in [39]), which depends on the density of simultaneous transmitters (λt ). That is, κ increases with interference which is led by the increase of the
Pr {Sj = n} Mj (n)
n=1
( ) exp −κd2ij n1β = fc (n) fs (n) N ∑ 1 n=1 N ∑
l=1
lβ
( ) N exp −κd2ij ∑ 1 = fc (n) fs (n) β . N ∑ 1 n n=1 l=1
∑
(12)
(13)
lβ
From (13), we observe that larger transmission distance dij leads to a decrease of meeting probability ωj . From this perspective, the coverage of i, TSZ Ti , does not need to be too large. However, larger Ti may bring benefits to more receivers who need this file for a fixed receiver density. For an optimal TSZ of a transmitter in a general view, we then analyze the total number of receivers that successfully receive their required files, i.e., the BUE number Nr in Ti . Let dσ be an infinitely small area of the TSZ on interval [τ, τ + dτ ]. Since the probability that there are more than two UEs in dσ can be neglected, the number of receivers that obtain required files in dσ can be expressed as λr ωdσ , where ωdσ is the receiving
2169-3536 (c) 2018 IEEE. Translations and content mining are permitted for academic research only. Personal use is also permitted, but republication/redistribution requires IEEE permission. See http://www.ieee.org/publications_standards/publications/rights/index.html for more information.
This article has been accepted for publication in a future issue of this journal, but has not been fully edited. Content may change prior to final publication. Citation information: DOI 10.1109/ACCESS.2018.2832442, IEEE Access 5
probability at dσ and can be obtained from (13) through using τ instead of dij , i.e., ( ) N exp −κτ 2 ∑ 1 ωdσ = (14) fc (n) fs (n) β . N ∑ n 1 n=1 l=1
lβ
With the number of BUEs at location dσ , Nr in the TSZ can be calculated by traversing all locations in the TSZ as follows. ∫ Nr = λr ωdσ dσ ∫
Ti 2π
∫
d0
= λr
ωdσ τ dτ 0
0
N ( )] ∑ πλr [ 1 2 1 − exp −κd fc (n) fs (n) β . 0 N ∑ 1 n n=1
= κ
Considering that d0 increases with the transmission power, we can conclude from above analyses that Nr increases with the D2D transmission power before achieving the upper bound. However, it is not energy-efficient to increase Nr at the cost of increasing energy consumption due to the low energy capacity of UE and the energy conservation requirement of green networks. To increase Nr with less energy consumption, we firstly evaluate the efficiency of content delivery in cellular networks. Denote the transmission efficiency coefficient ρ as the average energy consumption of a successful acquisition for required files at receivers in a TSZ, i.e.,
lβ
l=1
ρ=
Nru.b. = κ
N πλr ∑ 1 fc (n) fs (n) β . N ∑ n 1 n=1 l=1
(16)
lβ
Proof: Taking the derivative of Nr in (15) with respect to d0 , we can obtain the derivation ν as follows: N )] ∑ [ ( πλr ν = ∂d∂ 0 ∑ 1 − exp −κd20 fc (n) fs (n) n1β N 1 n=1 κ
lβ l=1
N ) πλr ∑ ( = 2κd0 exp −κd20 ∑ fc (n) fs (n) n1β > 0. (17) N 1 n=1 κ
Ei
ρ= κ
Nru.b. ,
which can be calculated by
Nru.b. = lim
d0 →∞
= κ
κ
πλr N ∑ 1 l=1
lβ
N ( )] ∑ πλr [ 1 2 1 − exp −κd fc (n) fs (n) β 0 N ∑ n 1 n=1 l=1 N ∑ n=1
N ∑
exp (−κd20 )]
1 lβ
lβ
fc (n) fs (n)
1 . nβ
(19)
. fc (n) fs (n)
n=1
(22)
1 nβ
Since the energy consumption and interference among transmitters also increase with Ei , there is a trade-off between Ei and Nr . Concerning the optimal transmission power and its corresponding TSZ of a given transmitter, we have the following proposition. Proposition 2. To minimize the transmission efficiency coefficient ρ under the transmission power constraint Emax of a UE, i.e., minimizing the average energy consumption for a successful file delivery from transmitter i to its receivers, the optimal transmission power Ei∗ should satisfy { Ei∗
=
fi E Emax
fi ≤ Emax E fi > Emax E
,
(23)
fi needs to satisfy where E m′ ( ( ) ) fi κ f m′ κm′ E κ f m′ exp − m′ Ei + exp − m′ Ei − 1 = 0. ′ η0 η0m η0 (24)
Proof: To minimize the average energy consumption of file delivery for a BUE, the optimal problem can be formulated as follows: min
Ei
ρ= πλr
For a targeted coverage with radius d0 , the transmission power needs to be Ei = η0 dkα 0 according to the power control strategy. That is, the delivery range is determined by the transmission power as follows: 1 ( ) kα Ei . (20) d0 = η0
N ∑
l=1
lβ
d0 →∞
Nr has an upper bound
[1 −
πλr
l=1
Thus, Nr increases with d0 , i.e., the coverage range of the TSZ. Since lim ν = 0, (18)
(21)
Through applying (15) into (21), we can obtain ρ as follows:
(15) Proposition 1. Given a transmitter, the number Nr of BUEs in its TSZ increases with the increase of coverage range of the TSZ, while this increase has an upper bound. Moreover, the upper bound Nru.b. of Nr can be expressed by
Ei . Nr
κ
N ∑
[1 − exp (−κd20 )]
1 lβ
N ∑ n=1
fc (n) fs (n) n1β
l=1
s.t. 0 < Ei ≤ Emax .
(25)
1 ( ) kα i To solve (25), we include d0 = E into the objective η0 function (25), and then take the derivative of ρ with respect
2169-3536 (c) 2018 IEEE. Translations and content mining are permitted for academic research only. Personal use is also permitted, but republication/redistribution requires IEEE permission. See http://www.ieee.org/publications_standards/publications/rights/index.html for more information.
This article has been accepted for publication in a future issue of this journal, but has not been fully edited. Content may change prior to final publication. Citation information: DOI 10.1109/ACCESS.2018.2832442, IEEE Access 6
For a constructed unicast link i → j, the energy consumption of a successful delivery can be calculated by
to Ei , i.e., ν′ =
∂ ∂Ei
Ei [1 −
πλc
κ
N ∑
exp (−κd20 )]
1 lβ
l=1
N ∑
fc (n) fs (n)
n=1
−1
N πλ ∑ 1 r = N fc (n) fs (n) β n ∑ 1 n=1 κ lβ
∂[
(
εsucc = u
1 nβ
Ei
1−exp −
κ ηm 0
′
′
)]
Eim
∂Ei
l=1
[ ( )] ( ) ′ κm′ E m κ κ m′ m′ 1 − exp − ηm − ηm′i exp − ηm ′ Ei ′ Ei 0 0 0 , =A )]2 [ ( ′ κ 1 − exp − ηm′ Eim 0
(26) where m′ =
2 kα
−1
N πλ ∑ 1 r and A = N ∑ 1 n=1 fc (n) fs (n) nβ κ
.
lβ l=1
fi satisfying Letting ν ′ = 0, we can obtain the optimal E ( ) κ f m′ exp − m′ Ei − 1 = 0, η0 (27) which can be resolved easily using numerical methods. Based on Proposition 2, the optimal radius d∗0 of a TSZ for a transmitter can be calculated by using (20), i.e., d∗0 = 1 ( ∗ ) kα Ei . In addition, from this proposition, we can find that η0 ∗ Ei is determined by wireless environment parameters such as transmitter density, path loss factor, decoding threshold, and so on, and is independent to the caching distribution and content delivery distributions (fc , fs ). However, fc and fs affect the probability that BUEs in the TSZ receive their required files. Without considering energy consumption, the coverage radius d0 and Nr can increase infinitely with transmission power. Although more UEs may benefit from once multicast, the benefit of D2D content delivery is reduced compared with BS content delivery, and interference becomes severer due to longer transmission distance. (
κ f m′ exp − m′ E i η0
)
fi κm′ E + ′ η0m
m′
B. Comparison of Energy Efficiency for D2D Multicast and Unicast With the push strategy studied in this work, more than one BUE may exit for once multicast. To understand the advantages and constraints of energy efficiency for this push strategy, we compare the energy efficiency of D2D multicast and unicast (request-and-response strategy) here. For fair comparison, we evaluate the average transmission energy consumption per request for two strategies to show which one is more energy efficient via taking content request, user distribution and wireless transmission environment into consideration. For the unicast content delivery, the transmission power can be expressed by Ei =
η0 dα ij .
(28)
η0 dα Ei ( ij ) . = Pr {γij ≥ γth |i} exp −κd2ij
(29)
By averaging the location of transmitters, the average consumed energy of serving a request, ρu , can be calculated by ∫ ρu = εsucc dσ u s ∫ 2π ∫ d0 η0 τ α = λt τ dτ exp (−κτ 2 ) 0 (0 α ) (α ) α = λt B 1, + 1 d20 1 F1 + 1; + 2; κd20 ,(30) 2 2 2 where σ is an infinite small area, B (x, y) is the Beta function and 1 F1 (x; y; z) is the Degenerate hypergeometric function. For the multicast content delivery, the transmission power is η0 dα 0 for once transmission since the targeted delivery distance is d0 . Taking power control into consideration, unicast may be more energy efficient than multicast. For example, although the farthest receiver in the targeted coverage of multicast does not need the transmitted content, the transmission power is also fixed as εm . Even if the transmission power can be adaptively adjusted according to the distance of the farthest receiver requiring this content, energy is also consumed by overhead. However, multiple UEs may benefit from once multicast by receiving required or to be required contents. In this perspective, multicast is more energy efficient than unicast. As analyzed in the last subsection, the average energy consumed by a successful content requirement for a BUE is expressed by ρ, which is re-written as −1 N πλ [ ( )] ∑ 1 r ρ = Ei N 1 − exp −κd20 fc (n) fs (n) β n ∑ 1 n=1 κ lβ
.
l=1
(31) Hence, we can resort to (30) and (31) to compare the energy efficiency of two strategies. From the comparison we observe that not only the UE densities (receiver density and transmitter density) but also caching and delivery strategies will affect the final efficiency of D2D multicast delivery. C. Caching and Delivery Strategies From (15), we can see that, besides the transmission power Ei , the number of BUEs that receive required files (Nr ) also depends on the caching and delivery schemes, i.e., the probability for the transmitter to cache and disseminate files. In addition, they also impact the advantages of the push strategy. Here we discuss the caching and delivery distributions (fc and fs ) of a transmitter to improve the D2D content delivery efficiency. Let ζ denote a caching and delivery efficiency coefficient which characterizes the impact from caching and delivery distributions on the delivery performance, i.e., ζ=
N ∑ n=1
fc (n) fs (n)
1 . nβ
(32)
2169-3536 (c) 2018 IEEE. Translations and content mining are permitted for academic research only. Personal use is also permitted, but republication/redistribution requires IEEE permission. See http://www.ieee.org/publications_standards/publications/rights/index.html for more information.
This article has been accepted for publication in a future issue of this journal, but has not been fully edited. Content may change prior to final publication. Citation information: DOI 10.1109/ACCESS.2018.2832442, IEEE Access 7
The derivation of (15) shows that Nr grows with ζ for a given transmission power. Thus, to maximize Nr , i.e., maximizing the average number of receivers that obtain the required files, ζ needs to be maximized. The optimal problem can be formulated as follows: max
ζ=
N ∑
fc (n) fs (n)
n=1 N ∑
s.t.
IV. D ELIVERY M ODE S ELECTION
fc (n) = 1
fs (n) = 1.
(33)
n=1
With the Lagrange multipliers method, the objective function of this optimal problem can be written as (N ) N ∑ ∑ 1 L (g, δ) = fc (n) fs (n) β + δ1 fc (n) − 1 n n=1 n=1 (N ) ∑ +δ2 fs (n) − 1 , (34) n=1
where δ1 and δ2 are the Lagrange multipliers. To maximize the objective function in (33), we calculate the partial derivation of L (g, δ) with respect to fs (n) and fc (n) by ∂ 1 L (g, δ) = fs (n) β + δ1 , ∂fc (n) n
n = 1, 2 · · · N, (35a)
∂ 1 L (g, δ) = fc (n) β + δ2 , ∂fs (n) n
n = 1, 2 · · · N. (35b)
Since for all files, i.e., n = 1, 2 · · · N , (35a) needs to be satisfied, we can obtain the relationship of the cached probabilities among these different files, which can be expressed as ( )β fc (p) q (36) = p ̸= q. fc (q) p Due to
Based on above Theorem, more UEs can benefit from once multicast. The caching and delivery at UEs can be controlled by BSs to make UEs friendly and mutually beneficial.
1 nβ
n=1 N ∑
N ∑
distribution and the file caching distribution are Zipf when the required file distribution follows Zipf.
The intention of D2D delivery is to improve resource efficiency for the cellular content delivery by using proactive cache and proximal transmission. However, this efficiency gain depends on many factors, such as UE density, file caching and delivery distributions at UEs, channel quality and so on. In this section, we will compare D2D and BS content delivery in term of energy efficiency to understand the benefits and practical limits of the D2D delivery. Moreover, we discuss the criteria of mode selection for energy efficiency delivery, which is critical to integrate D2D into cellular networks [40]–[42]. Here we use the expected energy consumption for a successful file acquisition at a receiver as the evaluation metric. For a receiver j which requires a file, the probability ξD (i) of receiving its required file, called meeting probability (MP), which can be written as ξD (i) =
N ∑
( ) exp −κd2ij fs (n) fc (n) fr (n) ,
Then the expectation of ξD (i), ξD , for a receiver under the D2D delivery mode can be calculated by averaging the location of i as follows: ∫ 2π ∫ d0 ξD = λt ξD (i) τ dτ 0 0 ( ) N ∫ d0 exp −κτ 2 ∑ 1 = 2πλt fs (n) fc (n) β τ dτ N ∑ 1 n 0 n=1 l=1
fc (n) = 1, the distribution of fc also follows
n=1
=
the Zipf distribution, i.e., fc (n) =
1 nβ N ∑ l=1
,
n = 1, 2 · · · N.
Similarly, from (35b) we can obtain the relationship of transmission probabilities among these different files, which can be expressed as follows: ( )β q fs (p) = (38) , p ̸= q. fs (q) p The distribution of fs also follows Zipf distribution as the distribution of required files, i.e., fs (n) =
1 nβ N ∑ l=1
,
n = 1, 2 · · · N.
(39)
1 lβ
Theorem 1. To maximize the delivery efficiency, i.e., maximize the number of BUEs in the TSZ, the optimal file delivery
lβ
)] N [ ( πλt 1 − exp −κd20 ∑ 1 fs (n) fc (n) β . N ∑ n 1 n=1 κ lβ
(41)
l=1
(37)
1 lβ
(40)
n=1
With the BS content delivery, the probability that UE j receives the required file from its serving BS only depends on the channel status and delivery distribution under the assumption that BS always stores the required files of UEs. Then MP with the BS delivery can be expressed as ξC (i) =
N ∑
Pr {γj ≥ γ0 } fs (n) fr (n) ,
(42)
n=1
where
( ) Pr {γj ≥ γth } = exp −κ′ d2ij ,
(43)
and dR is the coverage radius of the BS with κ′ = m πλb mΓ (m) Γ (1 − m) γth . The derivation of (43) is similar to that of (8) and the difference is that the BS density is λb . By averaging locations of all potential serving BSs of the UE
2169-3536 (c) 2018 IEEE. Translations and content mining are permitted for academic research only. Personal use is also permitted, but republication/redistribution requires IEEE permission. See http://www.ieee.org/publications_standards/publications/rights/index.html for more information.
This article has been accepted for publication in a future issue of this journal, but has not been fully edited. Content may change prior to final publication. Citation information: DOI 10.1109/ACCESS.2018.2832442, IEEE Access 8
TABLE II M ODE S ELECTION A LGORITHM FOR C ONTENT D ELIVERY
j, the expectation of ξC (i), ξC , can be written as N ∑ n=1
ξC =
fs (n) n1β ∫ N ∑ l=1
dR
( ) exp −κ′ τ 2 f (τ ) dτ,
(44)
0
1 lβ
where f (τ ) is the distribution of the distance between a receiver and its serving BS. In cellular networks, a UE usually selects its attached BS based on RSSI. Hence, the distribution of the distance between a UE and its serving BS f (τ ) can be expressed as ( ) f (τ ) = 2πλb τ exp −λb πτ 2 . (45)
1. 2. 3. 4. 5. 6. 7. 8. 9.
For a D2D UE i scheduled to transmit in a content delivery period BS calculates εe based on (47) If εe ≤ 1, UE i transmits cached file n with probability fs (n) BS schedules UEs within Ti to listen to the multicast file else BS transmits cached file n with probability fs (n) BS schedules attached UEs to listen to the multicast file end TABLE III S IMULATION PARAMETER S ETTINGS
Including (45) into (44), ξC can be written as N ∑
ξC =
fs (n) n1β ∫
n=1
N ∑ l=1
N ∑
=
n=1
N ∑ l=1
1 lβ
( ) ( ) exp −κ′ τ 2 2πλb τ exp −λb πτ 2 dτ
0
1 lβ
fs (n) n1β
dR
( )] πλb [ 1 − exp (−κ′ − πλb ) d2R . κ′ + πλb (46)
For a fair comparison between cellular and D2D delivery in term of energy efficiency, we compare the MPs under different modes with the same transmission energy and delivery coverage. Let the ratio between ξC and ξD be εe . With (41) and (46), we can obtain εe as follows: ξC ξD [N N ∑ fs (n) ∑
εe =
=
n=1
nβ
l=1
]−1 1 lβ
πλb κ′ +πλb
[ ( )] 1 − exp (−κ′ − πλb ) d2R
[ N ∑ πλt [1 − exp (−κd20 )] κ l=1
]−1 1 lβ
{ [ ]} κλb 1 − exp (−κ′ − πλb ) d2R = λt (κ′ + πλb ) [1 − exp (−κd20 )]
N ∑ n=1
N ∑ n=1 N ∑ n=1
fs (n) fc (n) n1β fs (n) n1β .
fs (n) fc (n) n1β (47)
From (47), we can find that εe is affected by multiple factors such as the density of BS, D2D transmitters, the targeted coverage range of delivery, the distributions of delivery and caching. The transmission mode of a UE is determined by its serving BS based on εe . That is, BS selects the cellular mode when εe > 1. Otherwise, BS selects the D2D mode. The detailed mode selection algorithm is listed in Table II. Here we can see that the mode selection is based on the spatial average performance of communication links which is independent of the location of a transmitter. Then all transmitters will perform the same mode selection decision to achieve a better average performance without much signalling overhead cost. Thus the distribution of transmitters still follows homogenous PPP after mode selection.
Simulation parameter
Value
Transmitter UE density λt BS density λb Receiver UE density λr SINR threshold γth Targeted receiving power η0 Maximum transmission power Emax Path loss compensatory factor k Path loss factor α Zipf exponent β Files number N Simulation times T
10−7 , 10−6 , 10−5 10−7 , 10−6 , 10−5 10−2 10 dB −80 dBm 31 dBm 1 3 2 100 1000
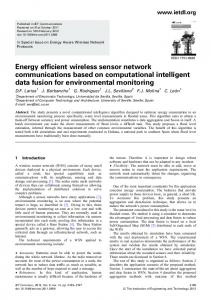
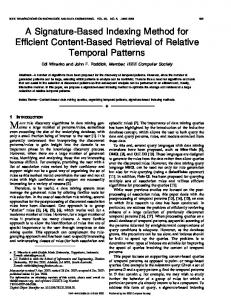
V. P ERFORMANCE E VALUATION To evaluate proposed schemes, we present some numerical and simulation results in this section. The default parameters are listed in Table III. In the simulation, each UE has a single role, i.e., transmitter or receiver during a simulation round. The network performance can be well reflected due to the randomness of their locations. More detailed simulation and relating parameters setup for D2D communication can be referred to [35]. Due to different system model and problem formulation, we will not compare with existing works such as [43] in the simulation. Instead, we widely simulate various transmission environment parameters to check their impacts on D2D multicast delivery. In addition, we indicate that the proposed D2D multicast strategy achieve the best energy efficiency coefficient by simulation. Firstly, we compare successfully receiving probability (ωj ) at a receiver against the distance between receiver and transmitter (dij ) under different settings of transmitter densities (λt ) and path loss factors (α) in Fig.1. We can find that ωj decreases with dij under different λt and α. Thus, a larger TSZ (leading to larger link distances for more transmissions) may not increase Nr . Moreover, comparing lines with circles and squares, respectively, we can observe that the higher transmitter density leads to a smaller successfully receiving probability. Larger α leads to larger ωj at the higher transmitter density, say λt = 10−5 , since interference from simultaneous transmitters decreases with α. As shown in Fig.2 for Nr against d0 , Nr increases with the
2169-3536 (c) 2018 IEEE. Translations and content mining are permitted for academic research only. Personal use is also permitted, but republication/redistribution requires IEEE permission. See http://www.ieee.org/publications_standards/publications/rights/index.html for more information.
This article has been accepted for publication in a future issue of this journal, but has not been fully edited. Content may change prior to final publication. Citation information: DOI 10.1109/ACCESS.2018.2832442, IEEE Access 9 0
140
−1
10
120
Number of successful receivers
Successful transmission probability ωj
10
analysis: λ =10−5,α=3 t
simulation: λt=10−6,α=3 analysis: λ =10−6,α=3 t
−6
simulation: λt=10 ,α=3 analysis: λt=10−5,α=4
10
40
60
80
100
Successfully receiving probability ωj against the D2D link distance
80
Nu.b. , α=4 r
Nr, α=4
20 50
Distance between transmitter and receiver dij
Fig. 1. dij
Nu.b. , α=3 r
40
simulation: λt=10 ,α=4
20
100
60
−5
−2
Nr, α=3
100 150 Distance of TSZ d0
200
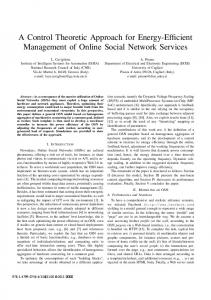
Fig. 3. The number of UEs successfully receiving their required files Nr and corresponding upper bound Nru.b. against radiuses of TSZ d0 30
α=3, η0=−80dBm
50 −5
Transmission power E
simulation: λt=10−5, λr=10−2 analysis: λ =10−5, λ =10−3
30
t
r
simulation: λt=10−5, λr=10−3
20
analysis: λ =10−6, λ =10−3 t
r
−6
−3
simulation: λt=10 , λr=10
10
α=3, η0=−70dBm
i
analysis: λt=10 , λr=10
40
α=4, η0=−80dBm
20
−2
10
0
−10
0 −20
−15
−10 −5 Transmission power Ei
0
Fig. 2. The number of UEs successfully receiving their required files Nr against transmission power Ei
radius of TSZ (d0 ). However, this increase is trivial for the higher transmitter density (say λt = 10−5 ) due to interference. In particular, for the lower receiver density, Nr increases more slowly. Thus, the transmission power needs to be adjusted based on nodes density to avoid energy waste. Fig.3 compares Nr and Nru.b against d0 for λt = 10−5 . As shown in this figure, Nr increases with d0 . However, Nr tends to be a constant when d0 is larger than a threshold, i.e., Nr has an upper bound as analyzed. In addition, Nr tends to reach the upper bound more quickly with smaller α (say α = 3) due to severer interference from simultaneous transmitters, which match the theoretical analyses, i.e., it is not energy-efficient to increase Nr by enlarging the TSZ of a transmitter. As shown in Fig.4, the energy consumption (Ei ) increases with d0 under different α and η0 . In addition, higher η0 and α lead to higher energy consumptions for the same d0 , because they need higher transmitter powers to achieve the targeted receiving power and compensate path loss, respectively. Thus, d0 needs to be reduced to save energy. Fig.3 also shows that Nr increases with d0 with an upper bound, i.e., Nr does not increase any more when d0 is larger than a threshold. Thus, an optimal d0 exists especially for a worse transmission environment as analyzed. The comparisons of transmission efficiency coefficient (ρ)
−20 100
200
300 Distance of TSZ d0
400
500
Fig. 4. The transmission power Ei against radius of TSZ d0 under different path loss factor α and targeted receiving signal power η0 −9
1.2 Transmission efficiency coefficient ρ
Number of successful receivers Nr
60
1 0.8 0.6
x 10
ρ, α=3, γth=10dB optimal ρ, α=3, γth=10dB ρ, α=4, γth=10dB optimal ρ, α=4, γth=10dB ρ, α=4, γth=0dB optimal ρ, α=4, γth=0dB
0.4 0.2 0
50
100
150
200
250
300
350
400
Distance of TSZ d0
Fig. 5. The transmission efficiency coefficient ρ with different radius of TSZ d0 , path loss factor α and decoding threshold γth
with different settings of d0 , α and γth are shown in Fig.5. It is shown that ρ firstly decreases with the increase of d0 for small d0 with ranging from 0 to 50, and then increases with d0 after achieving its minimal value. Hence there is an optimal d0 for the TSZ given transmission environment parameters such
2169-3536 (c) 2018 IEEE. Translations and content mining are permitted for academic research only. Personal use is also permitted, but republication/redistribution requires IEEE permission. See http://www.ieee.org/publications_standards/publications/rights/index.html for more information.
This article has been accepted for publication in a future issue of this journal, but has not been fully edited. Content may change prior to final publication. Citation information: DOI 10.1109/ACCESS.2018.2832442, IEEE Access 10 1
10
x 10
ρ, λ =10−5
Caching and dissemination coefficient ζ
Transmission efficiency coefficient ρ
−10
6
t
optimal ρ, λ =10−5
5
t
−6
ρ, λ =10 t
−6
optimal ρ, λt=10
4
−7
ρ, λ =10 t
3
optimal ρ, λt=10−7
2 1
optimal caching and dissemination Zipf caching and random dissemination random caching and dissemination
−1
10
−2
10
−3
10
−4
10
0
100
200
300 400 500 600 Distance of TSZ d0
700
Fig. 8.
ρ, k=0.2 optimal ρ, k=0.2 ρ, k=0.4 optimal ρ, k=0.4 ρ, k=0.6 optimal ρ, k=0.6
10
−11
10
100
200 300 Radius of TSZ d0
400
500
Fig. 7. The transmission efficiency coefficient ρ with different TSZ radius d0 and path loss compensation factor k
as transmitter density, receiver density and channel quality. In addition, the optimal ρ can achieve the minimal value under different transmission environments, which verifies the effectiveness of the proposed energy-efficiency oriented D2D delivery scheme. Moreover, we can find that ρ increases with path loss and decoding threshold while the best energy efficiency can always be achieved by the proposed delivery power scheme. Similarly as shown in Fig.6, ρ of the proposed scheme (marked by star points) can obtain the optimal energy efficiency coefficient at different transmitter densities with the smallest transmission power consumption for the same number of successful decoding receivers. In addition, a higher transmitter density yields a higher ρ, i.e., a lower energy efficiency of the D2D delivery due to severer interference. Fig.7 compares ρ with different d0 and path loss compensation factor k. We can see that ρ increases with the increase of k since larger path loss leads to a smaller number of successful receiving UEs and the lower energy efficiency. The above discussions show that, under different transmission environments (path loss, transmitter density, and decoding threshold), the proposed delivery scheme can achieve the best energy efficiency.
80
100
0.35 0.3 0.25
α=3, γth=10dB α=4, γth=10dB α=3, γth=0dB
0.2 0.15 0.1 0.05 0 −6 10
−12
10
40 60 Number of files N
Caching and delivery coefficient ζ with different files number N
Expectation of MP ξD under D2D mode
−9
10
−10
20
800
Fig. 6. The transmission efficiency coefficient ρ with different TSZ radius d0 and transmitter density λt
Transmission efficiency coefficient ρ
0
10
−5
10
−4
10
The density of D2D transmitter λt
Fig. 9. The expectation of MP ξD under D2D mode against D2D transmitter density λt
For fair comparison among different caching and delivery strategies, the number of BUEs (Nr ) should be compared for different schemes. To focus on caching and delivery strategies, communication parameters such as transmission power and channel quality are set the same for different schemes. From (15) we can see that Nr only depends on ζ when communication parameters are given. Therefore, we can resort to comparing ζ to determine which scheme is more energy efficiency. Fig.8 compares ζ with different files number (N ) for three different content caching and delivery schemes: random caching and delivery, Zipf caching and random delivery, and the proposed optimal caching and delivery. We can find that the proposed scheme achieves the highest ζ (approaching to 1) as analyzed under any tested N , which will bring a largest number of BUEs from the delivery of a transmitter. Zipf caching is better than random caching with the random D2D delivery policy, and random caching and delivery performs worst especially with larger N : its performance degrades significantly with N . On the other hand, the proposed optimal scheme almost performs the same when N changes, which shows the robustness of the proposed scheme. Fig.9 shows the variation of expectation of MP (ξD ) under the D2D mode against λt . ξD increases with the increase of λt since more transmitters have larger probability to cover a
2169-3536 (c) 2018 IEEE. Translations and content mining are permitted for academic research only. Personal use is also permitted, but republication/redistribution requires IEEE permission. See http://www.ieee.org/publications_standards/publications/rights/index.html for more information.
This article has been accepted for publication in a future issue of this journal, but has not been fully edited. Content may change prior to final publication. Citation information: DOI 10.1109/ACCESS.2018.2832442, IEEE Access 11
Expectation of MP ξC under cellular mode
0.2 α=3, γth=10dB α=4, γ =10dB
0.15
th
α=3, γth=0dB 0.1
0.05
0 −7 10
−6
−5
−4
10 10 The density of BS λb
10
Fig. 10. The expectation of MP ξC under cellular mode against BS density λb
4 D2D efficient coefficient εe
3.5 3 2.5 2
VI. C ONCLUSION analysis: case I simulation: case I analysis: case II simulation: case II analysis: case III simulation: case III analysis: case IV simulation: case IV
1.5 1 0.5 0
files, we can observe that the D2D content delivery performs worse than the BS content delivery (εe > 1). However, for the optimal delivery strategy in which D2D transmitter caches and transmits files optimally, the performance of D2D content delivery is improved. When the D2D transmitter density is much larger than BS density (say λt = 5λb ), the D2D delivery may outperform the BS delivery (εe < 1), since D2D transmitters bring content sharing closer to receivers due to the dense UE deployment. Thus, it is better to select the D2D delivery when available UEs for content multicast delivery are of higher density. For smaller β, the D2D delivery is worse than BS delivery due to limited caching capacity with not enough required files. Thus, D2D content delivery may perform better under some conditions. We can resort to εe to determine when to use the D2D delivery.
100
200
300
400
500
The dissemination coverage radius d0
Fig. 11. D2D energy efficiency coefficient εe under different cases. Case I: optimal delivery, β = 2 and λt /λb = 2, Case II: optimal delivery, β = 0.5 and λt /λb = 2, Case III: random delivery, β = 0.5 and λt /λb = 2, and Case IV: optimal delivery, β = 0.5 and λt /λb = 5
receiver and send the required file. In addition, the increase of ξD with λt tends to zero after λt goes beyond a threshold due to the severer interference introduced by more transmitters. ξD decreases with the α and γth due to worse file receiving condition. Fig.10 shows the expectation of MP (ξC ) under the cellular mode against λb . The targeted coverage distance of the BS, dR , is set equal to d0 for better comparison. Similar to Fig.9, ξC also increases with λb with an upper bound due to interference from simultaneous transmitters. In addition, ξC decreases with the increase of α and γth due to worse file receiving condition. Through comparing Figs. 9 and 10, we can find that under the same transmission environment, the BS delivery performs better than the D2D delivery, because BS stores all files instead of caching files opportunistically as the D2D UE does. Therefore, the D2D file delivery can be a complement choice under certain conditions. In Fig.11, εe against d0 are compared for different settings of λb , β and delivery strategies. The targeted delivery radiuses are set equal for the D2D transmitter and BS for fair comparison in term of energy efficiency. For the random delivery strategy, in which a D2D transmitter randomly caches
In this paper, we focus on D2D content delivery strategies in order to make the content delivery in next-generation cellular networks more energy efficient, which have been proved by both theoretical and experimental results. The major outcomes are summarized as follows: i) an optimal transmission power scheme, based on which the UE cooperation range for proximal content delivery can be determined, ii) an energy efficient content delivery policy, which allows a node to organize the delivery and caching of files to minimize the energy consumption for a successful file delivery, and iii) a quantitative metric to evaluate the energy efficiency of using D2D content delivery, which provides an important insight into determining whether D2D would be a feasible option to be used for content delivery. ACKNOWLEDGEMENT This work was partially supported by the National Natural Science Foundation of China (No.61601283, No.61472237 and No.61271283) and Chile CONICYT FONDECYT Project (No.1181809). R EFERENCES [1] “Cisco visual networking index: Global mobile data traffic forecast update, 2015–2020 white paper,” Cisco, white paper, 2016. [Online]. Available: http://www.cisco.com/c/en/us/solutions/collateral/service-provider/ visual-networking-index-vni/mobile-white-paper-c11-520862.html [2] E. Bastug, M. Bennis, M. Kountouris, and M. Debbah, “Cache-enabled small cell networks: modeling and tradeoffs,” Eurasip Journal on Wireless Communications & Networking, vol. 2015, no. 1, pp. 1–11, 2015. [3] J. Hoydis, M. Kobayashi, and M. Debbah, “Green small-cell networks,” IEEE Vehicular Technology Magazine, vol. 6, no. 1, pp. 37–43, 2011. [4] E. Bastug, J.-L. Guenego, and M. Debbah, “Proactive small cell networks,” in Proc. 2013 20th International Conference on Telecommunications (ICT), 2013, pp. 1–5. [5] K. Shanmugam, N. Golrezaei, A. Dimakis, A. Molisch, and G. Caire, “Femtocaching: Wireless content delivery through distributed caching helpers,” IEEE Transactions on Information Theory, vol. 59, no. 12, pp. 8402–8413, 2013. [6] N. Golrezaei, A. Dimakis, and A. Molisch, “Scaling behavior for deviceto-device communications with distributed caching,” IEEE Transactions on Information Theory, vol. 60, no. 7, pp. 4286–4298, 2014. [7] G. Fodor, E. Dahlman, G. Mildh, and S. Parkvall, “Design aspects of network assisted device-to-device communications,” IEEE Communications Magazine, vol. 50, no. 3, pp. 170–177, 2012.
2169-3536 (c) 2018 IEEE. Translations and content mining are permitted for academic research only. Personal use is also permitted, but republication/redistribution requires IEEE permission. See http://www.ieee.org/publications_standards/publications/rights/index.html for more information.
This article has been accepted for publication in a future issue of this journal, but has not been fully edited. Content may change prior to final publication. Citation information: DOI 10.1109/ACCESS.2018.2832442, IEEE Access 12
[8] A. Asadi, Q. Wang, and V. Mancuso, “A survey on device-to-device communication in cellular networks,” IEEE Communications Surveys and Tutorials, vol. 16, no. 4, pp. 1801–1819, 2014. [9] A. Altieri, P. Piantanida, L. Vega, and C. Galarza, “A stochastic geometry approach to distributed caching in large wireless networks,” in Proc. 2014 11th International Symposium on Wireless Communications Systems (ISWCS), 2014, pp. 863–867. [10] N. Golrezaei, P. Mansourifard, A. Molisch, and A. Dimakis, “Basestation assisted device-to-device communications for high-throughput wireless video networks,” IEEE Transactions on Wireless Communications, vol. 13, no. 7, pp. 3665–3676, 2014. [11] J. Paakkonen, C. Hollanti, and O. Tirkkonen, “Device-to-device data storage for mobile cellular systems,” in Proc. 2013 IEEE Globecom Workshops, 2013, pp. 671–676. [12] M. Haenggi, J. G. Andrews, F. Baccelli, O. Dousse, and M. Franceschetti, “Stochastic geometry and random graphs for the analysis and design of wireless networks,” IEEE Journal on Selected Areas in Communications, vol. 27, no. 7, pp. 1029–1046, 2009. [13] N. Giatsoglou, K. Ntontin, E. Kartsakli, A. Antonopoulos, and C. Verikoukis, “D2d-aware device caching in mmwave-cellular networks,” IEEE Journal on Selected Areas in Communications, vol. 35, no. 9, pp. 2025– 2037, Sep. 2017. [14] D. Malak and M. Al-Shalash, “Optimal caching for device-to-device content distribution in 5g networks,” in Proc. 2014 Globecom Workshops, 2014, pp. 863–868. [15] H. Kang, K. Park, K. Cho, and C. Kang, “Mobile caching policies for device-to-device (d2d) content delivery networking,” in Proc. 2014 IEEE Conference on Computer Communications Workshops, 2014, pp. 299– 304. [16] Z. Zheng, T. Wang, L. Song, Z. Han, and J. Wu, “Social-aware multifile dissemination in device-to-device overlay networks,” in Proc. 2014 IEEE Conference on Computer Communications Workshops, 2014, pp. 219–220. [17] A. Pyattaev, O. Galinina, S. Andreev, M. Katz, and Y. Koucheryavy, “Understanding practical limitations of network coding for assisted proximate communication,” IEEE Journal in Selected Areas of Communications, vol. 33, no. 2, pp. 156–170, 2015. [18] E. Bastug, M. Bennis, and M. Debbah, “Living on the edge: The role of proactive caching in 5g wireless networks,” IEEE Transactions on Mobile Computing, vol. 52, no. 8, pp. 82–89, 2014. [19] Y. Cao and A. Maaref, “Device cooperation-assisted scalable video multicast with heterogeneous qoe guarantees,” in proc. 2014 11th International Symposium on Wireless Communications Systems (ISWCS), Aug. 2014, pp. 733–738. [20] Y. Zhang, F. Li, X. Ma, K. Wang, and X. Liu, “Cooperative energyefficient content dissemination using coalition formation game over device-to-device communications,” Canadian Journal of Electrical and Computer Engineering, vol. 39, no. 1, pp. 2–10, 2016. [21] Y. Xu and F. Liu, “Qos provisionings for device-to-device content delivery in cellular networks,” IEEE Transactions on Multimedia, to be published. [22] X. Lin, R. Ratasuk, A. Ghosh, and J. G. Andrews, “Modeling, analysis, and optimization of multicast device-to-device transmissions,” IEEE Transactions on Wireless Communications, vol. 13, no. 8, pp. 4346– 4359, Aug. 2014. [23] M. Afshang, H. S. Dhillon, and P. H. J. Chong, “Fundamentals of clustercentric content placement in cache-enabled device-to-device networks,” IEEE Transactions on Communications, vol. 64, no. 6, pp. 2511–2526, Jun. 2016. [24] Y. Xu, X. Li, and J. Zhang, “Device-to-device content delivery in cellular networks: Multicast or unicast,” IEEE Transactions on Vehicular Technology, vol. PP, no. 99, p. 1, 2017. [25] S. Shalmashi, E. Bj¨ornson, M. Kountouris, K. W. Sung, and M. Debbah, “Energy efficiency and sum rate when massive MIMO meets deviceto-device communication,” in 2015 IEEE International Conference on Communication Workshop (ICCW), Jun. 2015, pp. 627–632. [26] A. Antonopoulos and C. Verikoukis, “Multi-player game theoretic mac strategies for energy efficient data dissemination,” IEEE Transactions on Wireless Communications, vol. 13, no. 2, pp. 592–603, 2014. [27] A. Antonopoulos, E. Kartsakli, and C. Verikoukis, “Game theoretic d2d content dissemination in 4g cellular networks,” IEEE Communications Magazine, vol. 52, no. 6, pp. 125–132, 2014. [28] E. Datsika, A. Antonopoulos, N. Zorba, and C. Verikoukis, “Green cooperative device-to-device communication: a social-aware perspective,” IEEE Access, vol. 4, pp. 3697–3707, 2017. [29] C. Xu, L. Song, Z. Han, Q. Zhao, X. Wang, and B. Jiao, “Interferenceaware resource allocation for device-to-device communications as an
[30]
[31] [32]
[33]
[34] [35] [36]
[37] [38]
[39] [40]
[41]
[42] [43]
underlay using sequential second price auction,” in 2012 IEEE International Conference on Communications (ICC), Jun. 2012, pp. 445–449. D. Tsolkas, E. Liotou, N. Passas, and L. Merakos, “A graph-coloring secondary resource allocation for d2d communications in LTE networks,” in 2012 IEEE 17th International Workshop on Computer Aided Modeling and Design of Communication Links and Networks (CAMAD), Sep. 2012, pp. 56–60. Y. Xu, Y. Liu, and D. Li, “Resource management for interference mitigation in device-to-device communication,” IET Communications, vol. 9, no. 9, pp. 1199–1207, 2015. Z. Zhou, M. Dong, K. Ota, J. Wu, and T. Sato, “Energy efficiency and spectral efficiency tradeoff in device-to-device (d2d) communications,” IEEE Wireless Communications Letters, vol. 3, no. 5, pp. 485–488, Oct. 2014. M. Afshang, H. S. Dhillon, and P. H. J. Chong, “k-closest coverage probability and area spectral efficiency in clustered d2d networks,” in 2016 IEEE International Conference on Communications (ICC), May 2016, pp. 1–6. A. A. A. Haija and M. Vu, “Spectral efficiency and outage performance for hybrid d2d-infrastructure uplink cooperation,” IEEE Transactions on Wireless Communications, vol. 14, no. 3, pp. 1183–1198, Mar. 2015. “3gpp technical report 36.843,” 3GPP WG RAN1, Tech. Rep., 2014. [Online]. Available: http://www.3gpp.\\org/ftp/Specs/html-info/36843. htm N. Golrezaei, A. Dimakis, and A. Molisch, “Wireless device-to-device communications with distributed caching,” in Proc. 2012 IEEE International Symposium on Information Theory Proceedings (ISIT), 2012, pp. 2781–2785. E. Bastug, M. Bennis, and M. Debbah, “Social and spatial proactive caching for mobile data offloading,” in Proc. 2014 IEEE International Conference on Communications Workshops, 2014, pp. 581–586. K. Poularakis and L. Tassiulas, “Optimal selfishness-aware deviceassisted content delivery in cellular networks,” in Proc. 2014 IEEE Wireless Communications and Networking Conference (WCNC), 2014, pp. 2288–2293. Y. Xu, “On the performance of device-to-device communications with delay constraint,” IEEE Transactions on Vehicular Technology, vol. 65, no. 11, pp. 9330–9344, Nov. 2016. H. Elsawy, E. Hossain, and M. S. Alouini, “Analytical modeling of mode selection and power control for underlay d2d communication in cellular networks,” IEEE Transactions on Communications, vol. 62, no. 11, pp. 4147 – 4161, 2014. A. H. Sakr and E. Hossain, “Cognitive and energy harvesting-based d2d communication in cellular networks: Stochastic geometry modeling and analysis,” IEEE Transactions on Communications, vol. 63, no. 5, pp. 1867–1880, May 2015. X. Lin, J. G. Andrews, and A. Ghosh, “Spectrum sharing for deviceto-device communication in cellular networks,” IEEE Transactions on Wireless Communications, vol. 13, no. 12, pp. 6727–6740, Dec. 2014. Y. Li, Z. Wang, D. Jin, and S. Chen, “Optimal mobile content downloading in device-to-device communication underlaying cellular networks,” IEEE Transactions on Wireless Communications, vol. 13, no. 7, pp. 3596–3608, Jul. 2014.
2169-3536 (c) 2018 IEEE. Translations and content mining are permitted for academic research only. Personal use is also permitted, but republication/redistribution requires IEEE permission. See http://www.ieee.org/publications_standards/publications/rights/index.html for more information.