spent in testing and debugging activities. Typical ... Performance testing and debugging ... We are building automatic debugging tools based on precise program ...
Towards Fully Automatic Execution Monitoring Clinton Jeffery, Mikhail Auguston, Scott Underwood Department of Computer Science, New Mexico State University {jeffery, mikau, sunderwo}@cs.nmsu.edu
Abstract. UFO is a new application framework in which programs written in FORMAN, a declarative assertion language, are compiled into execution monitors that run on a virtual machine with extensive monitoring capabilities provided by the Alamo monitor architecture. FORMAN provides an event trace model in which precedence and inclusion relations define a DAG structure that abstracts execution behavior. Compiling FORMAN assertions into hybrid run-time/post-mortem monitors allows substantial speed and size improvements over post-mortem analyzers. The UFO compiler generates code that computes the minimal projection of the DAG necessary for a given set of assertions. UFO enables fully automatic execution monitoring of real programs. The approach is non-intrusive with respect to program source code and provides a high level of abstraction for monitoring and debugging activities. The ability to compile suites of debugging rules into efficient monitors, and apply them generically to different programs, enables long-overdue breakthroughs in program debugging.
1. Motivation Debugging is one of the most challenging and least developed areas of software engineering. A special issue of Communications of the ACM characterized the current state of debugging tools as a "Debugging scandal" [1]. According to the classic "Brook’s rule" [2] more than 50% of all time and effort in a software project is spent in testing and debugging activities. Typical activities include detection and removal of errors, profiling, and performance tuning. Debugging activities include queries regarding many aspects of target program behavior: sequences of steps performed, histories of variable values, function call hierarchies, checking of pre- and post-conditions at specific points, and validating other assertions about program execution. Performance testing and debugging involves a variety of profiles and time measurements. Visualization is another common debugging activity that may help locate logic or performance problems. There is an urgent need for tools that automate the primary, labor-intensive tasks of debugging, but progress has been slow. Debugging automation has its own system of ideas and domain-specific programming activities. Support for these concepts and activities is essential in order to move debugging automation forward. We are building automatic debugging tools based on precise program execution behavior models that enable us to employ a systematic approach. Our program behavior models are based on events and event traces [3][4][5]. Debugging automation refers to a computation over an event trace. Program execution monitors are programs that load and execute a target program, obtain events at run-time, and perform computations over the event trace. Computations are performed during execution, post-mortem, or in any mixture of both times.
Any detectable action performed during a target program's run time is an event. For instance, expression evaluations, statement executions, and procedure calls are all examples of events. An event has a beginning, an end, and some duration; it occupies a time interval during program execution. This leads to the introduction of two basic binary relations on events: partial ordering and inclusion. Those relations are determined by target language syntax and semantics, e.g. two statement execution events may be ordered, or an expression evaluation event may occur inside a statement execution event. The set of events produced at run time, together with ordering and inclusion relations, is called an event trace and represents a model of program behavior. An event trace forms an acyclic directed graph (DAG) with two types of edges corresponding to the basic relations. Our previous work included the FORMAN assertion language [3] and the Alamo program execution monitoring architecture [6]. FORMAN takes a top-down approach, introducing a domain-specific syntax for expressing bug manifestations and other behavior of interest, while Alamo takes a more bottom-up, implementationdriven approach, providing runtime system support for the development of monitors in which efficiency and scalability to real programs are primary concerns. Alamo’s efficient source-level access and control over monitored programs has been integrated into a production virtual machine; in the absence of such support, monitoring would require extensive low-level instrumentation and control mechanisms. The language UFO (Unicon-FORMAN) integrates the experience accumulated in these previous projects to provide a complete solution for development of an extensive suite of automatic debugging tools. UFO is an implementation of FORMAN for debugging programs written in the Unicon and Icon programming languages [7][8]. Previous FORMAN implementations worked on subsets of Pascal, and C languages and used post-mortem event trace processing methods that limited their applicability. In contrast, UFO uses the Alamo monitoring architecture that pervades the Unicon virtual machine to support debugging real programs at run time.
2. Unicon and Alamo The Unicon language and the Alamo monitoring architecture provide the underlying research framework for the implementation of UFO. Unicon is an imperative, goaldirected, object-oriented superset of the Icon programming language. Unicon's syntax is similar to Pascal or Java, while its semantics are higher level, featuring built-in backtracking and heterogeneous data structures and string scanning facilities. Icon has influenced many scripting languages such as Python. Unicon is Icon’s direct descendant, derived from Icon's implementation. It runs regular Icon programs and extends Icon's reach with object-orientation and packages, as well as a much richer system interface with high level graphics, networking, and database facilities. The reference implementation of Unicon is a virtual machine. Virtual machines (VM) are attractive to language implementers, enhancing portability and allowing simpler implementation of very high level language features such as backtracking. VMs are also ideal for developing debugging tools. VMs provide an appropriate level of abstraction for developing behavior models to describe program executions in a processor independent manner, as illustrated by the JPAX tool [9]. VMs also provide easy access to program state and control flow, the information most needed
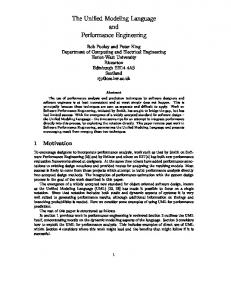
for debugging activities. Automatic instrumentation on multiple semantic levels is greatly simplified via the use of a VM. This potential was exploited in the Unicon VM by a framework that implements the Alamo monitoring architecture. Event instrumentation and processing support are an integral part of the VM. The Alamo Unicon framework is summarized in Figure 1. Execution monitors (EM) and the target program (TP) execute as (sets of) coroutines with separate stacks and heaps inside a common VM. The VM is instrumented with approximately 150 kinds of atomic events, each one reporting a pair. EMs specify categories of events by supplying an event mask when they activate the TP by coroutine switch. The TP executes up to an event of interest. Unicon Virtual Machine
state access functions
TP
m a s k
EM
VM instrumentation Fig. 1. Alamo architecture within the Unicon VM.
The event mask is used by the VM for instrumentation selection and control. Event reports during TP execution are coroutine context switches from the VM runtime system back to the execution monitor. In addition to the reported for the event, the EM can directly access arbitrary variable values and state information from the TP via state access functions. Monitors are written independently from the target program, and can be applied to any target program without recompiling the monitor or target program. Monitors dynamically load target programs, and can easily query the state of arbitrary variables at each event report. Multiple monitors can monitor a program execution, under the direction of a monitor coordinator. Alamo's goal was to reduce the difficulty of writing execution monitors to be just as easy as writing other types of application programs. UFO moves beyond Alamo to efficiently support FORMAN's more ambitious goal of reducing the difficulty of writing automatic debuggers to the task of specifying generic assertions about program behavior. UFO’s FORMAN language is described in Section 4 below, but first it is necessary to present the underlying behavior model.
3. An Event Grammar for Unicon Event grammars provide a model of program run time behavior. Monitors do not have to parse events using this grammar, since event detection is part of VM and UFO runtime system functionality. Monitors implement computations over event traces supplied by the VM. An event is an abstraction of a detectable action performed at run time and has an event type and various attributes associated with it. The following description in fact provides a "lightweight" semantics of the Unicon programming language tailored for specification of debugging activities. An event corresponds to
some specific action of interest performed during program execution. Event type is an important part of the behavior model. Universal attributes are found in every event. They frequently are used to narrow assertions down to a particular domain (function, variable, value) of interest. Some of these attributes are much easier to obtain than others, and affect the optimizations that can be performed when generating monitor code; see Section 5 for details. source_text: in a canonical form line_num, col_num: source text locations time_at_end, time_at_begin, duration: timing attributes eval_at_begin (Unicon-expr), eval_at_end (Unicon-expr): runtime access to the program states prev_path, following_path: set of events before/after this event Event types and their type-specific attributes are summarized in the table below. Event Type prog_ex expr_eval func_call input, output variable literal lhp rhp clause test iteration
Description whole program execution expression evaluation function call I/O variable reference reference to a constant value lefthand part, assignment righthand part, assignment then-, else-, or case branch execution test evaluation loop iteration
Type Specific Attributes value, operator, type, failure_p func_name, paramlist file address
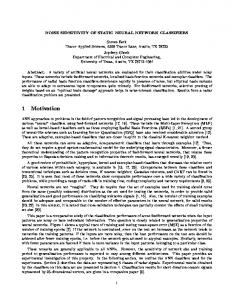
Event types form a hierarchy, shown in Figure 2. Subtypes inherit attributes from the parent type. Expression evaluation is the central action during Unicon program execution, this explains why the expr_eval event is on the top of the hierarchy. expr_eval clause
iteration
test
lhp
func_call
input
rhp
variable
param
literal
output
Fig 2. Event Type Inheritance Hierarchy
The UFO event grammar for Unicon is a set of axioms describing the structure of event traces with respect to the two basic relations: inclusion and precedence. The grammar is one possible abstraction of Unicon semantics; other event grammars with far more (or less) detail might be used. The event grammar limits what kinds of bugs can be detected, so some detail is useful. The grammar uses the following notation:
Notation A :: (B C) A* A+ A|B A? {A,B} x:A
Meaning B precedes A, A includes B and C Zero or more A’s under precedence One or more A’s under precedence Either A or B; alternative A is optional Set; A and B have no precedence Let x denote event A
prog_ex:: ( expr_eval *) expr_eval:: ( ( expr_eval ) | ( expr_eval expr_eval ) | ( expr_eval+ ) | ( test clause ) | ( iteration * ) | ( { lhp, rhp} )
unary op binary op conditional / case expressions loops assignment lhp and rhp are not ordered, beginning of lhp precedes rhp, and end of lhp follows rhp
) iteration:: ( test expr_eval*) | ( expr_eval* test ) | ( expr_eval * ) Execution of a Unicon program produces a set of events (an event trace) organized by precedence and inclusion into a DAG. The structure of the event trace (event types, precedence and inclusion of events) is constrained by the event grammar axioms above. The event trace models Unicon program behavior and provides a basis to define different kinds of debugging activities (assertion checking, debugging queries, profiles, debugging rules, behavior visualization) as appropriate computations over the event traces.
4. FORMAN Alamo allows efficient monitors to be constructed in Unicon, but using a specialpurpose language such as FORMAN, with the rich behavior model described in the preceding section, has compelling advantages. On a basic level, for example, it is convenient to refer to target program variables directly instead of through a library call. For example, in FORMAN we may refer to target program variable x, while in the Unicon monitor it is referenced as variable("x", &eventsource). UFO rules are up to an order of magnitude smaller (in terms of lines of source code) than the equivalent imperative monitors written in Unicon, depending on the type of quantifiers and aggregate operations used in the FORMAN rule. More important than such conveniences are FORMAN's control structures that directly support dynamic analysis. FORMAN supports computations over event traces centered around event patterns and aggregate operations over events. The simplest event pattern consists of a single event type and matches successfully an event of this type or an event of a subtype of this type. Event patterns may include event attributes
and other event patterns to specify the context of an event under consideration. For example, the event pattern E: expr_eval
& E.operator == ":="
matches an event of assignment. Temporary variable E provides an access to the events under consideration within the pattern. The following example demonstrates the use of an aggregate operation. CARD[A: func_call & A.func_name == "read" FROM prog_ex] yields a number of events satisfying the given event pattern, collected from the whole execution history. Expression […] is a list constructor and CARD is an abbreviation for a reduction of '+' operation over the more general list constructor: +/[A:func_call & A.func_name=="read" FROM prog_ex APPLY 1] Quantifiers are introduced as abbreviations for reductions of Boolean operations OR and AND. For instance, FOREACH Pattern FROM event_set Boolean_expr is an abbreviation for AND/[Pattern FROM event_set APPLY Boolean_expr ] Debugging rules in FORMAN usually have the form: Quantified_expression WHEN SUCCEEDS SAY-clauses WHEN FAILS SAY-clauses
The Quantified_expression is optional and defaults to TRUE. The execution of FORMAN programs relies on the Unicon monitors embedded in a VM environment. Section 5 below describes the architecture of the UFO compiler and runtime system, which translates FORMAN to Unicon VM monitor code. The following examples illustrate additional features of FORMAN as needed. Application-Specific Analyses This section presents formalizations of typical debugging rules. UFO supports and improves upon the most common application-specific debugging techniques. For example, UFO supports traditional precondition checking, or print statement insertion, without any modification of the target program source code. This is especially valuable when the precondition check or print statement is needed in not just one location, but instead in many locations scattered throughout the code. Example #1: Tracing. Probably the most common debugging method is to insert output statements to generate trace files, log files, and so forth. This allows for subsequent human analysis, and while it has its limitations, it will remain a common technique. It is possible to request evaluation of arbitrary Unicon expressions at the beginning or at the end of events. The VM evaluates these expressions at the indicated time moments, allowing dynamic instrumentation of the Unicon program, whether to print some values, or to call a visualization library subroutine.
FOREACH A: func_call & A.func_name == “my_func” FROM prog_ex A.value_at_begin(write(“entering my_func, value of X is:”,X)) AND A.value_at_end(write(“leaving my_func, value of X is:”, X))
This debugging rule causes calls to write() to be evaluated at selected points at run time, just before and after each occurrence of event A. Example #2: Profiling. A myriad of tools are based on a premise of accumulating the number of times a behavior occurs, or the amount of time spent in a particular activity or section of code. The following debugging rule illustrates such computations over the event trace. SAY("Total number of read() statements: " CARD[ r: input & r.filename == "xx.in" FROM prog_ex ] "Elapsed time for read operations is: " SUM [ r: input & r.filename == "xx.in" FROM prog_ex APPLY r.duration] )
Example #3: Pre- and Post- Conditions. Typical use of assertions includes checking pre- and post-conditions of function calls. FOREACH A:func_call & A.func_name==”sqrt” FROM prog_ex A.paramlist[1] >=0 AND abs(A.value*A.value-A.paramlist[1]) < epsilon WHEN FAILS SAY(“bad sqrt(“ A.paramlist[1] “) yields ” A.value)
Generic Bug Descriptions Another interesting prospect is the development of a suite of generic automated debugging tools that can be used on any Unicon program. UFO provides a level of abstraction sufficient for specifying typical bugs and debugging rules. Example #4: Detecting Use of Un-initialized Variables. Although reading an uninitialized variable is permissible in Unicon, this practice often leads to errors. Therefore, in this debugging rule all variables within the target program are checked to ensure that they are initialized before they are used. FOREACH V: variable FROM prog_ex FIND D: lhp FROM V.prev_path D.source_text == V.source_text WHEN FAILS SAY( " uninitialized variable " V.source_text)
Example #5: Empty Pops. Removing an element from an empty list is representative of many expressions that fail silently in Unicon. While this can be convenient, it can also be a source of difficult to detect logic errors. This assertion assures that items are not removed from empty lists. FOREACH a:func_call & a.func_name=="pop" & a.value_at_begin(*a.paramlist[1]==0)
SAY("Popping from empty list at event " a)
5.
Implementation Issues
The most important of implementation issues is the translation model by which FORMAN rules are compiled into Unicon monitors. Rules are written as if they have the complete post-mortem event trace available for processing. This generality is powerful; however the majority of assertions can be compiled into monitors that execute entirely at runtime. Runtime monitoring is the key to practical implementation. For assertions that require post-mortem analysis, the UFO runtime system computes a projection of the execution DAG needed to perform the analysis. The UFO translation model categorizes each rule as either "runtime", "postmortem", or "hybrid", denoting the amount of computations that can be performed at runtime. Runtime and hybrid categories are determined by constraints on FORMAN quantifier prefixes and result in more efficient code. Nested quantifiers and aggregate operations generally require post-mortem operation. Translation Examples Each FORMAN statement is translated into a combination of initialization, run-time, and post-mortem code. Monitors are executed as coroutines with the Unicon target program, as explained in Section 2. The following examples give a flavor of the run time architecture of monitors generated from the UFO high level rules. Implementation of Example #1. A lone FOREACH quantifier is typical of many UFO debugging actions and allows computation to be performed entirely at runtime. The events being counted and values being accumulated determine an event mask in the initialization code that defines the Alamo events that will be monitored. The monitor’s event processing loop implements a filter based on procedure name within an if-expression. The Unicon code blocks containing write() expressions are inserted directly into the event loop for the relevant events. The complete monitor is: $include "evdefs.icn" link evinit procedure main(av) EvInit(av) | stop("can't monitor ", av[1]) mask := E_Pcall ++ E_Pret ++ E_Pfail ++ E_Prem while EvGet(mask) do { if &eventcode == E_Pcall & &eventvalue === my_func then write(“entering my_func, value of X is:”, X) # BEFORE if &eventcode == (E_Pret | E_Pfail | E_Prem) & &eventvalue=== my_func then write(“leaving my_func, value of X is:”, X) # AFTER } end
Implementation of Example #2. Another typical situation involves an aggregate operation and selection of events according to a given pattern. The SAY expression is implemented by a call to write(); it must be performed post-mortem since it uses parameters whose values are constructed during the entire program execution. CARD denotes a counter, while SUM denotes an accumulator +/; both require a variable that is initialized to zero. The event subtypes and constraints are used to generate
additional conditional code in the body of the event processing loop. Lastly, some attributes such as r.duration require additional events and measurements besides the initial triggering event. In the case of r.duration, a time measurement between the function call and its return is needed. $include "evdefs.icn" link evinit procedure main(av) EvInit(av) | stop("can't monitor ", av[1]) cardreads := sumreadtime := 0 mask := cset(E_Fcall) while EvGet(mask) do { ### count CARD of r:input... if &eventcode == E_Fcall & &eventvalue === (read|reads) then cardreads +:= 1 ### add SUM of r.duration for r:input if &eventcode == E_Fcall & &eventvalue===(read|reads) then { thiscall := &time EvGet(E_Ffail++E_Fret) sumreadtime +:= &time - thiscall } } ### Translation of SAY write("Total number of read() statements: ", cardreads, "\n", "Elapsed time for read operations is: ", sumreadtime) end
Basic Generation Templates The preceding handwritten example monitors use a single main loop that implements traditional event-driven processing. Monitors generated by the UFO compiler reduce complex assertions to this same single event loop. Keeping event detection in a single loop allows uniform processing of multiple event types used by multiple monitors. The code generated by the UFO compiler integrates event detection, attribute collection, and aggregate operation accumulation in the main event loop. Assertions in UFO that use nested quantifiers entail two nested loops. Code generation flattens this loop structure, and postpones assertion processing until required information is available. A hybrid code generation strategy performs runtime processing whenever possible, delaying analyses until post-mortem time when necessary. Different assertions require different degrees of trace projection storage; code responsible for trace projection collection is also arranged within the main loop. Each UFO rule falls in one of the following categories which determines its code generation template in the current implementation. We have not found a use for assertions requiring more than two nested quantifiers. Type I
FORMAN template Single quantifier. Rule applies to whole trace(prog_ex); evaluates at runtime.
Pseudocode See examples in Section 4.1.
Type
FORMAN template Nested quantifiers of the form Quantifier A: Pattern_A Quantifier B: Pattern_B FROM A Body
II
This requires accumulation of a trace projection for B-events and causes a mild overhead at runtime.
Nested quantifiers of the form
III
Quantifier A: Pattern_A Quantifier B: Pattern_B FROM A .prev_path Body
Accumulates a trace projection for Bevents and may cause a heavy overhead at runtime. The B-list can not be deleted till the end of session. Nested quantifiers of the form
IV
Quantifier A: Pattern_A Quantifier B: Pattern_B FROM A .following_path (or FROM prog_ex) Body
Accumulates trace projections for both A and B events and causes a very heavy overhead at runtime.
Pseudocode Main Loop Maintain stack of nested A events Accumulate events B in a B-list If end of event A Loop over B-list Do Body Endif If stack of A is empty Destroy B-list End of Main Loop Main Loop Maintain stack of nested A events Accumulate events B in a B-list If end of event A Loop over B-list If B precedes A Do Body Endif End of Main Loop Main Loop Accumulate events A in A-list Accumulate events B in B-list End of Main Loop # Postmortem Loop Loop over A-list Loop over B-list Do Body End of Postmortem Loop
Compiler-Based Optimizations The advantage of the UFO approach is the combination of an optimizing compiler for monitoring code with efficient run-time event detection and reporting. Since we know at compile time all necessary event types and attributes required for a given UFO program, the generated monitor is very selective about the behavior that it observes. For certain UFO constructs, such as nested quantifiers, monitors accumulate a sizable projection of the complete event trace and postpone corresponding computations until required information is available. The use of the previous_path and following_path attributes in UFO assertions facilitates this kind of optimization. For further optimization, especially in the case of programs containing a significant number of modules, the following FORMAN construct limits event processing to events generated within the bodies of functions F1, F2, … , Fn. WITHIN F1, F2, … , Fn DO Rules END_WITHIN
This provides for monitoring only selected segments of the event trace. Unicon expressions included in the value_at_begin and value_at_end attributes are evaluated at run time. Some other optimizations implemented in this version are: • only attributes used in the UFO rule are collected in the generated monitor; • an efficient mechanism for event trace projection management, which disposes from the stored trace projection those events that will not be used after a certain time (for example, see Category II); • event types and context conditions are used to filter events for the processing. UFO’s goal of practical application to real-sized programs has motivated several improvements to the already-carefully-tuned Alamo instrumentation of the Unicon VM. We are working on additional optimizations.
6.
Results of Sample Assertion Execution
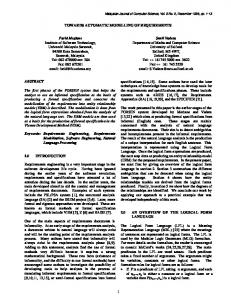
Table 1 gives results from executing rules written in UFO on a sample target program, a 1,100 line version of egrep. Tests were run on a 700 MHz Solaris machine with 512MB of RAM. The results reported are number of events generated by the VM and execution time averaged over several runs. Execution time is reported as minutes:seconds.tenths. The second row contains the time for program execution without monitoring. Each program/input file combination was monitored by 8 different assertions corresponding to the basic generation templates. Cases 1-4 are examples of a Category I template. Case 5 is a Category II rule. Case 6 is a Category III rule. It uses PREV_PATH and accumulates a trace projection over part of the program execution. Cases 7 and 8 contain nested quantifiers that belong to Category IV. These assertions require the accumulation of two trace projections over the entire program execution, and complete post-mortem processing. Case 9 is composed of all the previous assertions to yield a monitor that combines multiple assertions on a single execution of the target program. Table 1. Results for igrep.icn. Input Size (lines) No monitoring
4000
16000
64000
0.5
1.6
6.4
Events
Time
Events
Time
Events
Time
Case 1
184208
4.1
736208
16.2
2944208
1:04.9
Case 2
284123
4.6
1136123
18.1
4544123
1:12.9
Case 3
184208
3.4
736208
13.5
2944208
54.0
Case 4
184208
3.5
736208
13.6
2944208
54.0
Case 5
276306
6.3
1104306
28.0
4416306
2:09.3
Case 6
276306
6.5
1104306
28.4
4416306
2:11.8
Case 7
276306
6.5
1104306
29.1
4416306
2:11.3
Case 8
276306
6.5
1104306
29.4
4416306
2:12.6
Case 9
340306
45.9
1360306
3:57.8
5440306
20:38.6
The results depicted in this table allow several observations. Average monitoring speeds on simple assertions in the test environment were in the range of 2-3 million events per minute. Monitoring realistic assertions on real-size programs with real-size input data is feasible with this system. Most assertions impose about one order of magnitude execution slowdown compared with the unmonitored program execution. The execution time required by the combination of all assertions (Case 9) is longer than the sums of separate monitor executions. Combined assertion executions have greater memory requirements in the current implementation, because separately collected trace projections compete for available cache and virtual memory resources. Multi-assertion optimizations are not yet implemented in the current UFO compiler.
7. Related Work What follows is a very brief survey of basic ideas known in Debugging Automation to provide the background for the approach advocated in this paper. The Event Based Behavioral Abstraction (EBBA) [10] characterizes the behavior of programs in terms of primitive and composite events. Context conditions involving event attributes are used to distinguish events. EBBA defines two higher-level means for modeling system behavior -- clustering and filtering. Clustering is used to express behavior as composite events, i.e. aggregates of previously defined events. Filtering serves to eliminate from consideration events, which are not relevant to the model being investigated. Both event recognition and filtering can be performed at run-time. Event-based debuggers for the C programming language built on top of GDB include Dalek [11] and COCA [12]. Dalek supports user-defined events that typically are points within a program execution trace. A target program has to be manually instrumented in order to collect values of event attributes. Composite events can be recognized at run-time as collections of primitive events. COCA uses GDB for tracing and PROLOG for the execution of debugging queries. It provides an event grammar for C and event patterns based on attributes for event search. The query language is designed around special primitives built into the PROLOG query evaluator. Assertion languages provide another approach to debugging automation. Boolean expressions are attached to points in the target program, like the assert() macro in C. [13] advocates a practical approach to programming with assertions for the C language, and demonstrates that even local assertions associated with particular points within the program may be extremely useful for program debugging The ANNA [14] annotation language for the Ada language supports assertions on variable and type declarations. The TSL [15], [16] annotation language for Ada uses events to describe the behavior of Tasks. Patterns can be written which involve parameter values of Task entry calls. Assertions are written in Ada using a number of special pre-defined predicates. Assertion-checking is performed at run-time. RAPIDE [17] provides an event-based assertion language for software architecture description. Temporal Rover is a commercial tool for dynamic analysis based on temporal logics [18]. The DUEL [19] debugging language introduces expressions for C aggregate data exploration, for both assertions and queries.
Algorithmic debugging was introduced in [20] for the Prolog language. In [21] and [22] this paradigm is applied to a subset of PASCAL. The debugger executes the program and builds a trace execution tree at the procedure level while saving some useful trace information such as procedure names and input/output parameter values. The debugger traverses the execution tree, asking the user about the intended behavior of each procedure. The search finally ends and a bug is localized within a procedure p when one of the following holds: procedure p contains no procedure calls, or all procedure calls performed from the body of procedure p fulfill the user's expectations. The notion of computation over execution trace introduced in FORMAN is a generalization of Algorithmic Debugging and is a convenient basis for describing such generic debugging strategies. PMMS [23] is a high level program monitoring and measuring system. This system works by receiving queries from the user about target programs written in the AP5 high level programming language. PMMS instruments the source code of the target program in order to gather data necessary to answer the posed questions. This data is collected during run time by the monitoring facilities of PMMS and stored in a database for subsequent analysis. Their domain specific query language is similar to FORMAN but tailored for database-style query processing. JPAX [9], the Java Path Explorer, provides a means to check execution events within a program based on a user provided specification written in Maude, a high level logic language. Like UFO, JPAX supports monitoring based on a VM (JVM). JPAX supports both black box (based on automatic byte-code instrumentation) and white box (based on hand instrumentation) runtime verification. Dynascope [24] is a system for directing programs written in vanilla C. A director monitors and controls the actions of the program, while an interpreter controls the flow of event streams to and from the director in addition to interpreting the program. Dynascope can test and debug programs without altering their source code. YODA [25] uses a preprocessor to attach statements to a target Ada program. These statements activate a monitor creates a trace database and a symbol table to aid in debugging. The trace database will contain the program's history regarding variable declaration and use, task synchronization, and change in task status. Prolog queries can be issued by the user in order to confirm or reject hypotheses about program behavior. YODA represents a classical post-mortem trace processing paradigm.
8. Conclusions and Future Work The rising popularity of virtual machine architectures enables dramatic improvements in automatic debugging. These improvements will only occur if debugging is one of the objectives of the VM design, e.g. as in the case of .net [26]. The architecture employed in UFO could be adapted for a broad class of languages such as those supported by the Java VM or the .net VM. Our approach to debugging automation uniformly represents many types of debugging-related activities as computations over traces, including assertion checking, profiling and performance measurements, and the detection of typical errors. We have integrated event trace
computations into a monitoring architecture based on a VM. Preliminary experiments demonstrate that this architecture is scalable to real-world programs. One of our next steps is to build a repository of formalized knowledge about typical bugs in the form of UFO rules, and gather experience by applying this collection of assertions to additional real-world applications. There remain many optimizations that will improve the monitor code generated by the UFO compiler, for example, merging common code used by multiple assertions in a single monitor, and generating specialized VMs adjusted to the generated monitor. Acknowledgements This work has been supported in part by U.S. Office of Naval Research Grant # N00014-01-1-0746, by U.S. Army Research Office Grant # 40473--MA-SP, by the NSF Grant # EIA 02-20590, and by the National Library of Medicine. References [1] Communications of the ACM, Vol.4, 1997. [2] F. Brooks, The Mythical Man-Month. Addison-Wesley, Reading, MA, 1975. [3] Mikhail Auguston, Program Behavior Model Based on Event Grammar and its Application for Debugging Automation, Proceedings of the 2nd Int’l Workshop on Automated and Algorithmic Debugging, Saint-Malo, France, May 1995, pp. 277-291. [4] M. Auguston, A. Gates, M. Lujan, "Defining a Program Behavior Model for Dynamic Analyzers", in Proceedings of the 9th International Conference on Software Engineering and Knowledge Engineering, SEKE'97, Madrid, Spain, June 1997, pp. 257-262. [5] M. Auguston, “Lightweight semantics models for program testing and debugging automation”, Proceedings of the 7th Monterey Workshop, June 2000, pp.23-31. [6] Clinton L. Jeffery, Program Monitoring and Visualization: an Exploratory Approach. Springer, New York, 1999. [7] Clinton Jeffery, Shamim Mohamed, Ray Pereda, and Robert Parlett, "Programming with Unicon", http://unicon.sourceforge.net. [8] Ralph E. Griswold and Madge T. Griswold, The Icon Programming Language, 3rd edition. Peer to Peer Communications, San Jose, 1997. [9] K. Havelund, S. Johnson, G. Rosu. “Specification and Error Pattern Based Program Monitoring”, ESA Workshop on On-Board Autonomy, Noordwijk, Holland, Oct. 2001. [10] P. C. Bates, J. C. Wileden, "High-Level Debugging of Distributed Systems: The Behavioral Abstraction Approach", Journal of Systems and Software 3, 1983, pp. 255-264. [11] R. Olsson, R. Crawford, W. Wilson, "A Dataflow Approach to Event-based Debugging", Software -- Practice and Experience, Vol.21(2), February 1991, pp. 19-31. [12] M. Ducasse, "COCA: An automated debugger for C", in Proceedings of the 1999 International Conference on Software Engineering, Los Angeles, 1999, pp. 504-513. [13] D. Rosenblum, "A Practical Approach to Programming with Assertions", IEEE Transactions on Software Engineering, Vol. 21, No 1, January 1995, pp. 19-31. [14] D. C. Luckham, S. Sankar, S. Takahashi, "Two-Dimensional Pinpointing: Debugging with Formal Specifications", IEEE Software, Vol. 8, No 1, January 1991, pp.74-84. [15] D. C. Luckham, D. Bryan, W. Mann, S. Meldal, D. P. Helmbold, "An Introduction to Task Sequencing Language, TSL version 1.5", Stanford University, Feb. 1990, pp. 1-68. [16] D. Rosenblum, "Specifying Concurrent Systems with TSL", IEEE Software, Vol. 8, No 3, May 1991, 52-61. [17] D. Luckham, J. Vera, "An Event-Based Architecture Definition Language", IEEE Transactions on Software Engineering, Vol.21, No. 9, 1995, pp. 717-734.
[18] D. Drusinsky, The Temporal Rover and the ATG Rover, LNCS #1885, pp.323-330, Springer, 2000. [19] M. Golan, D. Hanson, "DUEL - A Very High-Level Debugging Language", in Proceedings of the Winter USENIX Technical Conference, San Diego, Jan. 1993. [20] E. Shapiro, "Algorithmic Program Debugging", MIT Press, May 1982. [21] P. Fritzson, N. Shahmehri, M. Kamkar, T. Gyimothy, "Generalized Algorithmic Debugging and Testing", ACM LOPLAS, Vol 1 (4), Dec 1992. [22] N. Shahmehri, "Generalized Algorithmic Debugging", Ph.D. Thesis No. 260, Dept. of Computer and Information Science, Linköping University, S-581 83 Linköping, 1991. [23] Y. Liao, D. Cohen, "A Specificational Approach to High Level Program Monitoring and Measuring", IEEE Transactions on Software Engineering, Vol 18, No 11, Nov 1992, pp.969 – 978. [24] R. Sosic, "Dynascope: a Tool for Program Directing", Sigplan Notices 27(7), pp.12-21, 1992. [25] LeDoux, Carol H. and Parker, D., "Saving Traces for Ada Debugging. Ada in Use", Proc. of the Ada International Conference, ACM Ada Letters, 5(2), pp.97-108, Sep 1985. [26] http://www.microsoft.com/net/
Appendix. Syntax for UFO rules Rules::= ( ( Rule | Within_group ) ';') + Within_group::= 'WITHIN' Procedure_name ( ',' Procedure_name ) * 'DO' ( Rule ';' ) + 'END_WITHIN' Rule::= [ Label ':' ] [ ('FOREACH' | 'FIND') Pattern [ 'FROM' 'PROG_EX' ] ] [ ('FOREACH' | 'FIND') Pattern [ 'FROM' ('PROG_EX' | Metavariable [ '.' ( 'PREV_PATH' | 'FOLLOWING_PATH' )] ) ] [ 'SUCH' 'THAT' ] Bool_expr [['WHEN' 'SUCCEEDS'] Say_clause + ] ['WHEN' 'FAILS' Say_clause + ] Say_clause ::= ‘SAY’ '(' ( Expression | Metavariable | Aggregate_op ) * ’)' Bool_expr::= Bool_expr1 ( 'OR' Bool_expr1 )* Bool_expr1::= Bool_expr2 ( 'AND' Bool_expr2 )* Bool_expr2::= Expr [ ( '=' | '==' | '>' | '=' | '