Informatica 29 (2005) 143–154 143
Towards Improving Clustering Ants: An Adaptive Ant Clustering Algorithm André L. Vizine1,2, Leandro N. de Castro1,2, Eduardo R. Hruschka1, Ricardo R. Gudwin2 1
Catholic University of Santos (UniSantos) R. Carvalho de Mendonça, 144, 11070-906, Santos/SP, Brasil {vizine,lnunes,erh}@unisantos.br 2
State University of Campinas (Unicamp) DCA–FEEC–UNICAMP, Cx. Postal 6101, 13083-852, Campinas /SP, Brazil.
[email protected] Keywords: Ant clustering algorithm, data clustering, visual data mining Received: July 15, 2004 Among the many bio-inspired techniques, ant-based clustering algorithms have received special attention from the community over the past few years for two main reasons. First, they are particularly suitable to perform exploratory data analysis and, second, they still require much investigation to improve performance, stability, convergence, and other key features that would make such algorithms mature tools for diverse applications. Under this perspective, this paper proposes both a progressive vision scheme and pheromone heuristics for the standard ant-clustering algorithm, together with a cooling schedule that improves its convergence properties. The proposed algorithm is evaluated in a number of well-known benchmark data sets, as well as in a real-world bioinformatics dataset. The achieved results are compared to those obtained by the standard ant clustering algorithm, showing that significant improvements are obtained by means of the proposed modifications. As an additional contribution, this work also provides a brief review of ant-based clustering algorithms. Povzetek: Članek opisuje izboljšan algoritem grupiranja na osnovi pristopa kolonij mravelj.
1
Introduction
Over the past few years, several different types of biologically inspired algorithms have been proposed in the literature (Paton, 1994; de Castro & Von Zuben, 2004). Among these, some have obtained special attention from the scientific community, such as those based on swarm systems (Bonabeau et al., 1999; Kennedy et al., 2001), which are inspired by the social behavior of living organisms. This relatively new field of investigation has originated different types of algorithms for the solution of complex problems in many different domains. Under this perspective, the problems usually tackled involve search, optimization, and data analysis tasks. The main reasons by which swarm based approaches are useful for solving such problems are (Bonabeau et al., 1999; Kennedy et al., 2001): (i) they require little information about the problem at hand (e.g. in clustering problems a data set to be grouped); and (ii) they usually can perform both broad and parallel searches over the space of potential solutions by means of a population (swarm) of candidate solutions. Despite the broad usefulness of current bio-inspired algorithms, most of them can be further improved, mainly to enhance performance and applicability. In this sense, this work focuses on ant-based clustering algo-
rithms, whose main underlying concepts are based on the way real ants clean their nests and organize dead bodies in their colonies. Considering a more practical computational perspective, these algorithms are basically designed by considering the concept of a 2D grid where objects (data) are laid at random and then automatically organized. A set of ant-like agents is allowed to move throughout the grid, picking up and dropping objects (data) based on their similarity degree within a certain neighborhood. One difficulty in applying ant-clustering algorithms to solve complex problems comes from the fact that, in most cases, they generate a number of clusters that is much larger than the natural number of clusters. Furthermore, these algorithms usually do not stabilize in a particular clustering solution; that is, they constantly construct and deconstruct clusters during the iterative procedure of adaptation. In order to overcome the aforementioned difficulties and, consequently, improve the quality of the results obtained, we propose an Adaptive Ant-Clustering Algorithm (A2CA), which is more robust in terms of the number of clusters found and tends to converge into good solutions while the clustering process
144
evolves. To achieve these goals, three main modifications are introduced in the standard ant-clustering algorithm proposed by Lumer and Faieta (1994): (i) a cooling schedule for the parameter that controls the probability of ants picking up objects from the grid; (ii) a progressive vision field that allows ants to ‘see’ over a wider area; and (iii) the use of a pheromone function added to the grid as a way to promote reinforcement for the dropping of objects at more dense regions of the grid. These modifications favor an adaptive clustering process, in the sense that the proposed algorithm tends to converge to stable clusters. In addition to the contributions to the algorithm itself, this paper also brings a brief historical review of ant-based clustering algorithms, emphasizing their main features when compared with the standard antclustering algorithm proposed by Lumer and Faieta (1994). The paper is organized as follows. Section 2 provides a brief review of the standard ant-clustering algorithm (Lumer & Faieta, 1994), which, for the sake of brevity, is referred to as SACA in this work. In Section 3, we present our proposed algorithm (A2CA), which, in Section 4 is experimentally compared to the SACA in three synthetic and one real-world dataset. Section 5 provides a brief survey of related works, whereas Section 6 concludes the paper and points out some avenues for future work.
2
A.L. Vizine et al.
Informatica 29 (2005) 143–154
Standard Ant Clustering Algorithm: SACA
The Standard Ant Clustering Algorithm (SACA), introduced by Lumer and Faieta (1994), assumes that ants perform random walks on a two-dimensional grid on which objects (data) are laid down at random. Independently of the dimension of the input data, each datum is randomly projected onto a cell of the grid. A grid cell (or patch) is thus responsible for hosting the index of a specific input pattern, indicating the relative position of the datum in the two-dimensional grid. The general idea is to have items, which are similar in their original Ndimensional space, in neighboring regions of the grid. In other words, data indices that are neighbors in the grid indicate patterns that are similar in their original space of attributes. In this context, it is assumed that each site or cell on the grid can be occupied by at most one object, and one of the two following situations may occur: (i) one ant holds an object i and evaluates the probability of dropping it in its current position; (ii) an ant is unloaded and evaluates the probability of picking up an object. At each discrete time step, an ant is selected at random and can either pick up or drop an object at its current location. The probability of picking up an object increases with low-density neighborhoods and decreases with high similarity among objects in the surrounding area. The probability of dropping an object, by contrast, increases with high densities of similar objects in the neighborhood. More specifically, assume that d(i,j) is the Euclidean distance between objects i and j in their N-dimensional space. The density dependent function for object i, at a
particular grid location, is defined by the following expression: ⎧1 (1 − d (i, j ) / α) if f (i ) > 0 , ⎪ (1) f (i ) = ⎨ s 2 ∑ j ⎪⎩0 otherwise. where s2 is the number of cells in the surrounding area of i, and α is a constant that scales the dissimilarities among objects. The maximum value for f(i) is obtained if, and only if, all the sites in the neighborhood are occupied by equal objects. Assuming the density dependent function presented in Eq. (1), the probability of picking up and dropping an object i is given by Eqs. (2) and (3), respectively: 2
⎞ ⎛ kp ⎟ , Ppick (i ) = ⎜ ⎜ k + f (i ) ⎟ ⎠ ⎝ p
(2)
⎧2 f (i ) if f (i ) < k d ; , Pdrop (i ) = ⎨ (3) ⎩1 otherwise. where the parameters kp and kd are threshold constants equal to 0.1 and 0.15, respectively. Note that f(i) ∈ [0,1]. Thus, if f(i) > kp, meaning that objects are unlikely to be removed from dense regions. In the case of Pdrop, it is also possible to observe that if f(i) θ and s2 ≤ s2max,
(5)
then s2 ← s2 + ns. 2 where s max = 7 × 7 and θ = 0.6 in our implementation.
3.3
Pheromone Heuristics
In order to perform data clustering, the SACA takes into account the relative distance among all objects within the vision field of the ant. A problem with this approach is that it does not account for the work in progress at a global level. One form of overcoming this difficulty was proposed by Sherafat et al. (2004a,b). The method is based on the introduction of a local variable φ(i) associated with each bi-dimensional position, i, on the grid, such that the quantity of pheromone in that exact position becomes a function of the presence or absence of an object at i. Inspired by the way termites use pheromone to build their nests, the artificial agents in the modified ant clustering algorithm will add some pheromone to the objects they carry and this pheromone will be transferred to the grid when an object is deposited. During each iteration, the artificial pheromone φ(i) at each cell of the grid evaporates at a fixed rate. Sherafat et al. (2004a,b) introduced a pheromone function, Phe(φmax,φmin,P,φ(i)), given by Eq. (6), that influences the probability of picking up and dropping off objects from and on the grid. The proposed pheromone function varies linearly with the pheromone level at each grid position, φ(i), and depends on a number of userdefined parameters, such as the φmax and φmin values of pheromone perceived by the agent, and the maximal influence of pheromone allowed, P. Phe(.) =
2.P
φ max − φ min
φ( i ) −
2.P.φ max +P, φ max − φ min
(6)
To accommodate the addition of pheromone on the grid, some variations on the picking and dropping probability functions of SACA were proposed in (Sherafat et al., 2004a,b), as described in Eqs. (7) and (8), respectively: 2
⎛ ⎞ . (7) kp ⎟ Ppick (i ) = (1 − Phe(φ min , φ max , P, φ (i ))) × ⎜ ⎜ k + f (i ) ⎟ p ⎝ ⎠ 2
⎛ f (i ) ⎞ . (8) ⎟⎟ Pdrop (i ) = (1 + Phe(φ min , φ max , P, φ (i ))) × ⎜⎜ ⎝ k d + f (i ) ⎠
where φmax represents the current largest amount of pheromone perceived by this agent; φmin corresponds to the current smallest amount of pheromone perceived by this agent; P is the maximum influence of the pheromone in changing the probability of picking and dropping data elements; and φ(i) is the quantity of pheromone in the current position i. Note that in Eq. (8) the dropping probability originally derived from the model of Deneubourg et al. (1991) was employed. Basically, this choice was made because the algorithm presented superior performance when using the function proposed by Deneubourg et al. (1991) – given by Eq. (9) - instead of Eq. (3) for the dropping probability. This was also the case for SACA. Therefore,
146
A.L. Vizine et al.
Informatica 29 (2005) 143–154
we also adopt this strategy in our present work, namely the dropping probability is an inverse function of a parameter kd:
This proposal then becomes a sort of density-based clustering procedure (Everitt et al., 2001).
φ(i) ← φ(i) × 0.99.
(12)
2
⎛ f (i ) ⎞ ⎟⎟ . Pdrop (i ) = ⎜⎜ ⎝ k d + f (i ) ⎠
(9)
4
Based on the sensitivity analysis described in Sherafat et al. (2004a,b) and on some preliminary experiments, we realized that setting the parameters φmax, φmin and P may become a difficult task depending on the problem at hand. In order to reduce the number of user-defined parameters and to improve even further the performance of the algorithm, we propose to substitute Eqs. (7) and (8) by the following equations: 2
Ppick (i ) =
⎛ ⎞ kp 1 ⎜ ⎟ . f (i )φ (i ) ⎜⎝ k p + f (i ) ⎟⎠
(10)
2
⎛ f (i ) ⎞ . ⎟⎟ Pdrop (i ) = f (i )φ (i )⎜⎜ ⎝ k d + f (i ) ⎠
(11)
where f(i) is the density dependent function, φ(i) is the quantity of pheromone in the current position i, and kp and kd are the picking and dropping probability constants, respectively. Note that, in this new proposal, the only new parameter introduced in relation to SACA is the pheromone level at each position of the grid. According to Eq. (10), the probability that an ant picks up an item from the grid is inversely proportional to the amount of pheromone at that position and also to the density of objects around i. This equation thus accounts for the pheromone reinforcement signal in regions of the space filled with similar objects. If the region is filled with dissimilar objects, however, the incorporation of f(i) multiplying φ(i) counterbalances the effects of eventual high pheromone concentrations. By the same token, Eq. (11) states that regions with high concentration levels of pheromone are attractive for the deposition of more objects of similar type. It is important to observe that a region with a high quantity of pheromone tends to be either a recently constructed cluster or a cluster under construction. The pheromone is a variable of the discrete grid environment, i.e. each grid position i has an independent variable φ(i) for which pheromone evaporation and diffusion procedures are implemented. The rate at which pheromone evaporates is preset, as defined in Eq. (12). Each grid position i also has a connection to its neighbors that causes a percentage of φ(i) to be diffused to them. This is performed in such a way that the pheromone percentage for the two closer neighbors in all directions decays geometrically in the reason of 1/2, whereas for the third closer neighbors in all directions it is set equal to zero. In our implementation, the maximum amount of added pheromone φ(i) is equal to 0.01. The proposed approach increases the probability of deconstruction of relatively small clusters and increases the probability of dropping data elements in denser clusters. This is directly influenced by the similarity between the data and the cluster.
Performance Evaluation
In order to assess the performance of the adaptive antclustering algorithm (A2CA) in comparison with the standard algorithm with cooling and dropping probability given by Eq. (9), named here SACA*, both algorithms were applied to a number of synthetic data sets and to one real-world bioinformatics data set. The parameters used to run the algorithms were based on the sensitivity analysis performed in Sherafat et al. (2004a) and on some preliminary experiments performed here. The benchmarks used for evaluation and the respective adaptation parameters for the algorithms are summarized below. Further details are provided in each dedicated section. Parameters θ = 0.6, kp = 0.20, kd = 0.05 are assumed default and were chosen for all experiments. • 4Gauss: 100 objects divided into 4 clusters (classes). nants = 10, grid = 25×25, and α = 0.35. • Ruspini data: 75 objects divided into 4 classes. nants = 10, grid = 25×25, and α = 0.35. • ANIMALS data set: 16 objects with 13 attributes (the number of classes varies based on the grouping performed). nants = 1, grid = 15×15, and α = 2.10. • Yeast galactose data: 205 objects divided into 4 classes. nants = 10, grid = 35×35, and α = 1.05. Note that the parameters used to run the algorithms are almost the same for all data sets; the only ones that change are α, the grid size, and the number of ants nants. As one grid cell is used to accommodate one object, the grid is increased in size in proportion to the size of the input data set. The parameter α, by contrast, weighs the influence of the distance measure in determining the clusters. Its value was linearly varied using a factor 0.35 for the employed data sets. In the ANIMALS data set, a single ant was used because the number of objects is very small, only 16.
4.1
Four Gaussian Distributions
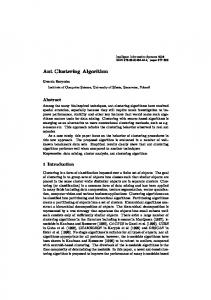
The first data set used to illustrate the performance of the algorithm was a modified version of the well-known four classes data set proposed by Lumer and Faieta (1994) to study the standard ant-clustering algorithm. The data set used here corresponds to four distributions of 25 data points each, defined by Gaussian probability density functions with various means µ and fixed standard deviation σ = 1.5, G(µ,σ), as follows (Figure 1): A = [x ∝ G(0,1.5), y ∝ G(0,1.5)]; B = [x ∝ G(0,1.5), y ∝ G(8,1.5)]; C = [x ∝ G(8,1.5), y ∝ G(0,1.5)]; D = [x ∝ G(8,1.5), y ∝ G(8,1.5)].
TOWARD IMPROVING CLUSTERING ANTS...
Informatica 29 (2005) 143–154 147
1.2
1 0.8
0.6
0.4
0.2 0
-0.2 -0.2
0
0.2
0.4
0.6
0.8
1
1.2
Figure 1: Gaussian distributions: input data set.
schedule for kp described previously (SACA*). The pictures correspond to the output grid of two different simulations generated by the ants after convergence, in this case after 273,000 ant steps (27.3 cycles). Each input datum is numbered from 0 to 99, where the first 25 (from 0 to 24) belong to the first cluster, and so on. Note that, accordingly with what was previously discussed by Lumer and Faieta (1994), the standard ant-clustering algorithm (SACA), though capable of correctly clustering the data, generates a large number of sub-clusters in most cases. In our experiments, we observed that, even with the use of a cooling procedure (i.e., SACA*), this characteristic tends to be maintained. Figure 2(b) shows some results for A2CA. It can be noted that the adaptive algorithm generates a much smaller number of subclusters; in most cases, only four or five groups of data are generated.
Figure 2(a) depicts some simulation results for the standard ant-clustering algorithm with the geometric cooling C2
C3
C2
C1
C3
0
C3
C1
C1
C2 C1
C3
C3 0
C4 C4
C4 C4
(a-1)
C4 C4
(a-2) 0
C1
C3
0
C1
C3
C4 C3
C2 C4 C2
(b-1)
(b-2)
Figure 2: Two different results for the standard ant-clustering algorithm SACA* (a) and A2CA (b).
C2
A.L. Vizine et al.
Informatica 29 (2005) 143–154
148
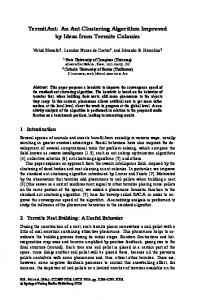
Figure 3(a) and (b) show, respectively, the evolution of the average pheromone level on the grid and the average vision of all ants for the simulations depicted in Figure 2(b-1). In Figure 4(a) we reproduce Figure 2(b-1), for convenience, and contrast the final distribution of objects onto the grid with the 3D (Figure 4(b)) and 2D (Figure 4(c)) views of the pheromone distribution on the grid after convergence. It is easy to observe the higher concentration of pheromone in regions of the grid with large data density. It can also be noted from these pictures that the average pheromone level on the grid and vision field of the ants tend to stabilize after a number of iterations. In the particular case of vision, all ants converge to a vision field of dimension 7 × 7.
0
C1
C4
C3
C2
(a)
1.5
1.4
φav(i)
1.3
1.2
1.1
1 0
5
10
15 Cycles
20
25
30
(a) 7.5
(b)
7 6.5
Visionav
6 5.5 5 4.5 4 3.5 3 2.5
0
5
10
15 Cycles
20
25
30
(b) Figure 3: Evolution of the average pheromone level on the grid (a), and the average vision field of the ants (b) for the experiment depicted in Figure 2(b-1).
(c) Figure 4: Objects and pheromone distribution on the grid after convergence. (a) Final distribution of objects on the grid after convergence (Figure 2(b-1)). Three-dimensional perspective (b) and two-dimensional perspective (c) of the pheromone distribution on the grid after convergence.
TOWARD IMPROVING CLUSTERING ANTS...
4.2
Informatica 29 (2005) 143–154 149
with the binary feature attributes as shown in Table 1. A value of 1 in this table corresponds to the presence of an attribute, whilst a value of 0 corresponds to the lack of this attribute. The authors suggested that the interestingness of this data set lies in the fact that the relationship between the different symbols may not be directly detectable from their encoding, thus not presuming any metric relations even when the symbols represent similar items.
Animals Data Set 2
This section compares the performance of A CA with SACA* when applied to the ANIMALS data set. This high-dimensional data set was originally proposed by Ritter and Kohonen (1989) to verify the capability of a self-organizing map creating a topographic map of the input data based on a symbol set. The data set is composed of 16 input vectors, each representing an animal
0. Dove 1. Hen 2. Duck 3. Goose 4. Owl 5. Hawk 6. Eagle 7. Fox 8. Dog 9. Wolf 10. Cat 11. Tiger 12. Lion 13. Horse 14. Zebra 15. Cow
Table 1: Animal data set with their names and binary attributes (after Ritter & Kohonen, 1989).
Is
Has
Likes to
Small Medium Big Two legs Four legs Hair Hooves Mane Feathers Hunt Run Fly Swim
1 0 0 1 0 0 0 0 1 0 0 1 0
1 0 0 1 0 0 0 0 1 0 0 0 0
1 0 0 1 0 0 0 0 1 0 0 0 1
1 0 0 1 0 0 0 0 1 0 0 1 1
Table 2 describes the results found by both algorithms when applied to the ANIMALS data set. It can be observed that A2CA consistently determined two groups of data, one corresponding to the birds and another referring to the mammals. In most cases SACA* presented the same results as A2CA, but it sometimes separated the mammals into two groups that apparently do not make much sense. For instance, in run 5, SACA* mixed Lion
1 0 0 1 0 0 0 0 1 1 0 1 0
1 0 0 1 0 0 0 0 1 1 0 1 0
0 1 0 1 0 0 0 0 1 1 0 1 0
0 1 0 0 1 1 0 0 0 1 0 0 0
0 1 0 0 1 1 0 0 0 0 1 0 0
0 1 0 0 1 1 0 1 0 1 1 0 0
1 0 0 0 1 1 0 0 0 1 0 0 0
0 0 1 0 1 1 0 0 0 1 1 0 0
0 0 1 0 1 1 0 1 0 1 1 0 0
0 0 1 0 1 1 1 1 0 0 1 0 0
0 0 1 0 1 1 1 1 0 0 1 0 0
0 0 1 0 1 1 1 0 0 0 0 0 0
(12) with Horse (13) and Zebra (14). In (Haykin, 1999 – p. 476), a self-organizing map for the ANIMALS data set is presented with three main groups: birds, peaceful mammals and hunters. However, the partition of the output map could also have been made so as to distinguish only two different groups, as the results presented by SACA* and A2CA.
Table 2: Groups found by SACA* and A2CA for the ANIMALS data set.
Run 1 2 3 4 5 6 7 8 9 10 Av. ± std
4.3
Nc 2 2 2 3 3 2 3 2 2 2 2.3 ± 0.48
SACA* Groups (0-6) (7-15) (0-6) (7-15) (0-6) (7-15) (0-6) (10) (7-9,11-15) (0,6) (7-11,15) (12-14) (0-6) (7-15) (0-6) (7-12,15) (13,14) (0-6) (7-15) (0-6) (7-15) (0-6) (7-15)
Ruspini Data
The Ruspini data is a well-known dataset commonly used to benchmark clustering algorithms (Kaufman &
Nc 2 2 2 2 2 2 2 2 2 2 2±0
A2CA Groups (0-6) (7-15) (0-6) (7-15) (0-6) (7-15) (0-6) (7-15) (0-6) (7-15) (0-6) (7-15) (0-6) (7-15) (0-6) (7-15) (0-6) (7-15) (0-6) (7-15)
Rousseeuw, 1990). It is formed by 75 objects grouped into four clusters, as depicted in Figure 5. Let nc be the number of clusters found and Pmc the percentage of misclassification. Table 3 summarizes the performance of both algorithms when applied to the Ruspini data. The
A.L. Vizine et al.
Informatica 29 (2005) 143–154
150
results presented are the average ± standard deviation taken during 10 runs of each algorithm. Similarly to the results presented in the previous experiments, A2CA consistently found the correct number of clusters with no classification errors. 160 140 120 100 80 60 40 20 0
0
20
40
60
80
100
120
Figure 5: Ruspini data. Table 3: Performance evaluation for the standard ant clustering algorithm with cooling (SACA*) and the adaptive ant clustering algorithm (A2CA). A2CA
SACA* Ruspini
nc
Pmc (%)
nc
Pmc (%)
7.4 ± 1.46
1.5 ± 2.72
4.0 ± 0.0
0 ± 0.0
0
C1
4.4
Yeast Galactose Data
The last data used for evaluation is the yeast galactose data set (Yeung et al., 2003). This is a real-world bioinformatics dataset composed of 20 experiments (attributes) – nine single-gene deletions and one wild-type experiment with galactose and raffinose, nine deletions and one wild-type without galactose and raffinose. Similarly to Yeung et al. (2003), we used a subset of 205 genes (objects), whose expression patterns reflect four functional categories (clusters) formed by 83, 15, 93 and 14 genes (objects). The dataset used in the simulations reported here take into account four repeated measurements, what may yield more accurate and more stable clusters (Yeung et al., 2003). To cluster data with repeated measurements, the average expression levels over all repeated measurements for each gene and each experiment were taken. For this data set, the standard algorithm (SACA*) demonstrated to be incapable of correctly grouping the data in most simulations. The proposed algorithm, however, was capable of appropriately grouping the data in all runs, but with varying numbers of clusters being found each time the algorithm was run. Over 10 runs, A2CA presented the following results: nc = 6.9 ± 1.0 and Pmc = 3.17% ± 0.93%. Figure 6 depicts one solution for the A2CA applied to the yeast data set. This figure also depicts the clusters found (within dashed lines) and the objects incorrectly grouped (within solid lines).
C1
C2
C4 C3
Figure 6: One grid solution for A2CA when applied to the yeast galactose data.
TOWARD IMPROVING CLUSTERING ANTS...
5
Ant Clustering Algorithms: A Brief Survey
Several clustering methods based on ant behavior have been proposed in the literature, showing the increasing importance of this subject. This section provides a brief description of these methods, following a chronological order. In 1991, Deneubourg et al. (1991) introduced a model in which simple ants were able to sort into piles objects initially strewn randomly across a plane. These ants have a sorting behavior based on local rules, i.e. possessing only local perceptual capabilities. Gutowitz (1993) called these agents basic ants, which have: (i) a finite memory, which is a register of length n that records the presence or absence of objects at the ant’s previous n locations; (ii) an object-manipulation capacity; (iii) a function that gives the probability to manipulate an object proportionally to the values in memory and a random variable; and (iv) the capability to execute Brownian motion. Besides, as previously observed in the Deneubourg’s model, two objects can only be either identical or different. Obviously, this same idea can be easily extended to deal with other distance metrics such as the well-known Euclidean norm. Although the basic ants have only local perceptual capabilities, they are able to promote global order. The mechanism underlying this phenomenon was carefully investigated by Gutowitz (1993). He proposed the complexity-seeking ants, which are variants of the basic ants proposed by Deneubourg et al. (1991). The complexityseeking ants are allowed to see local complexity and tend to perform actions in regions of highest local complexity. The neighborhood complexity is the number of faces that separate cells of different types, containing or not an object. In this sense, all-empty or all-occupied neighborhoods have zero complexity (low entropy), whereas checkerboard patterns have complexity equals to 12 (assuming a 9-cell neighborhood). Thus, complexityseeking ants can calculate the complexity of their local environment and are able to accomplish their task more efficiently than the basic ants, mainly because they tend to manipulate objects in regions of high complexity; that is, at intermediate density regions, where the entropy is high. As previously addressed in Section 2, Lumer and Faieta (1994) introduced a method for structuring complex datasets into clusters. The proposed method is inspired by the model of Deneubourg et al. (1991), in which ant-like agents move at random on a 2dimensional grid, where objects are scattered at random. Inspired by the biological phenomenon of dead body clustering, the ants do not communicate with each other and can only perceive their surrounding local environment. In this context, each ant-like agent can either pick up an object from the grid or drop it onto the grid. The probability of picking up an object decreases with both the density of other objects and the similarity with other objects within a given neighborhood. By contrast, the probability of dropping an object increases with the simi-
Informatica 29 (2005) 143–154 151
larity and the density of objects within a local region. Although the work in (Deneubourg et al., 1991) is restricted to environments made of either identical objects or two distinct types of objects, Lumer and Faieta (1994) generalized this model to work with objects that differ along a continuous similarity measure. This led to the algorithm that we have called SACA in our work. Monmarché et al. (1999) combined the stochastic and exploratory principles of clustering ants with the deterministic and heuristic principles of the popular k-means algorithm in order to improve the convergence of the antbased clustering algorithm. The proposed hybrid method is called AntClass and is based on the work of Lumer and Faieta (1994). The AntClass algorithm allows an ant to drop more than one object in the same cell, forming heaps of objects. It involves four main steps: (i) antbased clustering; (ii) k-means algorithm using the initial partition provided by ants; (iii) ant-based clustering on heaps of objects previously found; (iv) k-means algorithm once more. Another important contribution of the AntClass algorithm is that it also makes use of hierarchical clustering, implemented by allowing ants to carry an entire heap of objects. Ramos and Merelo (2002) developed an ant clustering system called ACLUSTER, which was employed for textual document clustering. The authors proposed the use of bio-inspired spatial transition probabilities, avoiding randomly moving agents, which may explore noninteresting regions. In this sense, ants do not move randomly like in SACA, but according to transition probabilities that depend on the spatial distribution of pheromone across the environment. If a particular cluster disappears, the pheromone tends to evaporate from that location. This approach is interesting, because pheromone represents the swarm memory and all ants can benefit from it. In other words, the ants share a common memory. Another important difference in relation to the SACA refers to the use of combinations of two independent response threshold functions; each associated with different environmental factors, namely, the number of objects in the neighborhood and their similarity. The ACLUSTER algorithm was also employed into a digital image retrieval problem, and further details about a case study within a granite database can be found in (Ramos et al., 2002). In a later work, Abraham and Ramos (2003) applied the ACLUSTER to discover Web usage patterns and thereafter a genetic programming approach to analyze the visitor trends. Handl and Meyer (2002) employed ant-based clustering as the core of a visual document retrieval system for worldwide web searches in which the basic goal is to classify online documents by contents’ similarity. The authors adopted an idea of short-term memory and employed ants with different speeds, also allowing them to jump. In addition, they introduced an adaptive scaling strategy, as well as some further modifications to achieve reliable results and to improve efficiency. The proposed method starts with a very fine distinction between data elements and reduces it only if necessary; that is, if after a pre-defined number of steps only few dropping or picking up occur. The authors also adopted a stagnation con-
152
Informatica 29 (2005) 143–154
trol similar to the one described in Monmarché et al. (1999), in which after a pre-defined number of unsuccessful dropping attempts an ant drops its load regardless of the neighborhood’s similarity. Finally, Handl and Meyer (2002) used eager ants, which take objects immediately after dropping their loads. Labroche et al. (2002) proposed a clustering algorithm, called ANTCLUST, based on a modeling of the chemical recognition system of ants. This system allows the construction of a colonial odor used for determining the ants’ nest membership, such that ants can discriminate between nest mates and intruders. In the ANTCLUST, each object is assigned to an artificial ant and represents part of the ant’s odor. At the beginning of the clustering process, ants are under the influence of any nest and consequently have no label (representative of the nest). Then, random meetings between ants are simulated and labels are updated according to behavioral rules, which take into account the similarity among data. These labels evolve over time until each ant has found its best nest, providing a partition of the objects. Kanade and Hall (2003) combined the ant based clustering algorithm proposed by Monmarché et al. (1999) with the classical Fuzzy C-Means algorithm (FCM) (Bezdek, 1981). The ant based clustering algorithm is employed to initially create raw clusters, which are then refined by the FCM algorithm. In this sense, the corresponding centroids of each initial cluster are taken as initial prototypes for the FCM. Then, each object is assigned to its best matching fuzzy cluster, i.e. the cluster it has the highest membership to. These new clusters can be moved and merged by the ants. Finally, the obtained clusters are also refined by the FCM. Handl et al. (2003) proposed a scheme that enables an unbiased interpretation of the clustering solutions obtained by ant based clustering algorithms. The authors argue that although many of the results obtained by ant algorithms look promising, there is a lack of knowledge about the actual performance of such algorithms, i.e. in general, the evaluation of the results has been performed by means of visual observation. In order to overcome this limitation, they propose a technique that allows converting the implicit clusters found by an ant algorithm into an explicit data partitioning. The proposed technique is based on the application of an agglomerative hierarchical clustering method to the positions of the data items on the grid. Taking into consideration the developed method, the results achieved by the ant-based clustering algorithm proposed by Handl and Meyer (2002) are compared, using both synthetic and real datasets, with those obtained by two classical algorithms (k-means and agglomerative average link), showing that the ant-based algorithm performs well when compared with them.
6
Conclusions and Future Work
The ant-clustering algorithm is a self-organizing multiagent system typically used for clustering unlabelled datasets. Its goal is to project the original data into a bidimensional output grid and position those items that are similar to each other in their original space of attributes
A.L. Vizine et al. in neighbor regions of the output grid. By doing this, the algorithm is capable of grouping together items that are similar to each other and presenting the result of this grouping process on a bi-dimensional display (2D grid) that can be easily inspected visually helping the user to deal with the overload of information. The advantage of visual data exploration is that the user is directly involved in the data mining process (Keim, 2002). This results in a device suitable for exploratory data analysis even when the input data set lies in a high-dimensional space. This paper provided a number of contributions to the field in two main frontlines. First, several modifications were introduced in the standard ant-clustering algorithm so as to enhance its performance and convergence properties. In particular, we proposed a cooling schedule for the parameter that controls the rate of picking up objects from the grid. This guarantees that the algorithm always stabilizes after a number of iteration steps. Furthermore, we developed the ideas of progressive vision (Sherafat et al., 2004a) and proposed a new form of implementing the pheromone heuristics on the grid in such a way that groups of data reinforce the attraction to those regions of the grid that contain data. The second contribution of this article was the presentation of a review from the literature citing and briefly describing most works and applications of ant clustering algorithms to date. The proposed adaptive algorithm, named A2CA, was applied to a number of benchmark data sets and to a real world bioinformatics data set. The obtained results were compared to the standard ant clustering algorithm with cooling schedule and modified dropping probability, and stress the benefits of the modifications introduced in the proposed algorithm. Most importantly, A2CA demonstrated a good robustness in terms of finding the correct number of clusters in the data set, low variations of the results in terms of number of clusters found, and always stabilized after a fixed number of iterations automatically defined by the algorithm. Despite the encouraging results presented here, there are still several avenues for investigation that deserve to be pursued. For instance, an automatic form of segmenting the output grid and counting the number of clusters found after convergence can be proposed; the algorithm can be transformed into a supervised algorithm, that is, information about a set of known classes of data can be used to aid the definition of the final configuration of the grid; a hierarchical analysis of the input data can be proposed by systematically varying some of the user-defined parameters; the use of heaps of objects instead of a oneobject-one-grid-position scheme used here can be performed (though we believe that the addition of pheromone to the grid may compensate for the effect of allowing heaps of objects to be formed); the use of local search procedures (e.g., k-means) to fine tune the clusters found by the ants; and a sensitivity analysis in relation to the user-defined parameters can be performed.
TOWARD IMPROVING CLUSTERING ANTS...
Acknowledgement The authors thank UniSantos, CNPq and FAPESP for the financial support.
References [1] Abraham, A., Ramos, V. (2003). Web Usage Mining Using Artificial Ant Colony Clustering and Genetic Programming. Proc. of the Congress on Evolutionary Computation (CEC 2003), Canberra, pp. 13841391, IEEE Press. [2] Bezdek, J.C., (1981). Pattern Recognition with Fuzzy Objective Function Algorithm, Plenum Press. [3] Bonabeau, E., Dorigo, M. and Théraulaz, G. (1999). Swarm Intelligence from Natural to Artificial Systems: Oxford University Press. [4] Camazine, S., Deneubourg, J.-L., Franks, N. R., Sneyd, J., Theraulaz, G. and Bonabeau, E. (2001). Self-Organization in Biological Systems: Princeton University Press. [5] de Castro, L. N. & Von Zuben, F. J. (2004), Recent Developments in Biologically Inspired Computing, Idea Group Inc. [6] Deneubourg, J. -L., Goss, S., Sendova-Franks, N., A., Detrain, C. and Chrétien, L. (1991). The Dynamics of Collective Sorting: Robot-Like Ant and AntLike Robot. In J. A. Meyer and S. W. Wilson (eds.). Simulation of Adaptive Behavior: From Animals to Animats: MIT Press/Bradford Books, 356-365. [7] Everitt, B.S., Landau, S., Leese, M., (2001). Cluster Analysis: Arnold Publishers, London. [8] Gutowitz, H. (1993). Complexity-Seeking Ants. Proceedings of the Third European Conference on Artificial Life. [9] Handl, J., Knowles, J., Dorigo, M. (2003). On the performance of ant-based clustering. Proc. of the 3rd International Conference on Hybrid Intelligent Systems, Design and Application of Hybrid Intelligent Systems, pp. 204-213, IOS Press. [10] Handl, J., Meyer, B. (2002). Improved Ant-Based Clustering and Sorting in a Document Retrieval Interface. In J.J. Merelo, J.L.F. Villacañas, H.G. Beyer, P. Adamis Eds.: Proceedings of the PPSN VII – 7th Int. Conf. on Parallel Problem Solving from Nature, Granada, Spain, Lecture Notes in Computer Science 2439, pp. 913-923, Springer-Verlag, Berlin. [11] Kanade, P., Hall, L.O. (2003). Fuzzy ants as a clustering concept. Proc. of the 22nd International Conference of the North American Fuzzy Information Processing Society (NAFIPS), pp. 227-232. [12] Kaufman, L., Rousseeuw, P.J. (1990), Finding Groups in Data – An Introduction to Cluster Analysis, Wiley Series in Probability and Mathematical Statistics, John Wiley & Sons Inc. [13] Keim, D.A. (2002), Information Visualization and Visual Data Mining: IEEE Transactions on Visuali-
Informatica 29 (2005) 143–154 153
zation and Computer Graphics, vol. 7, n.1, pp. 100107. [14] Kennedy, J., Eberhart, R. and Shi. Y. (2001). Swarm Intelligence: Morgan Kaufmann Publishers. [15] Labroche, N., Monmarché, N., Venturini, G. (2002). A new clustering algorithm based on the chemical recognition system of ants. Proc. of the 15th European Conference on Artificial Intelligence, France, pp. 345-349, IOS Press. [16] Lumer, E.D. and Faieta, B. (1994). Diversity and Adaptation in Populations of Clustering Ants. Proceedings of the Third International Conference On the Simulation of Adaptive Behavior: From Animals to Animats 3: MIT Press, 499-508. [17] Monmarché, N., Slimane, M., Venturini, G., (1999). On Improving Clustering in Numerical Databases with Artificial Ants. Advances in Artificial Life, D. Floreano, J.D. Nicoud, and F. Mondala Eds., Lecture Notes in Computer Science 1674, pp. 626-635, Springer-Verlag, Berlin. [18] Paton, R. (Ed.) (1994). Computing with Biological Metaphors: Chapman & Hall. [19] Ramos, V., Merelo, J.J.. (2002). Self-Organized Stigmergic Document Maps: Environment as a Mechanism for Context Learning. In E. Alba, F. Herrera, J.J. Merelo et al. Eds., AEB´2002, First Spanish Conference on Evolutionary and BioInspired Algorithms, 284-293, Spain. [20] Ramos, V., Muge, F., Pina, P. (2002). SelfOrganized Data and Image Retrieval as a Consequence of Inter-Dynamic Synergistic Relationships in Artificial Ant Colonies. In J. Ruiz-del-Solar, A. Abrahan and M. Köppen Eds., Soft-Computing Systems - Design, Management and Applications, Frontiers in Artificial Intelligence and Applications: IOS Press, v. 87, 500-509, Amsterdam. [21] Ritter, H. & Kohonen, T. (1989). Self-Organizing Semantic Maps. Biol. Cybern., 61, pp. 241-254. [22] Sherafat, V., de Castro, L. N. & Hruschka, E. R. (2004a). TermitAnt: An Ant Clustering Algorithm Improved by Ideas from Termite Colonies. In Proc. of ICONIP 2004, Special Session on Ant Colony and Multi-Agent Systems, Lecture Notes in Computer Science, v. 3316, pp. 1088-1093. [23] Sherafat, V., de Castro, L. N. & Hruschka, E. R. (2004b). The Influence of Pheromone and Adaptive Vision on the Standard Ant Clustering Algorithm. In: L. N. de Castro and F. J. Von Zuben, Recent Developments in Biologically Inspired Computing, Chapter IX, pp. 207-234. Idea Group Inc. [24] Vizine, A. L., de Castro, L. N., Gudwin, R. R. (2005). Text Document Classification using Swarm Intelligence. In Proc. of KIMAS 2005, CD ROM. [25] Yeung, K.Y., Medvedovic, M., Bumgarner, R.E. (2003), Clustering gene-expression data with repeated measurements, Genome Biology, v.4, issue 5, article R34.
154
Informatica 29 (2005) 143–154
A.L. Vizine et al.