ARM-v8 devices and 28nm FD-SOI STM test chips [5]. We combine the 28nm ... than the Cortex A9 while the Cortex A53 is only 1.08x faster than the Cortex A9.
Towards Near-Threshold Server Processors Ali Pahlevan∗ , Javier Picorel∗ , Arash Pourhabibi Zarandi∗ , Davide Rossi‡ , Marina Zapater∗§ , Andrea Bartolini†‡ , Pablo G. Del Valle∗ , David Atienza∗ , Luca Benini†‡ , Babak Falsafi∗ ∗ Ecole
Polytechnique F´ed´erale de Lausanne (EPFL), Switzerland Technische Hochschule Z¨urich (ETHZ), Switzerland ‡ University of Bologna, Italy § Complutense University of Madrid (UCM), Spain
† Eidgen¨ ossische
Abstract—The popularity of cloud computing has led to a dramatic increase in the number of data centers in the world. The ever-increasing computational demands along with the slowdown in technology scaling has ushered an era of power-limited servers. Techniques such as near-threshold computing (NTC) can be used to improve energy efficiency in the post-Dennard scaling era. This paper describes an architecture based on the FD-SOI process technology for near-threshold operation in servers. Our work explores the trade-offs in energy and performance when running a wide range of applications found in private and public clouds, ranging from traditional scale-out applications, such as web search or media streaming, to virtualized banking applications. Our study demonstrates the benefits of near-threshold operation and proposes several directions to synergistically increase the energy proportionality of a near-threshold server.
I. I NTRODUCTION The backbone of today’s Information Technology (IT) is large-scale datacenters that host a myriad of IT services, such as search and social connectivity, and operate under strict subsecond quality-of-service requirements. State-of-the-art datacenters deployed by IT giants, such a Microsoft and Google, host several thousands of servers, have huge acquisition costs ($100+ million), and have vast power footprints (5-20 MW). Datacenter energy footprint has been estimated to be at 1.3% of the global energy usage and to grow at 20% per year due to a rapid rate of deployment of new datacenters [1]. In a typical scale-out software architecture, requests are independently distributed across servers that do not share any state, and the performance characteristics of each server dictates the datacenter’s overall performance. In order to maximize the computation power of each server, processor and system vendors have turn to customized server architectures for datacenters, identifying and eliminating the bottlenecks in conventional server processors executing scale-out workloads. Unfortunately, technology scaling has started to lag behind. As we penetrate into the deep submicron era, successive technology generations have dramatically increased the chip’s power density due to the stagnant of supply voltages. This phenomenon, i.e., end of Dennard scaling, results in an underutilization of the available transistors on the chip, a trend which is expected to continue and escalate in the future. Low-voltage operation is a well-known technique to improve energy efficiency of digital computing devices, due to the quadratic dependency of the dynamic power with
the supply voltage [2]. In traditional fields of ultra-lowpower applications, Near-Threshold Computing (NTC) has been demonstrated to provide up to an order of magnitude of improvement in energy efficiency [3] at the cost of performance. Interestingly, none of the prior work has considered near-threshold operation for servers, due to the strict subsecond Quality of Service (QoS) requirements of scale-out workloads. In this paper, we propose an architecture for near-threshold server processors to cope with the computational demands of datacenter workloads, and show how energy efficiency can be greatly improved by reducing frequency while meeting the strict QoS requirements. Our contributions are as follows: • We present an architecture for near-threshold servers specially tailored to the execution of cloud computing applications, and propose accurate power models for the processor and the memory subsystem. • We derive the frequency setup that maximizes efficiency for a wide set of cloud workloads while meeting the strict QoS requirements needed for both private and public cloud scenarios, and show the efficiency tradeoffs in the context of a holistic server architecture, including the processor and memory. • We show how important energy savings can be achieved by using the FD-SOI technology when running both traditional virtualized applications and scale-out applications, by appropriately setting processor voltage and frequency. The remainder of this paper is organized as follows. In Sec. II, we describe the server architecture and power models. Sec. III describes the applications along with their features and describes the proposed scenarios. Sec. IV presents the experimental setup, whereas Sec. V draws the results. Finally, conclusions are drawn in Sec. VI. II. FD-SOI SERVER ARCHITECTURE A. Process Technology In this work, we exploit the capabilities of UTBB FD-SOI technology at low voltage to target near-threshold server application domain. With respect to traditional bulk technology, FD-SOI gives an increased voltage range and even higher performance for the same energy thanks to the better behavior of transistors at low voltage [4]. In addition, body biasing can
Bulk Vdd
Bulk Power
1.2
FD-SOI Vdd
FD-SOI Power
FD-SOI+FBB Vdd
FD-SOI+FBB Power
175 150 125 100 75 50 25 0
1 0.8 0.6 0.4 0.2 0
0
500
1,000
1,500
2,000
2,500
3,000
Power (Watt)
Vdd (v)
1.4
3,500
Core Frequency (MHz)
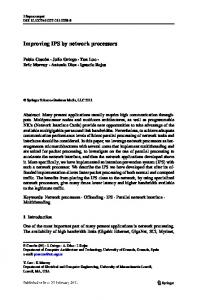
Fig. 1: A57 performance and power model in bulk, FD-SOI and FD-SOI+FBB.
give an extra edge. In FD-SOI back-bias voltage can be varied from -3V Reverse Body Biasing (RBB) using conventionalwell transistors up to +3V Forward Body Biasing (FBB) using flip-well transistors [5]. Applying such a strong bias has a significant impact on the leakage performance trade-off as the threshold voltage of transistors varies by 85mV when the bias voltage value is changed by 1V. In the context of near-threshold server applications, the described capabilities of UTBB FD-SOI technology can be exploited to: 1) Operate at the best energy efficiency point for a given performance target. By exploiting FBB, it is possible to reduce the supply voltage of a device to achieve the best energy point, at the cost of increased leakage, improving energy efficiency in dynamic-power dominated operating regions. 2) Manage spikes of computation. FBB allows to temporarily boost the operating frequency of processors. With respect to voltage scaling, forward body biasing allows to speed-up transitions between the normal and boost modes. For example, the back-bias voltage of a 5mm2 Cortex A9 processor can switch between 0V and 1.3V in less than 1µs [5]. 3) Achieve state-retentive leakage management. With RBB, we can temporarily enter low-leakage sleep mode, reducing leakage power by up to an order of magnitude [5]. With respect to traditional power gating techniques, body biasing allows faster transitions between the two modes, and is intrinsically state-retentive. 4) Manage variations. Part of the body bias range can be used to mitigate the effect of variations that are magnified in near-threshold operation, leaving the remaining part available for performance energy trade-off and power management [6]. The 28nm UTBB FD-SOI technology is currently produced by Samsung and ST Microelectronics, while the 20nm technology is under development by Global Foundries, where the production of this node is expected the second quarter of 2016. In the context of this work, we consider a flip-well (LVT) implementation of 28nm UTBB FD-SOI technology, able to provide higher frequencies than the conventional-well flavor, and featuring FBB in the range 0V-3V, suitable for high-performance applications.
B. Server Architecture We model chips with an area of 300mm2 , and a power budget of 100W. The cores are modeled after Cortex-A57, a 3-way Out-of-Order (OoO) core, resembling those used in specialized many-cores for servers [7], [8]. Following the scale-out processor methodology [9], the chip is organized as a set of clusters, which exhibit an optimal ratio between core count and cache size. Although we calculate the optimal ratio as a 16-core cluster with a 4MB Last-Level Cache (LLC), we model 4-core clusters due to a lower simulation turnaround time. We verify that the cluster’s core count does not affect the trends of results presented in the paper. Each cluster features a cache-coherent crossbar interconnect and runs its own OS image. Besides the cores, caches, and interconnects, the chip features a set of I/O peripherals along the chip’s edge, which are modeled using McPAT [10] following a Sun UltraSparc T2 configuration. The processor comprises four DDR4 memory channels clocked at 1600MHz with a peak bandwidth of 25.6GB/s per channel. We model 4 ranks per channel and 8x 4Gbit DRAM chips following Micron’s specifications [11]. Therefore, the server’s total memory capacity is 64GB. C. Power models 1) Cores: To evaluate the performance and energyefficiency of the presented server platform, we extract a performance and power model from state-of-the-art manufactured ARM-v8 devices and 28nm FD-SOI STM test chips [5]. We combine the 28nm FD-SOI power and performance model of a recent Cortex A9 implementation of STM in 28nm bulk and FD-SOI, considering the differences in pipeline length ratio and critical path between Cortex A57 and Cortex A9. These parameters are extracted by comparing the different voltage to frequency ratio present in the Samsung Exynos processor family. The frequency/voltage information can be extracted from the Linux CPUFreq drivers. We observe that on average the Cortex A57 is 1.17x faster (higher-frequency) than the Cortex A9 while the Cortex A53 is only 1.08x faster than the Cortex A9. We combine this information with the active and static energy per clock cycle at the different DVFS levels from the Samsung Exynos 5433 processors to scale its energy figures to the STM 28nm bulk and FD-SOI technology
TABLE I: Power of an 8x 4Gbit DDR4 chip at 1.6GHz EIDLE [nJ/cycle]
EREAD [nJ/byte]
EW RIT E [nJ/byte]
0.0728
0.2566
0.2495
by using the trends reported in [5]. Then, we extend the performance and power model to the NTC region fitting a template extracted from measurements of a 28nm UTBB FDSOI near-threshold parallel processor [6]. The non-filled marked lines of Figure 1 show the voltage level required at each frequency for each technology. We see that the use of the FD-SOI technology increases the frequency w.r.t. pure bulk, moreover the body-bias (FD-SOI FBB) can be used to increase the maximum speed at fixed voltage. While pure bulk A57 has timing issues when operating in the low voltage region (0.5V), the FD-SOI implementation reaches almost 100MHz, which increases to more than 500MHz with forward body-bias. The filled marked lines in Figure 1 show that FD-SOI by itself leads to a significant reduction in the power consumption at the same frequency w.r.t bulk silicon. Moreover, FBB further increases power savings. This power gain increases as the voltage supply reduces, producing the maximum benefits in the near-threshold operating region. 2) Uncore: The LLC and interconnect of each cluster, and the I/O peripherals of the processor die, are the uncore components. We use CACTI to estimate the LLC energy and to account for cutting-edge leakage reduction techniques [12], [13]. A 1MB slice of the LLC dissipates power in the order of 500mW, mostly due to leakage. Additionally, we estimate the energy consumed by the on-chip network links and switch fabrics based on prior work [14], consuming 25mW for a crossbar. We use McPAT [10] to calculate the power consumption of all the I/O peripherals of the server die, resulting in 5W. We assume that the LLC, crossbar, and peripherals are on a different voltage/clock domain from the core, and therefore their static and dynamic power consumption is not affected by the cores voltage/frequency point. 3) Memory: We estimate DDR4 background power and energy per operation based on Micron models and specifications [11], [15]. Table I shows the power consumption of an 8x 4Gbit DRAM chip. Note that in order to calculate the total power consumption, we scale these numbers to match the number of ranks in the system and the application’s memory bandwidth consumption. III. D ESIGN SPACE EXPLORATION A. Application description 1) Scale-out applications: As a representative set of emerging scale-out server applications, we use the CloudSuite benchmark suite [16]. The selected benchmarks are Data Serving, a NoSQL data store, Web Search, a web search engine application, Web Serving, a modern web server serving dynamic content, and Media Streaming, a streaming service for sharing media content.
2) Virtualized applications: For virtualized applications, we use synthetic workloads representative of managed hosting and business computation for banking applications. These VMs perform batch financial analysis, mainly based on matrix multiplication and manipulation, and both their CPU and memory utilization can be tuned. To consider representative values for memory usage, we use a dataset from Bitbrains [17] containing the performance traces of 1750 VMs. Based on this traces, we obtain statistics about memory utilization. In order to run the experiments in work-case scenarios, we tune the workloads to maximize CPU utilization. B. Deployment environments 1) Private cloud: Cloud operators rely on private clouds to deliver a wide range of scalable online services, such as search and social connectivity. State-of-the-art data centers deployed by IT giants, such as Google and Microsoft, operate under strict sub-second QoS requirements. Conventional techniques to increase server efficiency, such as server consolidation and batching, which consolidates the load into a fraction of servers, and delays requests to induct long periods of idleness, respectively, are not possible. Additionally, co-scheduling several applications on the same server to utilize spare processing power is also not an option. The reason is that the state of these applications greatly exceeds the capacity of a small fraction of the servers, and delaying requests for hundreds of milliseconds to achieve deep sleep modes results in QoS violations [18], [19]. Furthermore, co-scheduling workloads on the same server is often not possible as these applications utilize most of the memory and any interference can lead to unacceptable degradations in QoS [20], [21]. 2) Public cloud: The second environment considers a public cloud, such as Amazon Web Services or Google Cloud Platform, offering services that range from traditional virtualized applications, to scale-out applications, with relaxed QoS constraints. As a result of the analysis over the Bitbrains traces, we use two types of VMs representative of banking traces: i) low-memory utilization VMs with 100MB memory provisioning (namely VMs low-mem), and ii) high memory utilization VMs with 700MB provisioning (namely VMs highmem). Note that the QoS requirements vary between the scaleout applications and the VMs. For scale-out applications, the tail latency (i.e., 95-th or 99-th percentile latency) imposes the minimum QoS. In contrast, the proposed VMs run batch tasks without user interaction. Hence, we define the QoS requirement to be the maximum degradation in the execution time of a batch task. According to our industrial partners, the minimum degradation observed in their production data centers is 2x, while the maximum degradation can reach values as high as 4x [22]. IV. E XPERIMENTAL SETUP Following the processor organization described in Section II, the server die can accommodate 9 clusters before hitting the area limit. Each cluster contains 4 Cortex A57, 3-way OoO, with an instruction window of 128 instructions.
Normalized 99-th latency
2 1.5
Data Serving
Web Search
Web Serving
Media Streaming
QoS limit
1 0.5 0 0
0.5
1
1.5
2
Core Frequency (GHz)
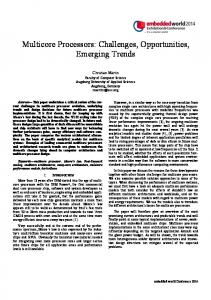
Fig. 2: 99-th percentile latency normalized to the QoS. Each core integrates a 32KB 2-way L1-I and L1-D cache. Each cluster hosts a unified 4MB 16-way LLC with 4 banks. The cores and the LLC banks are interconnected through a crossbar. The chip features a total of 36 cores and uses the 28nm FD-SOI process technology. For our experiments, we use the Flexus full-system cycleaccurate simulation infrastructure [23]. Flexus models the SPARCv9 ISA and runs an unmodified Solaris 10 operating system. Flexus extends the Simics functional simulator with timing models of out-of-order cores, caches, on-chip protocol controllers and interconnects, and DRAM. DRAM is modeled by integrating DRAMSim2 [24] directly into Flexus. We configure DRAMSim2 following Micron’s DDR4 specifications [11]. We evaluate this work using contemporary server applications taken from CloudSuite [16]. To enable virtualization in Solaris 10, we employ Solaris containers (a.k.a., Solaris Zones), which are integrated with the operating system. We run one Solaris container instance on each of the cores of the cluster. Each container runs one instance of a synthetic banking application, that is tuned to obtain various CPU and memory stress levels for the containers. To accelerate simulations, we employ the SMARTS sampling methodology [25]. Our samples are drawn over an interval of 10 seconds of simulated time. For each measurement, we launch simulations from checkpoints with warmed caches and branch predictors, and run 100K cycles (2M cycles for Data Serving) to achieve a steady state of detailed cycleaccurate simulation prior to collecting measurements for the subsequent 50K cycles (400K for Data Serving). To measure performance, we use the ratio of the aggregated number of application instructions committed to the total number of cycles (including cycles spent executing operating system code); this metric, user instructions per cycle (UIPC), or user instructions per second (UIPS), has been shown to reflect system throughput [23]. Performance is measured at a 95% confidence level and an average error below 2%. V. R ESULTS A. Quality-of-Service We have shown that NTC allows to operate in a wide range of voltage and frequency points to improve energy
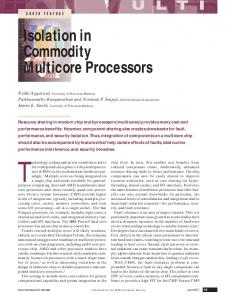
efficiency. However, the strict QoS requirements of scale-out applications, in the order of milliseconds, makes it unclear whether this technology is suitable for server processors. In order to understand the effects of the voltage/frequency points on the latency of a request, we run CloudSuite benchmarks on real hardware, Intel Core i7-4785T [26] set at 2GHz, in a nearzero contention configuration, to calculate the minimum 99th percentile latency [27]. Then, we simulate the CloudSuite applications in Flexus for different frequency points ranging from 2GHz down to 100MHz, and observe the effect of the frequency on the application’s throughput, dictated by the UIPS of the simulation. Last, we scale the calculated latencies accordingly. This methodology is correct because the number of user instructions executed per request remains constant across any contention point [23]. Figure 2 shows how the latency of a request scales with the frequency. The results are normalized to the QoS requirement of the applications. We estimate the QoS requirements based on public sources [27], [28], assuming them to be 20ms, 200ms, 200ms, and 100ms, for Data Serving, Web Search, Web Serving, and Media Streaming respectively. As shown in the figure, the applications are able to operate at very low frequency points (200MHz-500MHz) without violating the QoS requirements. For the virtualized applications, instead of obtaining the minimum latency, we compute the performance degradation of the workloads taking as a baseline the 2GHz frequency, i.e., we compute the increase in execution time as frequency decreases. By assuming the maximum boundary of 4x degradation proposed in Sec. III, frequency can be decreased down to 500MHz. Even by limiting the maximum degradation to 2x, frequency could still be reduced to 1GHz. In conclusion, we are able to significantly reduce the frequency of the cores while meeting the strict latency requirements of scale-out applications and complying with acceptable degradation for virtualized applications. B. Energy Efficiency 1) Cores: To understand the efficiency benefits of reducing the voltage/frequency points, we plot, in Figure 3a, the total number of UIPS at the chip level divided by the total power consumption of the A57 cores. As expected, due to the cubic relation between frequency and power, and the linear relation between throughput and frequency, the lower the frequency, the higher the energy efficiency. However, there is a voltage point, 0.5v, where cores become non-functional due to the L1 cache, before entering a low-frequency region where leakage brings efficiency down. In conclusion, the most energy-efficient design is the one that operates at the lowest voltage/frequency point. Hence, in the context of scale-out applications, the QoS requirements dictate this operating point, which ranges 200MHz-500MHz. Maximum energy-efficiency at low power operating point has the advantage of reducing the overall system Thermal Design Power (TDP)—easing the thermal design and dark-silicon effects. For the virtualized applications, we observe the same trend, Figure 4a, for both
Efficiency
(a) Cores
(b) SoC
(c) Server
48
1.6
1.6
36
1.2
1.2
24
0.8
0.8
12
0.4
0.4
0
0
0 0
0.5
1
1.5
2
0
Core Frequency (GHz)
0.5
1
1.5
2
Core Frequency (GHz) Data Serving
Web Search
Web Serving
0
0.5
1
1.5
2
Core Frequency (GHz) Media Streaming
Fig. 3: Efficiency of the cores, SoC, and server calculated as UIPS/Watt as the core frequency varies for the scale-out workloads.
the high-memory and the low-memory VMs. As can be seen, the UIPS of VMs high-mem is higher than VMs low-mem, as apart from increasing memory usage VMs high-mem also increase CPU boundness when compared to VMs low-mem. Depending on the limit imposed to degradation (i.e., 2x or 4x) best frequency ranges from 500MHz to 1GHz. 2) SoC: Previously, we have considered core power to compute efficiency. However, there are other components in the processor die, i.e., SoC, that dissipate power. Each cluster has a LLC and a crossbar interconnect that operate at a different voltage/frequency point than that of the cores. Additionally, there is a set of I/O peripherals along the chip’s edge that consume power regardless of the state of the cores. Figure 3b, considers UIPS at the chip level, divided by the total power consumption of the SoC, for scale-out applications, whereas Figure 4b, reports the same metric for VMs. As we can see, the most efficient energy point is not the lowest core frequency. The reason is that there is a point at which the reduction in throughput is not compensated by the power reduction in the cores, as the power of the remaining chip components dominate. This constant power at the chip level pushes the most energy efficient point to 1GHz of core frequency. 3) Server: Besides the processor, the memory subsystem is an important contributor to overall server power [29]. Although the dynamic power consumption of the memory scales with the frequency of the cores, as the cores issue fewer references per unit of time, the background power consumption remains constant. Figure 3c, considers UIPS at the chip level, divided by the total power consumption of the server, which considers the power of the SoC and the memory subsystem for the scale-out applications. As expected, the optimal efficiency point moves to the right to around 1.2GHz. For virtualized applications, the same trend can be observed in Figure 4c, reaching its peak at the same frequency point (1GHz). In both scenarios, the optimal efficiency point moves further to the right as other system components, which are not energy proportional, are taken into account. Overall, the aforesaid results, Figures 3 and 4, show significant potential for the NTC process technology for servers. However, in order to achieve significant improvements in energy efficiency, not only the cores, but also the rest of the
components of the processor, and all the server components of the system need to be energy proportional [30]. C. Discussion The results shown in the paper unveil some interesting trade-offs to increase the energy efficiency of servers. First, server workloads tolerate low core frequency, enabling nearthreshold operating voltage. However, not all SoC components scale with the core voltage, shifting the most energyefficient point to a higher frequency, i.e., 1GHz. Hence, there are interesting challenges and opportunities to increase the energy-efficiency at the SoC level, by making the uncore components and DRAM more energy proportional, instead of optimizing the design for the TDP. More specifically, when operating at near-threshold operation, the server is still energybound instead of power/thermal bound. While power/thermal bound is fundamental and can be addressed with cuttingedge cooling technology, energy optimizations can be achieved at the circuit, architecture, and control level. In this perspective, FD-SOI provides effective knobs to improve energy proportionality using BB to reduce leakage, or alternatively to provide local boost in a very fine-grained and reactive fashion. Additionally, this technology is applicable not only for the cores, but also for the uncore components. Additionally, and as seen in the paper, the background power of the memory dominates the total server power as the power consumption of the SoC decreases. Therefore, memory technologies that exhibit lower background power than DDR4, such as mobile DRAM (LPDDR4), could be used to increase the energy proportionality of the servers [31]. Finally, given that the core frequency can be greatly reduced, application consolidation should be possible in these scenarios. Specially, under the more relaxed latency constraints of the public cloud environments, where servers are usually oversubscribed, the optimal energy efficiency point could be adjusted to accommodate more workloads on the same server. Our work opens new research challenges on the area of workload co-allocation, which will be tackled in the future. VI. C ONCLUSIONS As Moore’s law continues to integrate more transistors on a chip, the end of Dennard scaling is unveiling an era of power-
Efficiency
(a) Cores
(b) SoC
(c) Server
48
1.6
1.6
36
1.2
1.2
24
0.8
0.8
12
0.4
0.4
0
0
0 0
0.5
1
1.5
2
Core Frequency (GHz)
0
0.5
1
1.5
2
Core Frequency (GHz) VMs low-mem
0
0.5
1
1.5
2
Core Frequency (GHz)
VMs high-mem
Fig. 4: Efficiency of the cores, SoC, and server calculated as UIPS/Watt as the core frequency varies for the virtualized apps.
limited chips. Near-threshold computing is a well-known voltage-scaling technique to reduce the energy consumption of the transistors. In this work, we shed light on NTC in the context of server processors, demonstrating that significant improvements in energy efficiency can be achieved, while meeting the strict QoS requirements of scale-out workloads. Additionally, we show that in order to substantially increase the energy efficiency of a server, all the server components of the system, not only the cores, need to be energy proportional. ACKNOWLEDGMENTS This work has been partially supported by the YINS RTD project (no. 20NA21 150939), funded by Nano-Tera.ch with Swiss Confederation Financing and scientifically evaluated by SNSF, the EC FP7 GreenDataNet STREP project (Agreement No. 609000), the EuroLab-4-HPC project, the FP7 ERC Advance project MULTITHERMAN (g.a. 291125), the H2020 FETHPC ExaNoDe (g.a. 671578), a research scholarship by Universidad Polit´ecnica de Madrid, and by the Spanish Ministry of Economy and Competitiveness, under contract TEC2012-33892. R EFERENCES [1] J. Koomey, “Growth in data center electricity use 2005 to 2010,” Analytics Press, Oakland, CA, Tech. Rep., 2011. [2] R. Dreslinski, M. Wieckowski, D. Blaauw, D. Sylvester, and T. Mudge, “Near-threshold computing: Reclaiming moore’s law through energy efficient integrated circuits,” Proceedings of the IEEE, vol. 98, no. 2, pp. 253–266, 2010. [3] Markovic et al., “Ultralow-power design in near-threshold region,” Proceedings of the IEEE, 2010. [4] N. Planes et al., “28nm fdsoi technology platform for high-speed lowvoltage digital applications,” in IEEE VLSIT, 2012. [5] D. Jacquet et al., “A 3 ghz dual core processor ARM cortex TM -a9 in 28 nm UTBB FD-SOI CMOS with ultra-wide voltage range and energy efficiency optimization,” J. Solid-State Circuits, 2014. [6] D. Rossi et al., “A 60 gops/w, -1.8 v to 0.9 v body bias ULP cluster in 28 nm UTBB fd-soi technology,” Solid-State Electronics, 2015. [7] M. Ferdman, A. Adileh, Y. O. Koc¸berber, S. Volos, M. Alisafaee, D. Jevdjic, C. Kaynak, A. D. Popescu, A. Ailamaki, and B. Falsafi, “A case for specialized processors for scale-out workloads,” IEEE Micro, vol. 34, no. 3, pp. 31–42, 2014. [8] L. Gwennap, “Thunderx rattles server market,” Microprocessor Report, vol. 29, no. 6, pp. 1–4, 2014. [9] P. Lotfi-Kamran et al., “Scale-out processors,” in ACM/IEEE ISCA, 2012.
[10] S. Li et al., “McPAT: an integrated power, area, and timing modeling framework for multicore and manycore architectures,” in IEEE/ACM MICRO, 2009. [11] Micron, “4Gb: x4, x8, x16 DDR4 SDRAM features,” https://www.micron.com/∼/media/documents/products/data-sheet/ dram/ddr4/4gb ddr4 sdram.pdf. [12] S. Li et al., “CACTI-P: architecture-level modeling for sram-based structures with advanced leakage reduction techniques,” in IEEE/ACM ICCAD, 2011. [13] N. Muralimanohar et al., “Optimizing NUCA organizations and wiring alternatives for large caches with CACTI 6.0,” in IEEE/ACM MICRO, 2007. [14] S. Volos et al., “Bump: Bulk memory access prediction and streaming,” in IEEE/ACM MICRO, 2014. [15] Micron, “DDR4 SDRAM system-power calculator,” https: //www.micron.com/∼/media/documents/products/power-calculator/ ddr4 power calc.xlsm. [16] M. Ferdman et al., “Clearing the clouds: a study of emerging scale-out workloads on modern hardware,” in ACM ASPLOS, 2012. [17] S. Shen, V. van Beek, and A. Iosup, “Statistical characterization of business-critical workloads hosted in cloud datacenters,” in IEEE/ACM CCGrid, 2015. [18] D. Lo et al., “Towards energy proportionality for large-scale latencycritical workloads,” in ACM/IEEE ISCA, 2014. [19] D. Meisner et al., “Power management of online data-intensive services,” in ACM/IEEE ISCA, 2011. [20] V. D. Jerger, N.E. and M. Lipasti, “An evaluation of server consolidation workloads for multi-core designs,” in IISWC, 2007. [21] J. Mars et al., “Bubble-Up: increasing utilization in modern warehouse scale computers via sensible co-locations,” in IEEE/ACM MICRO, 2011. [22] C. K. Christina Delimitro, “Optimizing resource provisioning in shared cloud systems,” Standford University, Tech. Rep., 2014. [23] T. F. Wenisch, R. E. Wunderlich, M. Ferdman, A. Ailamaki, B. Falsafi, and J. C. Hoe, “Simflex: Statistical sampling of computer system simulation,” IEEE Micro, vol. 26, no. 4, pp. 18–31, 2006. [24] E. C. Paul Rosenfeld and B. Jacob, “DRAMSim2: A cycle accurate memory system simulator,” Computer Architecture Letters, 2011. [25] R. E. Wunderlich et al., “SMARTS: accelerating microarchitecture simulation via rigorous statistical sampling,” in ACM/IEEE ISCA, 2003. [26] “Intel Core i7-4785T Processor (8M Cache, up to 3.20 Ghz) Specifications,” http://ark.intel.com/products/80814. [27] J. Dean and L. A. Barroso, “The tail at scale,” Communications of the ACM, 2013. [28] B. F. Cooper et al., “Benchmarking cloud serving systems with ycsb,” in ACM SoCC, 2010. [29] L. A. Barroso, J. Clidaras, and U. H¨olzle, The Datacenter as a Computer: An Introduction to the Design of Warehouse-Scale Machines, Second Edition, ser. Synthesis Lectures on Computer Architecture. Morgan & Claypool Publishers, 2013. [30] L. A. Barroso and U. H¨olzle, “The case for energy-proportional computing,” IEEE Computer, vol. 40, no. 12, pp. 33–37, 2007. [31] K. T. Malladi et al., “Towards energy-proportional datacenter memory with mobile DRAM,” in ACM/IEEE ISCA, 2012.