AppDynamics APM [1]âAppDynamics was tested using the trial version. ⢠CA APM Solution [2]âThe licensed version of the tool was used to export the traces.
Towards Performance Tooling Interoperability: An Open Format for Representing Execution Traces Duˇsan Okanovi´c1 , Andr´e van Hoorn1 , Christoph Heger2 , Alexander Wert2 , and Stefan Siegl2 1
Univ. of Stuttgart, Inst. of Software Technology, Reliable Software Systems, GER {dusan.okanovic,van.hoorn}@informatik.uni-stuttgart.de 2 NovaTec Consulting GmbH, CA Application Performance Management, GER {christoph.heger,alexander.wert,stefan.siegl}@novatec-gmbh.de
Abstract. Execution traces capture information on a software system’s runtime behavior, including data on system-internal software control flows, performance, as well as request parameters and values. In research and industrial practice, execution traces serve as an important basis for model-based and measurement-based performance evaluation, e.g., for application performance monitoring (APM), extraction of descriptive and prescriptive models, as well as problem detection and diagnosis. A number of commercial and open-source APM tools that allow the capturing of execution traces within distributed software systems is available. However, each of the tools uses its own (proprietary) format, which means that each approach building on execution trace data is tool-specific. In this paper, we propose the Open Execution Trace Exchange (OPEN.xtrace) format to enable data interoperability and exchange between APM tools and software performance engineering (SPE) approaches. Particularly, this enables SPE researchers to develop their approaches in a tool-agnostic and comparable manner. OPEN.xtrace is a community effort as part of the overall goal to increase interoperability of SPE/APM techniques and tools. In addition to describing the OPEN.xtrace format and its tooling support, we evaluate OPEN.xtrace by comparing its modeling capabilities with the information that is available in leading APM tools.
1
Introduction
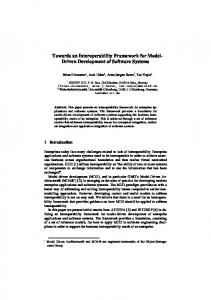
Dynamic program analysis aims to get insights from a software system based on runtime data collected during its execution [12]. An important data structure used for dynamic program analysis is the execution trace. In its simplest form, an execution trace captures the control flow of method executions for a request served by the system. It can be represented by a dynamic call tree as depicted in Figure 1a [8]. In the example, the method doGet(..) is the entry point to the processing of a request. The method doGet(..) calls the doFilter(..) method, which then calls doSearch(..), etc. The order and nesting of method executions can be obtained by performing a depth-first traversal of the dynamic call tree.
To appear in Proceedings of the 13th European Workshop on Performance Engineering (EPEW '16). The final publication will be available at Springer via http://link.springer.com/
2
D. Okanovi´c, A. van Hoorn, C. Heger, A. Wert, and S. Siegl doGet(..) doFilter(..) doSearch(..) getData(..)
processData(..)
renderData(..)
executeQuery(..)
(a) classic tree representation doGet(..) - foo.bar.EntryServlet [JVM1@srv1] 0.2 sec doFilter(..) - foo.bar.SomeFilter 0.2 sec doSearch(..) - foo.bar.FullSearchAction 0.15 sec getData(..) - foo.bar.LoadAction [HotSpot1@srv2] 0.13 sec executeQuery(..) - org.h2.jdbc.PreparedStatement 0.13 sec processData(..) - foo.bar.ProcessAction [HotSpot1@srv2] 0.03 sec renderData(..) - foo.bar.RenderAction [HotSpot1@srv2] 0.01 sec
(b) profiler view
Fig. 1: Example trace
The collection of execution traces is one of the basic features expected from application performance monitoring (APM) tools. For instance, it is required to fulfill at least the following three dimensions of APM functionality as defined by Kowall and Cappelli [23]: i.) application topology discovery and visualization, ii.) user-defined transaction profiling, and iii.) application component deep dive. And indeed, the common commercial [1, 2, 3, 6, 7, 23] and open-source [18, 25] APM tools do support this feature — based on application instrumentation, stack trace sampling, or a mixture of both. It needs to be emphasized that a lot more information than needed for reconstructing dynamic call trees is collected. For instance, the data may include information on timing (e.g., response times, CPU times), variables (HTTP request parameters, SQL queries), or error information (HTTP status code, Java exceptions). Figure 1b shows a simplified profiler-like view on the execution trace from Figure 1a, including location information and method response times, as provided by most APM tools. However, the type of data and the representation format differ greatly among the different APM tools. In addition to the aforementioned three APM dimensions, execution traces provide the data set for various further software performance engineering (SPE) activities. For instance, researchers have proposed approaches for extracting and visualizing performance models [11, 16, 19], as well as detecting and diagnosing performance problems [17, 21, 26, 27]. Unfortunately, the existing approaches are tailored to the execution trace representations of specific APM tools or custom-made monitoring and tracing implementations. To summarize, the efficient capturing of detailed execution trace data from software systems during development and operations is widely supported by different APM tools. However, due to diverse and proprietary data formats, approaches building on execution trace data are usually tool-specific. To overcome this limitation, we propose the Open Execution Trace Exchange (OPEN.xtrace) format, serving as an open interchange format for representing
APM Interoperability: An Open Format for Representing Execution Traces
3
execution traces provided by different APM tools. The format is accompanied by extensible tooling support to instantiate and serialize the OPEN.xtrace data, and to import and export OPEN.xtrace data from/to the data format of leading APM tools. Under the umbrella of the Standard Performance Evaluation Corporation’s Research Group (SPEC RG), OPEN.xtrace is developed as an ongoing community effort among APM/SPE researchers and industry practitioners as a part of the overall goal to increase the interoperability among tools and approaches in this field [28]. The idea of a common format for execution traces goes in line with related community efforts to increase interoperability and usability [30], e.g., for performance [13, 24, 31] and workload [29] models. The contribution of this paper is the presentation of the OPEN.xtrace format, its tooling support, and the evaluation that analyzes the format’s completeness by comparing the provided data with the data available in leading commercial and open-source APM tools. It needs to be emphasized that OPEN.xtrace is a work in progress and that this paper presents the current state. The remainder of this paper is organized as follows. Section 2 provides an overview of related work. Section 3 describes the OPEN.xtrace format and its tooling support. Section 4 includes the comparison with APM tools. In Section 5, we draw the conclusions and outline future work. Supplementary material for this paper, including the OPEN.xtrace software and the detailed data supporting the evaluation, is available online [28].
2
Related work
Related works can be grouped into i.) interoperability and exchange formats in software, service, and systems engineering in general, ii.) concrete efforts in this direction in performance engineering in particular, as well as into iii.) formats for representing trace data. The idea of having standardized common data formats is not new and not limited to the representation of execution traces. Various efforts in software, service, and systems engineering to provide abstract data models and modeling languages (meta-models) for concrete problems have been proposed and are used in research and practice. Selected examples include TOSCA for representing cloud deployments [9], CIM as an information model for corporate IT landscapes [14], and the NCSA Common Log Format supported by common web and application servers [5]. A well-defined data model (modeling language) comprises an abstract syntax, semantics, and one or more (textual, visual, or a combination of both) concrete syntax [10]. The syntax is commonly based on meta-models, grammars, or schemas (object-relational, XML, etc). Data models have proven to be most successful if they are developed and maintained by consortia of academic and industrial partners, such as DMTF,3 OASIS,4 OMG,5 or W3C.6 For this reason, 3 4 5 6
https://www.dmtf.org/standards http://www.oasis-open.org/standards http://www.omg.org/spec/ http://www.w3.org/TR/
4
D. Okanovi´c, A. van Hoorn, C. Heger, A. Wert, and S. Siegl
OPEN.xtrace is being developed as an open community effort driven by SPEC RG from the very beginning. For workload and performance models, researchers have proposed a couple of intermediate or interchange formats to reduce the number of required transformations between architectural and analytical performance models and tools. KLAPER [13] and CSM (Core Scenario Model) [31] focus on a scenario-based abstraction for performance models, and transformations from/to software design models (e.g., UML SP/MARTE) and analytical models such as (layered) queuing networks are available. Similarly, PMIF (and extended versions of it) [24] focuses on queueing models. WESSBAS [29] is a modeling language for session-based workloads, supporting transformations to different load generators and performance prediction tools. Few works exist on data formats for execution traces. Kn¨ upfer et al. [22] propose the Open Trace Format (OTF). It is suited for high performance computing, where the most important issues are overhead in both storage space and processing time, and scalability. Although similar in name to our format, OTF is not focused on execution traces, but on collections of arbitrary system events. Similar to OTF, the OpenTracing project provides an API for logging events on different platforms. Unlike OPEN.xtrace, OpenTracing7 focuses on so-called spans, i.e., logical units of work—not actual method executions. The Common Base Event format (CBE) was created as a part of IBM’s Common Event Infrastructure, a unified set of APIs and infrastructure for standardized event management and data exchange between content manager systems [20]. CBE stores data in XML files. Application Response Measurement (ARM) [15] is an API to measure end-to-end transaction-level performance metrics, such as response times. Transaction-internal control flow is not captured and a data model is not provided. To summarize, there is no open and common format for representing execution traces. The existing formats either represent high-level events or are tailored to specific tools. Section 4 will provide details on execution trace data and representation formats of selected APM tools.
3
OPEN.XTRACE
In Section 3.1, we provide an example to introduce additional concepts and terminology. In Section 3.2, the main components of OPEN.xtrace’s data model are described in form of a meta-model [10]. In Section 3.3, the OPEN.xtrace instance of the example trace is presented. Section 3.4 presents the tooling support. 3.1
Example and terminology
The example execution trace shown in Figure 2, which extends the trace from Figure 1, results from a HTTP request to a distributed Java enterprise application, whose execution spans over multiple network nodes. 7
http://opentracing.io/
APM Interoperability: An Open Format for Representing Execution Traces 1 2 3 4 5 6 7 8 9 10 11 12 13 14 15
5
doGet (..) - foo . bar . EntryServlet ... JVM1@srv1 doFilter (..) - foo . bar . SomeFilter doSearch (..) - foo . bar . FullSearchAction getData (..) - foo . bar . LoadAction ... HotSpot1@srv2 log (..) - foo . bar . Logger loadData (..) - foo . bar . LoadAction list (..) - foo . bar . ListAction executeQuery (..) - org . h2 . jdbc . PreparedStatement executeQuery (..) - org . h2 . jdbc . PreparedStatement executeQuery (..) - org . h2 . jdbc . PreparedStatement processData (..) - foo . bar . ProcessAction ... JVM1@srv1 processSingle (..) - foo . bar . ProcessAction processSingle (..) - foo . bar . ProcessAction processSingle (..) - foo . bar . ProcessAction renderData (..) - foo . bar . RenderAction
Fig. 2: Sample trace (textual representation)
The trace starts with the execution of the EntryServlet.doGet() method in the virtual machine JVM1 on the node srv1 (line 1). After the initial processing on this node, the execution moves to the node srv2 (line 4). On this node, after logging an event (line 5), data is fetched from a database by performing several database calls (lines 8–10). Since the database is not instrumented, there are no executions recorded on the node hosting it. After these calls, the execution returns to srv1 (line 11), where the final processing is performed and the execution ends. The complete list and structure of method executions to process the client request is denoted as a trace. A part of the trace that is executed on a certain location is called a subtrace. Locations can be identified with server addresses or names, virtual machine names, etc. Each execution within a trace is called callable. This example shows several kinds of executions: method-to-method call (e.g., line 2), move of the execution to a different node (e.g., line 4), logging call (line 5), call to a database (e.g., line 9), and HTTP call (line 1). A trace contains subtraces and has one subtrace—the one where the execution starts—that acts as a root. Each subtrace can have child subtraces, and it acts as a parent to them. Also, subtraces contain callables, with one callable—the entry point of that subtrace—acting as a root. Callables that can call other callables, e.g., method-to-method calls and remote calls, are called nesting callables. Additionally, each of these entities contains performance-relevant information such as timestamps, response times, and CPU times, which will be detailed in the next section. 3.2
Meta-model
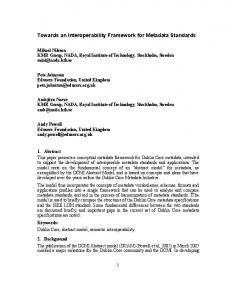
The core meta-classes of the OPEN.xtrace model are presented in Figure 3.
6
D. Okanovi´c, A. van Hoorn, C. Heger, A. Wert, and S. Siegl TimedElement -responseTime : long -exclusiveTime : long subTraces 0..*
parent 0..1 SubTrace -id : long 1 root
Trace -traceId : long
1 containingTrace
Callable -labels : List -timestamp : long
1 root
Location -host : String -runtimeEnvironment : String -application : String -businessTransaction : String -nodeType : String 1
location
1 containingSubTrace GenericKeyValuePair -key : String -value : String
AdditionalInformation 0..* -name : String additionalInformation
Fig. 3: Trace, SubTrace, Callable and Location
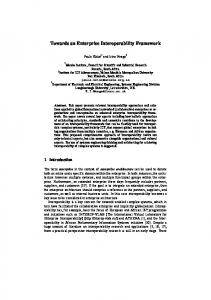
Trace is the container entity that encapsulates an entire execution trace. A Trace subsumes a logical invocation sequence through the target system potentially passing multiple system nodes, containers, or applications. Location specifies an execution context within the trace. It consists of the host identifier, the identifier of the runtime container (e.g., JVM) where the subtrace is executed, the identifier of the application, the business transaction identifier, and the node type. The business transaction specifies the business purpose of the trace. Node type describes the role of the node that the subtrace belongs to, e.g., ”Application server” or ”Messaging node”. A SubTrace represents an extract of the logical Trace that is executed within one Location. A Callable is a node in a SubTrace that represents any callable behavior (e.g., operation execution). For each subtrace there is a root Callable, and each Callable has its containing subtrace. AdditionalInformation can be used to add information on a Callable that is tool-specific and not explicitly modeled by OPEN.xtrace. For simple types of additional information, the labels attribute can be used. Trace and SubTrace are extending the TimedElement which provides response time and exclusive time. Response time represents the time it takes for an instance to execute. Exclusive time is the execution duration of the instance excluding the execution duration of all nested instances, e.g., a subtrace without its subtraces. If an instance has no nested elements, its exclusive time is equal to its response time. The detailed inheritance hierarchy of the Callable is shown in Figure 4. LoggingInvocation and ExceptionThrow are used for logging and exception events, respectively. LoggingInvocation contains information on the logging level and the message, while ExceptionThrow contains the message, the cause, and the stack trace of the exception, as well as the class of the exception thrown.
APM Interoperability: An Open Format for Representing Execution Traces TimedElement -responseTime : long -exclusiveTime : long TimedCallable -exitTime : long
7
RemoteInvocation SubTrace 0..1 -id : long targetSubTrace
0..1 parent NestingCallable
DatabaseInvocation -prepared : Boolean -unboundSQLStatement : String -boundSQLStatement : String -parameterBindings : List -dbProductName : String -dbProductVersion : String -dbUrl : String -sqlStatement : String
Callable callees -labels : List 0..* -timestamp : long
LoggingInvocation -loggingLevel : String -message : String ExceptionThrow -errorMessage : String -cause : String -stackTrace : String -throwableType : String
Fig. 4: Callable with its inheritance hierarchy
TimedCallable is used for modeling exit time for synchronous events that have it, such as method executions and database calls. It also extends the TimedElement. RemoteInvocation is used if the execution of the trace moves from one location to another. It points to another SubTrace. Calls to a database are represented with the DatabaseInvocation. As we do not expect the monitoring of internals of the database management systems, calls to databases cannot have child callables. For callables that are able to call other callables, such as methods invoking other methods, NestingCallable is used. Each Callable can have one parent instance of NestingCallable type. Root callables in subtraces do not have parent callables. On the other hand, NestingCallable can have multiple children, each of which is of instance Callable. The inheritance hierarchy for NestingCallable is shown in Figure 5.
MethodInvocation -cpuTime : Long -exclusiveCPUTime : Long -className : String -methodName : String -packageName : String -parameterTypes : String -parameterValues : String -returnType : String -constructor : boolean
NestingCallable
HttpMethod GET POST HEAD DELETE TRACE CONNECT OPTIONS PATCH
HttpRequestProcessing -URI : String -method : HTTPMethod -httpParameters : Map -httpAttributes : Map -httpSessionAttributes : Map -httpHeaders : Map
Fig. 5: NestingCallable with its inheritance hierarchy
8
D. Okanovi´c, A. van Hoorn, C. Heger, A. Wert, and S. Siegl
MethodInvocation is used for the representation of method executions. It contains information on the method’s signature, e.g., method name, containing class and package, return type, and a list of parameter types, as well as their values. The time a method spent executing on a CPU, with or without the time on the CPU of called methods, is represented using the properties cpuTime and exclusiveCPUTime, respectively. For modeling incoming HTTP calls, HttpRequestProcessing is used. It contains the information on URI, HTTP method, parameters, attributes (request and session), and headers. HTTP calls are always the root callables of the subtrace. In practice, different APM tools provide different sets of data. To avoid situations where we are not sure if some data is missing, or is not supported by a tool, some attributes are marked as optional. For a full list of optional values, please refer to the detailed documentation. The current version of the OPEN.xtrace meta-model is implemented in Java [28]. To provide native support for model-driven scenarios, we plan to develop a version using respective technologies such as Ecore [10]. 3.3
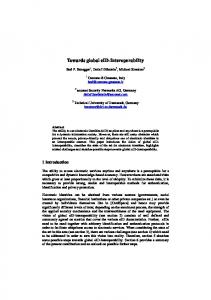
Model of the sample trace
For the trace shown in Figure 2, the resulting object model would be similar to the model depicted in Figure 6. The model has been simplified to fit space constraints. Some methods from the listing as well as timing and additional information have been omitted. The trace model can be read as follows. The execution starts with the doGet method (1) on location srv1. Other methods are successively called, until the doSearch method is called (2). From there, the execution moves to subtrace subTr2 on location srv2 (3). After the last method in this subtrace finishes execution (4), the execution returns to srv1 (2) and continues with the execution of doSearch until the end (5). 3.4
Tooling support
OPEN.xtrace provides not only the trace meta-model, but also a default implementation, tool adapters, and serialization support, which are publicly available [28]. Default implementation The default implementation of OPEN.xtrace is meant to be used by, e.g., tool developers. Any implementation of the format can be converted into the default implementation and be used as such by the tools. Adapters As stated above, in order to translate proprietary trace representations by APM tools into the OPEN.xtrace, adapters are required. Similar to some other well-known approaches (e.g., JDBC), we provide interfaces which are supposed to be implemented by tool vendors or third parties. Currently, we
APM Interoperability: An Open Format for Representing Execution Traces
9
trace : Trace
subTr1 : SubTrace
srv1 : Location
root
host = srv1 runtimeEnvironment = JVM1
parent root
1
doGet : HttpRequestProcessing URI = /service/url/method parent callee
remote : RemoteInvocation
doFilter : MethodInvocation parent
doSearch : MethodInvocation
callee
processData : MethodInvocation
targetSubtrace subTr2 : SubTrace
3
getData : MethodInvocation
2
processSingle : MethodInvocation srv2 : Location host = srv2 runtimeEnvironment = HotSpot1
log : LoggingInvocation
processSingle : MethodInvocation processSingle : MethodInvocation
list : MethodInvocation executeQuery1 : MethodInvocation
executeQuery3 : MethodInvocation executeQuery3 : MethodInvocation
5
dbCall1 : DatabaseInvocation sqlStatement = SELECT ... dbCall3 : DatabaseInvocation sqlStatement = SELECT ... dbCall3 : DatabaseInvocation sqlStatement = SELECT ...
4
Fig. 6: Object model of the trace in Figure 2.
provide publicly available [28] adapters for the following tools: Dynatrace [3], inspectIT [25], Kieker [18], CA APM (previously Wiley Introscope) [2]. Some details on the implementation of each tool adapter include the following: • Data from Dynatrace [3] has to be first exported into the XML format via Dynatrace’s session storage mechanism and retrieved via the REST API. After that, the adapter parses the XML file and creates an OPEN.xtrace representation of the traces included in the session storage. • inspectIT [25] stores traces in the form of invocation sequences, in the internal storage called CMR. The adapter connects to the CMR, reads the traces directly from it, and creates the OPEN.xtrace representation. • The Kieker [18] adapter is implemented as a Kieker plugin. Integrated into the Kieker.Analysis component, it reads traces from a Monitoring Log/Stream, and exports them as OPEN.xtrace traces. Additionally, the adapter supports the reverse direction, i.e., the transformation of OPEN.xtrace instances into the Kieker format.
10
D. Okanovi´c, A. van Hoorn, C. Heger, A. Wert, and S. Siegl
• CA APM [2] supports exporting of the trace data to XML. As with the Dynatrace, this XML is then parsed, and an OPEN.xtrace model is created. Serialization OPEN.xtrace provides serialization and deserialization helpers, that are based on the Kryo library.8 The current implementation provides serialization of binary data, but we also plan to implement a textual serialization. So far, we have not explicitly considered the storage layout and its efficiency.
4
Evaluation
The goal of the evaluation is to assess whether OPEN.xtrace is expressive enough, i.e., whether it is able to represent the execution trace data provided by common APM tools. The research questions that we want to answer are as follows: • RQ1: Can the APM tools provide the data required for OPEN.xtrace? • RQ2: Which data available in APM tools are not available in OPEN.xtrace? By investigating RQ1, we want to see what is the level of support for OPEN.xtrace in available APM tools. The answer to RQ2 will give us the information on the current coverage w.r.t. the modeling coverage and how to further develop OPEN.xtrace. We analyzed the data that is provided by APM tools and compared the data they provide with the data that is available in OPEN.xtrace. Since there are many tools, most of them proprietary, the complete survey of all APM tools is an impossible task. Instead, we focus on the most popular tools, with the largest market share, according to the Gartner report [23]. In our future work, we plan to add information on additional APM tools as a part of the community effort. The tools and sources of information that we analyzed are as follows. • Dynatrace APM [3]—The trial version, the publicly available documentation, as well as data exported from our industry partners were used. • New Relic APM [6]—The online demo with the sample application was used. However, in the trial version, we were not able to export the data, so the data was gathered from the UI and the available documentation. • AppDynamics APM [1]—AppDynamics was tested using the trial version. • CA APM Solution [2]—The licensed version of the tool was used to export the traces. • Riverbed APM [7]—The test version with the demo application was used. In this version, we were not able to export the data, so we used the available UI and the documentation. • IBM APM [4]—We used the online demo with the sample application and the provided UI. 8
https://github.com/EsotericSoftware/kryo
APM Interoperability: An Open Format for Representing Execution Traces
11
Additionally, we analyzed the data from two open source tools: Kieker [18] and inspectIT [25]. For those tools that did not provide a demo application, the DVD Store9 was instrumented and used as a sample application. It has to be noted that in this survey we used only the basic distributions of the APM tools. Some of the tools, such as Kieker, have extension mechanisms allowing to measure additional data. For the cases that trial versions were used, to the best of our knowledge, this does not have an influence on the evaluation. This section presents a condensed overview of the extensive raw data set developed in our study, which is available as a part of the supplementary material [28]. To give an idea of the amount of the investigated APM tool features: the raw table of results includes around 340 features analyzed in each of the eight tools. Coverage of OPEN.XTRACE After we collected the data from the tools, we compared the features of OPEN.xtrace to the data provided by the tools. The comparison is shown in Table 1. The features presented in the rows are extracted from the trace model (Section 3.2). From the table we can see that, while no tool provides all of the data, the method description and timing information is provided by all analyzed tools. The level of detail depends on the tool. IBM is one exception, since their tool provides only aggregated information about method execution over the span of time period. Examples of this kind of data are average, minimal, and maximal response and CPU times, number of exceptions, number of SQL calls, etc. In other tools, this aggregated data is also available, but this kind of data is of no interest for OPEN.xtrace, since it is intended to represent single traces. Data not covered by OPEN.XTRACE The data collected in the survey showed that there is some data that is not covered by OPEN.xtrace, but is provided by some of the tools. Although this data can be modeled using additional information (see Section 3.2), we plan to include it explicitly in our future work. Synchronization Time, Waiting Time, and Suspended Time All three mentioned metrics are available in Dynatrace. While OPEN.xtrace provides means to show that the method was waiting, there are situations where it is important to know why the method was on hold. Synchronization time represents periods of waiting for access to a synchronization block or a method. Waiting time is the time spent waiting for an external component. Suspended time is the time the whole system was suspended due to some external event during which it could not execute any code. Nested Exceptions The nested exception can point to the real cause of the problem and therefore provide valuable information for the analysis. This metric is available in Dynatrace. 9
http://www.dell.com/downloads/global/power/ps3q05-20050217-Jaffe-OE.pdf
D. Okanovi´c, A. van Hoorn, C. Heger, A. Wert, and S. Siegl
Method description
Timing information
Location data
Database call information
HTTP call information
Logging
Error information
Metric
OPEN.xtrace Kieker inspectIT Dynatrace New Relic App Dynamics CA Technologies Riverbed IBM
12
Method name Package name Class name Parameter types Parameter values Return type Is constructor Response time Exclusive time Timestamp CPU time Exclusive CPU time Exit time Host Runtime environment Application Business transaction Node type SQL statement Is prepared Bound SQL Statement DB name DB version URL HTTP method Parameters Attributes Session attributes Headers Logging level Message Error message Cause StackTrace Throwable type
• • • • • • • • • • • • • • • • • • • • • • • • • • • • • • • • • • •
• • • • • • • • •
• • • • • • • • • • •
• • • • • • • • • • • • • • • • • •
• • • • • • • • • • • • • •
• • • • • • • • • • • • • • • • •
• • • • • • • • • • • •
• • • • • • •
• • • • • • • • • • •
• • • • • • • • • • • • • • • • • • • • • • • • • • • • • • •
• • •
• • •
•
• •
Table 1: Comparison of data available in OPEN.xtrace to APM tools
APM Interoperability: An Open Format for Representing Execution Traces
13
Garbage Collector There is a set of performance issues related to garbage collection, so this information can help to identify them. This metric is available in New Relic, App Dynamics and IBM APM. Thread Name There are situations where a certain thread or thread group causes a problem. Adding this information to the location description would make the diagnosis of these problems easier. The thread name metric is available in Dynatrace, New Relic, and CA. The thread group name is available in CA. HTTP Response Code and Response Headers Knowing the state of the HTTP response can be important for detecting problems in traces that include HTTP calls. The response code is available in Dynatrace, New Relic, Riverbed, and IBM, while New Relic additionally provides response header contents.
5
Conclusion
Execution trace data is an important basis for different SPE approaches. While a number of commercial and open-source APM tools provides the support for capturing of execution traces within distributed software systems, each of the tools uses its own (proprietary) format. In this paper we proposed OPEN.xtrace and its tooling support, which provides a basis for execution trace data interoperability and allows for developing tool-agnostic approaches. Additionally, we compared OPEN.xtrace with the information that is available in leading APM tools, and evaluated its modeling capabilities. Our evaluation showed the level of support for the format in most popular APM tools, and provided us with the guidelines on how to further extend the format. Since this is a community effort, we plan to engage the public, including APM tool vendors to influence the further development of OPEN.xtrace, all under the umbrella of the SPEC RG [28]. Future work includes extensions of the modeling capabilities, e.g., to support asynchronous calls, and to support additional APM tools via respective adapters. In the long term, we want to extend the effort by including also non-trace data, e.g., system-level monitoring data in form of time series data.
Acknowledgements This work is being supported by the German Federal Ministry of Education and Research (grant no. 01IS15004, diagnoseIT), by the German Research Foundation (DFG) in the Priority Programme “DFG-SPP 1593: Design For Future— Managed Software Evolution” (HO 5721/1-1, DECLARE), and by the Research Group of the Standard Performance Evaluation Corporation (SPEC RG, http: //research.spec.org). Special thanks go to Alexander Bran, Alper Hidiroglu, and Manuel Palenga — Bachelor’s students at the University of Stuttgart — for their support in the evaluation of the APM tools.
Bibliography
[1] AppDynamics—Application Performance Monitoring and Management. https://www.appdynamics.com/ [2] CA—Application Performance Management. http://www.ca.com/us/ products/ca-application-performance-management.html [3] Dynatrace—Application Monitoring. http://www.dynatrace.com/en/ application-monitoring/ [4] IBM—Application Performance Management. http://www.ibm. com/middleware/us-en/knowledge/it-service-management/ application-performance-management.html [5] Logging control in W3C httpd. https://www.w3.org/Daemon/User/ Config/Logging.html [6] New Relic APM. https://newrelic.com/application-monitoring [7] Riverbed—Application Performance Monitoring. http: //www.riverbed.com/de/products/steelcentral/ application-performance-management.html [8] Ammons, G., Ball, T., Larus, J.R.: Exploiting hardware performance counters with flow and context sensitive profiling. In: Proc. ACM SIGPLAN ’97 Conf. on Programming Language Design and Implementation (PLDI ’97). pp. 85–96 (1997) [9] Binz, T., Breitenb¨ ucher, U., Kopp, O., Leymann, F.: TOSCA: Portable automated deployment and management of cloud applications. In: Advanced Web Services, pp. 527–549 (2014) [10] Brambilla, M., Cabot, J., Wimmer, M.: Model-Driven Software Engineering in Practice. Morgan & Claypool Publishers, 1st edn. (2012) [11] Brosig, F., Huber, N., Kounev, S.: Automated extraction of architecture-level performance models of distributed component-based systems. In: Proc. 26th IEEE/ACM Int. Conf. on Automated Software Engineering (ASE 2011). pp. 183–192 (2011) [12] Canfora, G., Penta, M.D., Cerulo, L.: Achievements and challenges in software reverse engineering. Commun. ACM 54(4), 142–151 (2011) [13] Ciancone, A., Drago, M.L., Filieri, A., Grassi, V., Koziolek, H., Mirandola, R.: The KlaperSuite framework for model-driven reliability analysis of component-based systems. Software and System Modeling 13(4), 1269–1290 (2014) [14] Distributed Management Task Force: Common Information Model (CIM) standard. http://www.dmtf.org/standards/cim/ (Feb 2014) [15] Elarde, J.V., Brewster, G.B.: Performance analysis of application response measurement (ARM) version 2.0 measurement agent software implementations. In: Proc. 2000 IEEE Int. Performance, Computing, and Communications Conf. (IPCCC ’00). pp. 190–198 (2000) [16] Fittkau, F., Finke, S., Hasselbring, W., Waller, J.: Comparing trace visualizations for program comprehension through controlled experiments. In:
APM Interoperability: An Open Format for Representing Execution Traces
[17]
[18]
[19]
[20] [21] [22]
[23] [24]
[25] [26] [27]
[28] [29]
[30]
[31]
15
Proc. 2015 IEEE 23rd Int. Conf. on Program Comprehension (ICPC ’15). pp. 266–276 (2015) Heger, C., van Hoorn, A., Okanovi´c, D., Siegl, S., Wert, A.: Expert-guided automatic diagnosis of performance problems in enterprise applications. In: Proc. 12th Europ. Dependable Computing Conf. (EDCC ’16). IEEE (2016), to appear van Hoorn, A., Waller, J., Hasselbring, W.: Kieker: A framework for application performance monitoring and dynamic software analysis. In: Proc. 3rd ACM/SPEC Int. Conf. on Performance Eng. (ICPE ’12). pp. 247–248 (2012) Israr, T.A., Woodside, C.M., Franks, G.: Interaction tree algorithms to extract effective architecture and layered performance models from traces. Journal of Systems and Software 80(4), 474–492 (2007) Jacob, B., Lanyon-Hogg, R., Nadgir, D., Yassin, A.: A Practical Guide to the IBM Autonomic Computing Toolkit. IBM (2004) Kiciman, E., Fox, A.: Detecting application-level failures in component-based internet services. IEEE Trans. on Neural Networks 16(5), 1027–1041 (2005) Kn¨ upfer, A., Brendel, R., Brunst, H., Mix, H., Nagel, W.E.: Introducing the Open Trace Format (OTF). In: Proc. 6th Int. Conf. on Computational Science (ICCS’06). pp. 526–533. Springer-Verlag (2006) Kowall, J., Cappelli, W.: Magic quadrant for application performance monitoring (2014) Llad´o, C.M., Smith, C.U.: PMIF+: Extensions to broaden the scope of supported models. In: Proc. 10th Europ. Performance Evaluation Workshop (EPEW ’13). pp. 134–148 (2013) NovaTec Consulting GmbH: inspectIT. http://www.inspectit.eu/ Parsons, T., Murphy, J.: Detecting performance antipatterns in component based enterprise systems. Journal of Object Technology 7(3), 55–91 (2008) Rohr, M., van Hoorn, A., Giesecke, S., Matevska, J., Hasselbring, W., Alekseev, S.: Trace-context sensitive performance profiling for enterprise software applications. In: Proc. SPEC Int. Performance Evaluation Workshop (SIPEW ’08). pp. 283–302 (2008) SPEC Research Group: OPEN — APM interoperability initiative. http: //research.spec.org/apm-interoperability/ (2016) V¨ogele, C., van Hoorn, A., Schulz, E., Hasselbring, W., Krcmar, H.: WESSBAS: Extraction of probabilistic workload specifications for load testing and performance prediction—A model-driven approach for session-based application systems. Journal on Software and System Modeling (2016), under revision Walter, J., van Hoorn, A., Koziolek, H., Okanovic, D., Kounev, S.: Asking ”what”?, automating the ”how”?: The vision of declarative performance engineering. In: Proc. 7th ACM/SPEC on Int. Conf. on Performance Engineering. pp. 91–94. ICPE ’16, ACM (2016) Woodside, C.M., Petriu, D.C., Petriu, D.B., Shen, H., Israr, T., Merseguer, J.: Performance by unified model analysis (PUMA). In: Proc. 5th Int. Workshop on Software and Performance (WOSP ’05). pp. 1–12 (2005)