Journal of Information Assurance and Security. ISSN 1554-1010 Volume 9 (2014) pp. 375-387 © MIR Labs, www.mirlabs.net/jias/index.html
Towards the Detection of Android Malware using Ensemble Features Aswini A M1, and Vinod P2 1
Department of Computer Science & Engineering SCMS School of Engineering & Technology Karukutty, Ernakulam, India, 683582
[email protected]
2
Department of Computer Science & Engineering SCMS School of Engineering & Technology Karukutty, Ernakulam, India, 683582
[email protected]
Abstract: The proposed framework presents static analysis of android malware .apk files by mining prominent features. This approach is implemented by extracting five different types of features i.e. permissions, permission count, hardware features, software features as well as API calls from 1175 .apk files, to evaluate if independent features are effective in comparison to ensemble features. Feature pruning is carried out to investigate the impact of varied feature lengths on accuracy. Dimensionality reduction is performed using Bi-Normal separation, Mutual Information and Relevancy score. Our proposed method using robust feature selection algorithms produces an overall classification accuracy of 93.02% with ensemble model using boolean representation of feature vector table. Comparative analysis of ensemble features with independent features depicted that the former resulted in better detection rate with BNS feature selection method.
Keywords: Android malware, Ensemble features, Feature Extraction, Feature selection, Static Analysis.
I. Introduction Android is an emerging trend in the global smartphone market [3]. Its modifiability and open source nature provides greater chance for malicious code to be injected to the .apk files. The legitimate .apk applications can be downloaded from Google Play. Nowadays the subject of concern is the proliferation of third party application vendors that resulted in the rise of malicious applications. The user devices are compromised when malicious apps disguised to be legitimate are downloaded. Once, the malware are planted into the devices, the vulnerabilities associated with the system are exposed to the remote attackers. Usually, unintentional activities are performed by automatically rooting the devices by malware. Some of the noticeable vulnerabilities are stack based buffer overflow resulting in arbitrary code execution and denial of service attacks. Alternate forms of attacks employed by the malware writers perform execution of code using Android Debugger Bridge (adb), memory corruption for gaining root privileges, cross site scripting for redirecting to vulnerable
domains and steal user credentials. Prior studies also demonstrated that certain malicious apps dispatch SMS without user’s knowledge to activate illegitimate services in their device. There are several issues that lead to the dissemination of these malignant apps. Smartphones can be customized using root exploits which are publicly available for more than 75% of time [18]. The availability of root exploits allows the smartphone tinkerers to gain extraneous privileges to perform operations desired by them. Another issue is that, antivirus relies on signature based approach [12]. The signature generation is a time consuming process and cannot detect zero-day malware attacks. Some known limitations of signature based antivirus are (a) lacks semantics of program (b) technical expertise to create signature and (c) exponential increase in the size of signature database. The desktop security solutions are not completely compatible for smartphones, as former require more memory and processing power. In this paper, we extract prominent permissions, software/hardware features and Application Programming Interface (API) calls for mobile malware identification using machine learning techniques. Here, we apply static analysis with the aim to examine if ensemble features with respect to individual features minimizes misclassification, thereby improving recognition rate. The remaining sections are organized as follows: Section II includes the related works. Section III deals with the android package file format and its components; Section IV explains the proposed methodology. Section V contains the experiment carried out followed by the results and discussions. Section VI discusses about the inference and finally, the conclusion and future work is presented in Section VII.
II. Related Work In [22], a static feature extraction method DroidMat was proposed. The experiment was carried out on malware collected from Contagio mobile [2] and benign apps gathered from Google Play store. Features such as permissions,
MIR Labs, USA
376 activities and services were extracted. Singular value decomposition was applied and an accuracy of 97.87% was achieved. The authors of [18] proposed permission based static mechanism for detecting the malicious applications. The experiment was performed on 46 pieces of iOS, Symbian 9.x and Android malware. Most common malware activities were found to be disposing user information (61%) as well as sending SMS (52%). In [17], a kernel based behaviour analysis for Android malware was proposed. It implements a log collector and log analyzer module to filter system calls and process trees. Proposed model is based on pattern matching approach. Assistance keywords or regular expressions are used to generate signatures. Experiment is performed on 230 applications and the result of this study led to the generation of 16 signatures based on 3 categories of threats associated with the apps. About 74 applications leak information, 14 applications execute exploit code and 21 destructive applications were detected. Authors in [15]-[16] and [20] devised a supervised anomaly detector named Andromaly, to extract 88 prominent features. Detection rates were better for the database with benign games than benign tools, used in combination with the 4 malicious apps. The Naïve Bayes and Logistic Regression were found to classify instances appropriately. The authors of [21] proposed a real-time multilevel anomaly detector that monitors Android OS at kernel and user level known as MADAM. They used 13 features and implemented machine learning techniques to detect unknown samples. The results depicted an overall accuracy of 100%. In [23], the authors used the features like permissions and permission count from the Android manifest file to generate classification model by implementing machine learning techniques. They used 1181 samples for experimentation which includes 239 malware files and achieved an accuracy of 86.41% and 0.92 of Area Under Curve (AUC) using Random Forest classifier. DroidAPIMiner in [1] is used to extract API calls by extending Androguard tool, and feature sets were evaluated with classification algorithms. An accuracy of 99% with false positive rate of 2.2% using k-NN classifier was reported. In [24], the authors presented a static analyzer, Droid Permission Miner that prunes prominent permissions. They implemented dimensionality reduction and machine learning techniques to determine the features that contributed to the identification of target class. Feature selection techniques like Bi-normal Separation (BNS) and Mutual Information (MI) were used in their work and obtained an accuracy of 81.56% with 15 mutual information features. In [26], the authors proposed a behavior based virus detection framework by identifying anomalous user behaviors. The proposed approach included: (a) behavior extractor (b) profile creator (c) virus detector (d) alert and bookkeeping modules. The model initially gathers user traffic data to generate a normal behavior profile. Subsequently, the arriving traffic is compared with profile using virus detection algorithm. The user profile was updated with new data in case of legitimate traffic; otherwise, the model raised alarms depicting the presence of virus. The algorithm was evaluated with commercial malware and a self written sample. This polynomial time algorithm resulted in high detection rate.
The authors in [3] designed a malware detection model to monitor, detect, track the malicious samples and notify users with illegitimate activities. All applications and system interactions in the smartphones were initially monitored for the identification of infections. The malware scanner modelled both anomaly and signature based techniques. In the former case, any deviation from the normal behavior was considered as malicious. However, the signature based approach investigates the presence of embedded malicious segments to flag suspicious samples which were removed from the system and subsequently notified to the system user. As smartphone have evolved in their computation capability, mobile devices are gaining popularity in Internet of Things (IoT) services [27]. These devices are used to monitor and control various applications like study of climatic diversification, automatic burglar alarm systems, investigation of crop growth etc. This is possible as the smartphones are equipped with sensor devices such as GPS, accelerometer, compass, motion detection systems etc. In this paper, a linear support vector machine (SVM) approach was employed to detect android malware and comparative analysis was performed with methods involving machine learning techniques. The experiment was conducted on dataset consisting of 90% benign and 10% malware specimens to reflect realistic scenario. The study depicted that SVM outperformed machine learning classifier in identifying mobile malware specimens. The authors in [2] proposed a model known as ADAM to evaluate the effectiveness of anti-virus systems under complex stress cases. Malware scanners were subjected with .apk malware specimens, which were obfuscated using different obfuscation transformation techniques such as (a) insertion of defunct methods (b) subroutine/method renaming (c) control flow transformation and (d) encryption of strings. The efficacy of ADAM using 222 android malware samples collected in the wild was analysed. The samples were monitored using top 10 AV available with virustotal site. Employing the techniques such as ADAM, the antivirus vendors can investigate and modify the scanning engines which would otherwise fail to identify morphed malware copies (appearing in future).
III. Android Package File Format The Android architecture [19] is composed of three layers; the operating system (Linux kernel), middleware (open source libraries, run-time environment) and the application framework (Android NDK, SDK, pre-installed core applications). An android package file (.apk) is a zipped file that contains resources and executables. Its components [3] are defined in Table 1.
IV. Proposed Methodology This section discusses our proposed model for statistical mobile malware analysis using machine learning techniques. Broadly different phases involved in our approach are feature extraction and dimensionality reduction. Androguard [1] is used for mining permissions, count of permissions, software/hardware features and API calls for identifying malicious apps. AndroidManifest.xml is utilized to extract the permissions, software/hardware features along with permission count. However, the API calls from each .apk files are also extracted using Androguard. Our proposed framework
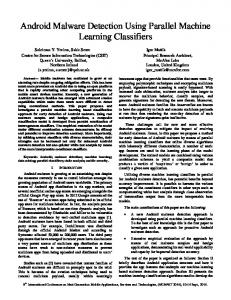
377 is shown in Figure 1(a) and Figure 1(b). The methodology is briefly described in the following subsections. Table 1: Components and their definitions Components AndroidManifest.xml
Res folder
classes.dex
Lib
META-INF
Resources.arsc
Definitions XML file that contains information about the permissions provided by the application, metadata, hardware and software features required by application etc. Contains the resources of application that defines languages, sound settings, graphics layout, attributes etc. Dalvik virtual machine executables that can be run in Dalvik machine and includes bytecode in .dex format. Contains Native libraries (for C or C++) that can be used through NDK (native development kit) Includes application’s signature, certificate, list of resources and manifest file. It is obtained as a result of the compilation process.
A. Datasets The approach is implemented using 1175 .apk files comprising of 575 malicious samples (collected from Contagiodump [2] as well as user agencies), and 600 benign applications (downloaded from various publicly available internet sources). B. Feature Categories Five categories of features are used: (1) Permissions (2) Count of permission in each file (3) Application Programming Interface (API) calls (4) Software and (5) Hardware features The .apk files which are originally in binary format are supplied as input to Androguard. The python script androaxml.py is used to generate .xml file (human readable Manifest file) from .apk file; includes the permissions (within tag) as well as s/w and h/w features (within tag). Likewise, androapkinfo.py is used to obtain the API calls of the samples. C. Compute the permission count After extracting permissions from each .apk file, the number of permissions in a file is determined. This is chosen as another type of feature for preparing the classification model. Samples consisting in range of 22 to 116 permissions are rarely present (refer Figure 3). This indicates lesser permissions are used both in malware and benign files. Figure 2 exhibits that variability of permission counts in both the target classes are less except with few exceptions. Also, Figure 2 depicts that only few permissions are required to flag a given sample as malicious.
Figure 1. Architecture of (a) Individual feature model and (b) Ensemble model D. Divide the dataset into train and test set The dataset consisting of entire samples is divided into test and train set. Out of the complete 600 benign samples, 300 benign apps are included in the test set and the rest 300 apps are considered in the training set. From 575 malware samples, 287 files are allocated to the test set and 288 samples are utilized in the training phase. E. Mine common Features (M B) In the pre-processing phase, we mine the permissions, s/w and h/w features as well as API’s used by both malware and benign applications. Significant attributes such as API’s and permissions are retrieved by applying feature reduction techniques. From the reduced set of variables, common attributes having high variance in malware and benign specimens are preserved. Common features are given priority over other category of attributes such as union of malware and benign features, discriminant benign and discriminant malware features as they are found to be less promising [24]. F. Feature selection Feature selection in data mining is the technique to reduce the input feature space into convenient size so as to extract a subset of k best features from a set of n features (large feature space). Dimensionality reduction is administered so as to exclude noisy variables and include attributes that are more likely to be used. Highly correlated variables that do not contribute for identifying target classes are eliminated.
378
Figure 2: Count of permissions vs number of files
Figure 3: Number of files vs permission count ranging from 22 to 116 Bi-Normal Separation (BNS) [8][9][10] (based on Z-Score), Mutual Information (MI) [5] and Relevancy score (RS) [25] feature selection methods are implemented to fabricate the classification model in our proposed method. Bi-Normal-Separation (BNS) select positive and negative features and is not biased to a class. BNS score is computed using Z-Score statistical table [4]. Here, F is the normal 1 cumulative distribution function and F is the inverse cumulative probability function of standard normal distribution. The absolute value of the difference is considered as the BNS score.
| F
BNS True
-1
positive
False Positive
( tpr ) F
1
rate (TPR)
rate
( fpr ) | TP TP FN
( FPR )
FP TN FP
(1)
(2)
(3)
Mutual-Information (MI) is the measure of mutual dependence of two random variables. If we consider f as the feature and c is the target class, MI provides the knowledge about the extent to which a feature f decreases the uncertainty in identifying the right class c. The selected feature must have maximum relevance to target class. MI ( f , c )
c{ M ,B }
f
P( f ,c ) P ( f , c ) log P ( f )P ( c )
(4)
where, P(f,c) is the joint probability distribution function, P(f) and P(c) are the marginal probability distributions of f and c. Relevancy score (RS) is based on the conditional probabilities of a feature in both benign and malware class. The score for a feature is computed using the equation (5).
RS ( t k , c i ) log
P(t
k
/c i ) d
(5)
P( t k / c i ) d
is the presence of feature t k in class c i , P( t k / c i ) is the absence of feature t k in class c i and d is the number of samples with feature t k in class c i . The top 78 common permissions in the training samples and prominent 2166 API’s common to both malware and benign train set are further pruned by applying Bi-Normal Separation (BNS), Mutual Information (MI) and Relevancy score (RS). Features are ranked based on these feature selection techniques and experiments were performed on varying feature lengths. Due to lack of space, top 18 permissions that contribute to the classification of .apk files are shown in Figure 4, and 20 permissions are eliminated (rare permissions) as they do not contribute for new malware prediction (refer Figure 5). where,
P(t k /c i )
G. Ensemble features Prominent features of varied type such as permissions, API, permission count and software/hardware features are combined to generate a new feature space also referred to us by ensemble features (ensemble model). This attribute space is prepared by concatenating independent features with optimal feature length, determined before creating ensemble model. The basic premise to combine the top ranked independent features is that, further application of feature ranking method may improve classification accuracy, as irrelevant attributes would be already eliminated (refer Figure 1(b)). H. Classification We arrange the common feature lists (M B) in the descending order of the BNS, MI and RS scores respectively. The attributes with top BNS score is eliminated as it does not provide better detection rate as per the prior work reported in [24]. Hence, bottom BNS and top MI, RS features with diverse feature length is considered in the experiments.
Percentage of occurrence
379
Percentage of occurrence
Figure 4. Difference in the frequencies of 18 selected permission in malware and benign .apk files.
Figure 5. Difference in the frequencies of 20 eliminated permissions in the malware and benign .apk files. In the first case, the bottom 10, 20,…70 BNS scored permissions as well as top 10, 20,.…70 MI and RS ranked permissions are selected from training samples to generate classification model. Likewise, bottom BNS features along with permission count, top MI and RS variables with count of individual permissions are used in the experiment. In case of API calls, 50, 100, 200….1000 bottom BNS scored features and 50, 100, 200….1000 top MI and RS scored features are considered. Here, the investigation is carried out in two aspects; considering the API frequency and the binary values of features (indicate presence/absence of an API in a sample). Likewise, 40 hardware and 7 software features are obtained. Vector space model is created for independent set of features for the entire training set. The ensemble of attributes obtained as a part of feature ranking methods is also used to create feature vector table (FVT) for modeling malware and benign instances. Unseen instances are predicted using the learned models. The malware and benign models are developed using classification algorithms (Naïve Bayes (NB) [13], AdaBoostM1 with J48 as base classifier (ADA)[6], Random Forest (RF) [7] [No: of Trees= 40, seed=3], IBK-5 and J48) implemented in WEKA [14]. Also in the case of ensemble features, the models are prepared using the above mentioned classifiers. I. Evaluation Parameters In order to evaluate the effectiveness of the generated model accuracy [11] is computed. Accuracy is how close an estimated value is to the true or actual value. This parameter is calculated using equation 6, by estimating the number of false positives (FP), true positives (TP), false
negatives (FN) and true negatives (TN). FP denotes the misclassification of benign samples, TP indicate correctly classified malware instances, FN represents wrongly classified malware samples and TN denotes correctly classified benign files. To indicate the proportion of malware samples that are correctly discerned as malware and misclassified as benign, the true positive rates (TPR) and false positive rates (FPR) should be evaluated. The equations for TPR as well as FPR are already discussed in Section IV. Accuracy
TP TN TP TN FP FN
(6)
The investigations carried out in this work are listed below: Identification of optimal feature vector length. Estimation of suitable type of feature (permissions, count of permissions, software/hardware features or API calls) that results in improved classification accuracy. The classifier that results in reduced misclassification at higher accuracy. Comparative analysis of ensemble and individual feature models and determination of robust feature selection technique that yield high detection rate.
V. Experiments and Findings The investigations are performed on a computer with Ubuntu 12.04 operating system, Intel core i3 CPU and 4GB RAM. The experiment is carried out in two phases (1) considering independent features and (2) use of ensemble features with a feature selection method. These phases are briefly discussed in the following sections.
380
Feature Length
Classifiers Evaluation Measure 10 20 30 40 50 60 70
NB
IBK-5
J48
ADA
RF
Acc.
Acc.
Acc.
Acc.
Acc.
76.19 74.65 84.69 84.69 85.88 86.05 86.05
81.80 84.86 85.03 84.18 83.84 84.69 84.52
82.14 85.03 87.92 86.90 87.24 87.41 87.41
82.31 85.37 89.79 88.26 89.11 89.28 89.11
84.69 89.62 92.51 92.00 92.17 91.15 91.83
Feature Length
Table 3: Accuracy (in %) for top MI permissions with Boolean FVT NB IBK-5 J48 ADA RF Classifiers Evaluation Acc. Acc. Acc. Acc. Acc. Measure 84.18 85.03 84.69 85.03 85.03 10 85.03 85.88 86.05 87.24 87.58 20 85.71 85.88 84.69 87.58 89.96 30 86.22 85.88 84.35 88.09 91.49 40 85.54 84.86 86.56 89.62 91.66 50 85.71 85.20 87.58 88.94 92 60 86.05 84.69 87.41 89.28 92.51 70
Feature Length
Accuracy (in %) for top RS permissions with Boolean FVT NB IBK-5 J48 ADA RF Classifiers Evaluation Acc. Acc. Acc. Acc. Acc. Measure 82.82 83.84 83.84 82.31 83.33 10 83.67 87.85 85.37 86.90 88.77 20 83.50 86.56 88.77 86.56 89.96 30 85.80 85.37 87.92 88.94 90.98 40 85.20 84.69 87.07 90.47 91.32 50 85.88 84.52 87.41 88.60 91.66 60 86.05 84.69 87.41 89.11 91.83 70
Feature Length
Table 5: Accuracy (in %) for bottom BNS permission feature with Boolean FVT NB IBK-5 J48 ADA Classifiers Evaluation Acc. Acc. Acc. Acc. Measure 75.51 82.14 84.69 86.90 11 74.65 85.20 85.20 87.92 21 84.69 85.03 87.41 88.26 31 84.86 84.01 86.90 89.11 41 85.54 83.33 87.24 89.11 51 85.71 84.69 87.41 88.43 61 71
85.71
84.86
87.41
88.43
count RF Acc. 87.07 90.81 91.15 91.83 91.83 92.17 92.34
Table 6: Accuracy (in %) for top MI permission count feature with Boolean FVT Classifiers Evaluation Measure 11 21 31 41 51 61 71 Feature Length
1) Presence/absence of feature From the training samples, a total of 195 and 109 unique permissions are obtained from benign and malware files respectively. Common permissions (78 features) of malware and benign files are mined. These 78 permissions are arranged based on their BNS, MI and RS scores in descending order. Classification models are generated using top 10, 20,...….70 ranked permissions using feature selection techniques (MI and RS). For BNS, bottom 10, 20……. 70 ranked permissions are considered. The same activity is carried out with the permission count for both malware as well as benign training samples. A total of 7,174 and 29,765 unique API calls are initially obtained for malware and benign applications. In order to eliminate rare attributes, pre-processing is performed and 50% of infrequent API calls are filtered out. Finally, the feature space is reduced to 14,882 benign and 3587 malware API’s respectively. From this pruned feature set, 2166 common API’s are determined and arranged in descending order with respect to BNS, MI and RS scores. Classification models are generated using prominent MI, RS and BNS scored API calls, specifying their presence/ absence in a sample for variable feature length (i.e. 50, 100, 200…..1000). The 40 hardware and 7 software attributes obtained are used completely without elimination. Table2:Accuracy (in %) for bottom BNS permissions with Boolean FVT
Table 4:
NB
IBK-5
J48
ADA
RF
Acc.
Acc.
Acc.
Acc.
Acc.
84.35 84.52 85.71 86.05 85.54 85.37 85.71
84.35 85.88 85.44 85.20 84.86 85.37 85.03
86.22 86.05 84.69 84.35 86.56 87.58 87.41
87.41 87.75 88.77 88.77 87.92 87.58 88.43
88.09 89.62 89.96 91.83 91.83 92.17 92.34
Table 7: Accuracy (in %) for top RS permission count feature with Boolean FVT Classifiers Evaluation Measure 11 21 31 41 51 61 71
Feature Length
A. Investigation with individual features Classification model is generated by considering the frequencies of features in the dataset as well as individually recording the presence and absence of a feature (also known as boolean features). Since, in each .apk file, the permissions and software/hardware features are defined only once, their presence/absence (0 or 1) is considered in the feature vector table. For API calls, the investigation is carried out in both perspectives (presence/absence as well as frequency of a feature in a sample).
NB
IBK-5
J48
ADA
RF
Acc.
Acc.
Acc.
Acc.
Acc.
82.82 83.33 83.67 85.03 84.86 85.71 85.71
84.69 87.41 86.73 85.37 84.86 84.18 84.69
85.54 86.39 88.26 87.92 87.07 87.41 87.41
84.01 87.75 89.28 88.94 89.28 88.77 88.43
86.05 90.13 90.81 91.32 91.83 90.98 92.17
Considering each category of feature, it was discovered that 30 BNS permission feature resulted in higher accuracy using Random Forest (i.e. 92.51%) (refer Table 2). Also, bottom BNS features exhibited better results in comparison to top BNS features. Thus, our hypothesis with permission features is comparable with the prior work as in [24]. However, top 70
381
Feature Length
Table 9: Accuracy (in %) for top MI API calls with Boolean FVT NB IBK-5 J48 ADA RF Classifiers Evaluation Acc. Acc. Acc. Acc. Acc. Measure 71.08 82.14 83.50 82.99 82.48 50 73.12 85.03 85.54 86.73 88.60 100 82.34 82.65 85.71 89.79 88.26 200 82.14 82.99 85.71 90.64 89.79 300 71.08 82.65 85.54 87.58 90.47 400 69.04 81.97 87.41 90.30 90.81 500 62.24 82.31 87.41 90.47 91.15 600 59.86 81.46 86.22 89.11 90.47 700 61.22 81.46 87.75 90.81 90.47 800 61.56 82.14 87.75 90.47 90.81 900 61.56 82.14 87.75 90.30 90.47 1000 Table 11 shows the results obtained using the software and hardware features without implementing feature selection technique. The 40 h/w and 7 s/w features depicted less accuracy. The former exhibited 56.12% and the latter depicted 52.04% accuracies respectively. 2) Frequency of a feature In case of API calls, the next classification model is generated by considering the frequencies of API in the dataset. Frequency denotes the number of occurrence of an API call in each sample.
Feature Length
Table 11: Accuracy (in %) for S/W and H/W features Software Hardware Features Used Features Features Evaluation Measure Acc. Acc. 52.04 55.9 NB 52.04 55.78 IBK-5 51.19 53.23 J48 51.19 54.08 Adaboost M1(J48) RF(40) Seed 3 51.04 56.12 Table 12: Accuracy (in %) of bottom BNS API calls with frequency FVT NB IBK-5 J48 ADA RF Classifiers Evaluation Acc. Acc. Acc. Acc. Acc. Measure 62.07 81.46 84.69 85.20 90.13 50 62.92 84.18 87.07 89.62 91.83 100 64.11 84.35 87.24 89.45 91.35 200 63.26 84.18 86.22 89.28 89.96 300 63.09 84.01 86.22 88.77 90.98 400 62.24 83.67 86.39 89.28 91.81 500 61.39 84.01 86.73 89.79 91.32 600 62.58 84.18 86.73 90.81 91.32 700 64.62 85.71 87.75 90.64 91.66 800 65.81 85.03 87.41 90.81 91.68 900 67.34 84.86 87.41 90.30 91.32 1000 Feature Length
Feature Length
Table 8: Accuracy (in %) for bottom BNS API calls with Boolean FVT NB IBK-5 J48 ADA RF Classifiers Evaluation Acc. Acc. Acc. Acc. Acc. Measure 63.26 82.31 84.01 86.22 50 90.81 68.70 85.54 87.24 88.77 90.81 100 70.91 86.39 87.75 89.45 89.79 200 81.46 86.73 86.05 89.79 90.81 300 64.62 86.73 86.05 90.81 89.79 400 58.84 87.07 86.90 89.79 90.47 500 57.82 87.41 87.75 90.81 90.13 600 57.48 85.88 89.11 88.77 90.98 700 57.65 85.71 88.94 90.13 91.15 800 60.37 85.88 88.77 90.64 91.15 900 60.88 84.18 88.77 90.64 90.64 1000
Table 10: Accuracy (in %) for top RS API calls with Boolean FVT NB IBK-5 J48 ADA RF Classifiers Evaluation Acc. Acc. Acc. Acc. Acc. Measure 63.94 83.16 83.84 85.54 88.94 50 66.49 87.07 86.39 89.28 91.49 100 71.93 87.24 87.58 89.28 91.32 200 80.27 87.24 87.07 90.47 90.47 300 79.93 87.07 86.73 88.94 91.32 400 61.05 87.07 86.73 89.79 92.34 500 57.99 86.90 87.07 90.13 91.15 600 56.63 86.56 87.07 88.09 91.32 700 56.63 87.07 87.07 88.77 90.98 800 56.46 86.39 88.09 91.15 91.49 900 56.46 86.39 88.09 91.15 90.47 1000
Table 13: Accuracy (in %) for top MI API calls with frequency FVT NB IBK-5 J48 ADA RF Classifiers Evaluation Acc. Acc. Acc. Acc. Acc. Measure 66.32 82.31 83.50 81.46 82.48 50 69.89 85.20 83.84 86.56 88.94 100 76.36 82.65 85.37 88.94 90.47 200 69.21 83.16 85.54 89.62 90.13 300 68.19 85.03 86.05 90.30 89.79 400 68.02 83.84 84.86 89.79 90.81 500 67.85 84.18 84.86 90.13 90.47 600 67.68 84.69 87.92 89.45 90.98 700 68.70 85.20 88.43 90.13 90.81 800 68.19 85.54 88.26 90.64 90.30 900 68.19 85.54 88.26 90.13 91.49 1000 Feature Length
MI and RS ranked permissions resulted in better accuracy (92.51% and 91.83%) using Random Forest. Thus, it is observed that the classification model developed using MI and RS features does not identify applications effectively as it uses more number of permissions than BNS for improved performance (refer Table 3 and Table 4 ). Similar experiment is performed by considering permissions along with its count in each sample. The BNS and MI feature selection technique depicted a marginal increase in accuracy compared to RS (refer Table 5, Table 6 and Table 7). The optimal feature length is observed to be 71 with an accuracy of 92.34% using BNS/MI with Random Forest. With API feature, the feature length of 50 provided an accuracy of 90.81% using BNS whereas, MI and RS resulted in an accuracy of 91.15% and 92.34% respectively with 600 and 500 API’s (Refer Table 8, Table 9 and Table 10).
Figure 7: Comparing the rank of bottom BNS Scored permissions with their MI and RS ranks (Lower ranks indicate high significance)
Figure 6: Comparing the rank of bottom BNS Scored API’s with their MI and RS ranks (Lower ranks indicate high significance)
382
Figure 9: Comparing the rank of top BNS scored permissions with their MI and RS ranks (Higher ranks indicate less significance)
Figure 8: Comparing the rank of top BNS scored API’s with their MI and RS ranks (Higher ranks indicate less significance)
383
384 Table 14: Accuracy (in %) for top RS API calls with frequency FVT Classifiers
Feature Length
Evaluation Measure 50 100 200 300 400 500 600 700 800 900 1000
NB
IBK-5
J48
ADA
RF
Acc.
Acc.
Acc.
Acc.
Acc.
62.58 65.98 69.72 63.60 63.60 62.41 61.90 61.56 61.56 61.73 61.73
84.81 86.39 86.39 85.20 85.20 85.71 85.03 85.03 85.08 84.86 84.86
87.58 86.22 87.58 88.60 88.09 88.09 88.09 88.26 88.26 87.41 87.41
88.60 89.45 88.60 91.49 91.15 89.79 90.64 91.15 91.66 89.96 89.96
90.64 90.47 90.81 91.49 92.51 92 90.98 90.98 91.32 91.32 91.66
Table 15: Accuracy (in %) for ensemble features with frequency FVT Model Feature Selection Feature Length Evaluation Measure NB IBK-5 J48 Adaboost M1(J48) RF(40) Seed 3
BNS 218 Acc. 65.13 89.28 87.92 90.64 93.87
Ensemble Features MI RS 1118 518 Acc. Acc. 69.04 63.94 86.73 86.05 87.41 87.92 91.83 91.49 94.04 93.87
From the observations for BNS synthesized API calls, an accuracy of 91.83%, feature length of 100 with Random forest classifier is obtained. A slight improvement in accuracy is attained using relevancy score (Acc. 92.51%) but with large features (400 features) (refer Tables 12-14). We found in all cases, BNS performed better as it chooses the features that are more significant in classification of unseen samples. Similar accuracy is obtained with MI and RS but at the expense of larger attributes. In comparison to API, permissions as attributes results in 92.51% accuracy (refer Tables 2-14). Also Random forest exhibited reduced false rate with higher classification accuracy. B. Investigation with ensemble features In the second phase, an ensemble feature space consisting of prominent permissions, count of permissions, top ranked API’s and hardware/software features using specific feature selection technique are considered for generating classification models. Two ensemble models are generated for each feature selection technique (a) first, model is generated by considering the frequencies of prominent API in each sample with presence/absence of other categories of feature (permissions, permission count, software/hardware features) and (b) second, model is designed by considering the boolean value of API’s along with permissions, count of permission and software/hardware features. For the ensemble model built by considering the frequency representation of FVT with BNS feature selection, 218 features resulted in an accuracy of 93.87% with Random Forest classifier. MI (Acc. 94.04%) and RS (Acc. 93.87%)
reported similar accuracy however utilizing 1118 and 518 features respectively (refer Table 15). The accuracy for ensemble model created by boolean values in FVT of API calls, permissions, count of permissions and software/hardware features is found to be 93.02% with 168 BNS features. Accuracy of 93.53% is obtained with MI (at feature length 718) and an accuracy of 94.21% is acquired with RS (using 618 features) (refer Table 16). Table 16: Accuracy (in %) for ensemble features with Boolean API Model Ensemble Features Feature Selection BNS MI RS Feature Length 168 718 618 Evaluation Measure Acc. Acc. Acc. 82.99 67.85 72.61 NB 87.24 83.16 86.22 IBK-5 88.26 89.28 89.62 J48 91.15 90.64 91.15 Adaboost M1(J48) 94.21 93.53 RF(40) Seed 3 93.02 These two investigations demonstrate that that the ensemble model generated by considering the boolean features provide higher accuracy with 168 features. For an ideal malware analyzer, the TPR should be higher with minimum FPR rate. The results of our investigations suggest that BNS outperforms all other feature selection techniques used in this work. Comparative analysis of independent and ensemble feature model with BNS feature selection is depicted in Table 17 and Table 18 respectively. Tabulated information from Table 17 and Table 18 shows that ensemble model performs better compared to individual feature model. Also, the detection time of samples is near to realistic scenario indicating that the detector proposed by us could be deployed in commercial antivirus engine. Permissions that are rarely and widely used by malware and benign samples with their descriptions are shown in the Table 19 and Table 20. List of prominent and insignificant API’s are tabulated in Table 21 and Table 22. Table 17: Evaluation Parameter for BNS feature selection technique (independent model) (Features, Feature Length)
Evaluation Parameters Time (secs)
Acc.
TPR
FPR
(Permissions, 30)
92.51
88.50
6
1 . 21 10
9
(Permission count, 71)
92.34
88.50
4
1 . 24 10
9
(API call-boolean FVT, 50)
90.81
88.15
6.66
1 . 28 10
9
91.83
90.24
6.66
1 . 46 10
9
(API call-frequency FVT,100)
385 Table 18: Evaluation Parameter for BNS feature selection technique (ensemble model) Model
Feature Length
Ensemble model with frequency FVT Ensemble model with Boolean FVT
Evaluation Parameters Time Acc. TPR FPR (secs)
Table 20: Insignificant permissions and their description Permissions RECEIVE _WAP_PUSH WRITE_CALL_LOG
218
93.87
90.24
4.33
1 . 43 10
9
1 . 33 10
9
READ_CALL_LOG CLEAR_APP_CACHE
168
93.02
90.24
2.66
UPDATE_DEVICE_STAT S DEVICE_POWER
Table 19: Prominent permissions and their description Permissions WRITE_EXTERNAL_STORAGE
. READ_PHONE_STATE CHANGE_WIFI_STATES
WAKE_LOCK
ACCESS_NETWORK_STATE
RECEIVE_BOOT_COMPLETED
SEND_SMS ACCESS_WIFI_STATE
ACCESS_COARSE_LOCATION
ACCESS_FINE_LOCATION
READ_CONTACTS INSTALL_PACKAGES
RECEIVE_SMS
Description Permission for an application to write to the external storage Permission for read only access to phone state Allows changing wi-fi connectivity state. Allows using PowerManager WakeLocks to keep processor from sleeping or screen from dimming Permission to access network information Allows an application to receive ACTION_BOOT_COMPLET ED that is broadcasted after booting. Allows an app to send SMS Permission for the app to access network information Permission for the app to access approximate location by means of towers and wi-fi Permission for the app to access precise location by means of towers and wi-fi To read contact list of the device’s user Permission for package installation Permission for the app to check incoming SMS to save and process them.
VI. Inference From the results obtained, we infer the following: 1. Increase in feature length reduced the classification accuracy; due to the presence of irrelevant features that acts as noise.
CALL_PREVILEGED
REORDER_TASKS STATUS_BAR
Description Permission To Monitor Incoming WAP Push Permission for an application only to write user’s contact data Permission for an application to read call log Permission for an application to clear the caches of all applications that are installed Permission for an application to update device statistics. Permission for an application for low-level access to power management Permission for an application to call any phone number without using dialer user interface to confirm the call. Permission for an application to change Z-order of tasks Permission for an app to disable, open and close the status bar and its icons
2. BNS assigns higher rank to a feature in comparison with MI and RS (refer Figure 6 and Figure 7). 3. Top BNS features show similar trends in ranking as with MI and RS feature selection techniques (refer Figure 8 and Figure 9). 4. Random Forest classifier generated better results compared to other classifiers. It is an ensemble based learning method. Results from multiple classifiers are aggregated to assign class to a sample. 5. Permissions and API calls assigned with lesser score by the feature selection methods are eliminated to reduce the dimensionality of feature space thereby resulting in improved performance. Considering the individual features, permissions are better as the activity of an app depends on the permissions requested by it. Every malicious application requires certain permissions that are different from the legitimate .apk files. 6. Performance of ensemble models is better than the models built using individual features. It is because the combined feature space captures the strength of individual features from all feature categories and improves classification. 7. In PUMA [23], the authors used the features like permissions and count of permissions from the manifest file to generate classification model by implementing machine learning techniques. Comparing our work with PUMA, we used five feature categories like permissions, count of permissions, s/w features, h/w features and API calls. Our method demonstrates that an accuracy of 92.51% is attained with permissions, the count of permissions resulted in an accuracy of 92.34% and the performance using API calls is 91.83% with BNS using Random forest classifier. Performance of [23]
386 (Accuracy 86.41%) is found to be inferior with our approach. The proposed ensemble model with boolean FVT representation results in 93.02% accuracy using 168 features. On considering the frequency of features, the proposed method shows 93.87% accuracy using 218 features with Random Forest classifier. Table 21: Prominent API’s and their description API Calls
Description
onCreateOptionsMenu()
onDraw()
onCreateDialog()
onTouchEvent()
onOptionItemSelected() OnAttachedToWindow() onKeyUp()
It is called only one time, i.e, the first time when the options menu is shown. It is used to initialize the contents of the activity’s standard options menu. Menu items are placed in menu Override these calls to implement custom view. Used when the contents of the view has to be changed To implement dialog designs present in the dialog design guide. Called when an event like a touch screen motion event occurs. Called when an item in the options menu is selected It is called when the view is window attached Called at the time of an event like a key up event
Table 22: Insignificant API’s and their description API Calls
setLanguage() setMarginEnd() setWebViewClient() shouldOverrideKeyEv ent() setPitch() addSpeech() setSpeechRate() setName()
Description
Sets the text to speech language Provides additional space on the end side of this view. It sets the end margin. Sets the webViewClient that is capable of receiving requests. Provides chance to the host application to handle the key events simultaneously Sets the speech pitch Adds mapping between text and a sound file API calls to set speech rate. API calls to set name of the suite.
VII. Conclusion The proposed malware analysis framework uses static feature extraction methodology by implementing machine learning algorithms. The features used are permissions, permission
count, software and hardware features from manifest file and the API calls. The ensemble model produced better accuracy in classifying .apk samples compared to the individual features. We observed that Bi-Normal Separation feature selection method synthesizes precise features that results in higher classification accuracy. The ensemble model with Boolean features is 93.02% accurate with 168 features. For individual features, 30 permissions selected using BNS are 92.51% accurate when compared to all other feature categories. Thus, our proposed method can be used for the classification of malware or benign samples. To obtain higher classification accuracy in future, we would like to create an optimal feature vector by combining features such as Dalvik opcode, Java reflection and also Android Manifest attributes. A hybrid model can also be generated by implementing dynamic analysis for extracting the run-time features.
References [1] Y. Aafer, W. Du, Heng Yin. “DroidAPIMiner: Mining API-Level Features for Robust Malware Detection in Android”. In Proceedings of the 9th International ICST Conference, SecureComm 2013: pp. 86-103, 2013 [2] Min Zheng, Patrick P. C. Lee, John C. S. Lui, “ADAM: An Automatic and Extensible Platform to Stress Test Android Anti-virus Systems”, In Proceedings of the 9th International Conference on Detection of Intrusions and Malware & Vulnerability Assessment (DIMVA 2012),Greece, pp. 82-101, 2012 [3] Maya Louk, Hyotaek Lim, and HoonJae Lee, “An Analysis of Security System for Intrusion in Smartphone Environment,” The Scientific World Journal, vol. 2014, Article ID 983901, 12 pages, 2014. [4] Joseph F. Healey, “ The Normal Curve” in The Essentials of Statistics: A Tool for Social Research, 8th ed, Belmont, CA: Thomson/Wadsworth, 2007 [5] R.Battiti, “Using Mutual Information for Selecting Features in Supervised Neural Net Learning” IEEE Transactions On Neural Networks, Vol. 5, No. 4, July 1994 [6] Y. Freund and R.E Schapire, “Experiments with a new Boosting Algorithm, Machine Learning” In Proceedings of the Thirteenth International Conference on Machine Learning(ICML 1996), pp.148–156, 1996 [7] A.Liaw and M. Wiener, "Classification and Regression by Random Forest", R News, Vol. 2(3), pp.8-22, December, 2002 [8] G. Forman. “An Extensive Empirical Study of Feature Selection Metrics for Text Classification”. Special Issue on Variable and Feature Selection, Journal of Machine Learning Research, 3(Mar), pp.1289-1305, 2003 [9] Lei Tang, and Huan Liu,“Bias Analysis in Text Classification for Highly Skewed Data”, In Proceedings of the 5th IEEE International Conference on Data Mining( ICDM), IEEE Computer Society”, pp.781-784, 2005
387 [10] G. Forman, “BNS Scaling: A Complement to Feature Selection for SVM Text Classification”, Hewlett-Packard Labs Tech Report HPL-2006-19, 2006 [11] Tan, Pang-Ning and Steinbach, Michael and Kumar, Vipin, Introduction to Data Mining, First Edition, 2005, Addison-Wesley Longman Publishing Co., Inc., Boston, MA, USA [12] E. Filiol, G. Jacob, M. Le Liard, “Evaluation Methodology and Theoretical Model for Antiviral Behavioural Detection Strategies”, WTCV06 Special Issue, G. Bonfante J.-Y. Marion eds, Journal in Computer Virology, 2 (4), 2006 [13] J. Chen, H. Huang, S. Tian, Y. Qu, “Feature Selection for Text Classification with Naive Bayes”, Expert Systems with Applications, pp.5432–5435, 2009 [14] M. Hall, E. Frank, G. Holmes, B. Pfahringer, P. Reutemann, Ian H. Witten, “The WEKA Data Mining Software: An Update”, SIGKDD Explorations, Volume 11, Issue 1, 2009 [15] A. Shabtai and Y. Elovici, “Applying Behavioral Detection on Android-Based Devices”. In Proceedings of rd the 3 International Conference, Mobilware 2010, Chicago, IL, USA, June 30 - July 2, pp.235-249, 2010 [16] Shabtai A, “Malware Detection on Mobile Devices”, In the Proceedings of 11th International Conference on Mobile Data Management, 2010 [17] Takamasa Isohara, Keisuke Takemori, and Ayumu Kubota, “Kernel-based Behavior Analysis for Android Malware Detection”, In Proceedings of the 7th International Conference on Computational Intelligence and Security (CIS '11), IEEE Computer Society, Washington, DC, USA, 2011 [18] A.P. Felt, M. Finifter, E. Chin, S. Hanna and D. Wagner, “A Survey of Mobile Malware in the Wild”, In the proceedings of SPSM11, October 17, 2011 [19] D. A. Heger, “Mobile Devices - An Introduction to the Android Operating Environment Design, Architecture, and Performance Implications”, 2011 [20] A.Shabtai, U. Kanonov, Y. Elovici, C. Glezer and Y. Weiss, “Andromaly: A Behavioral Malware Detection Framework for Android Devices”, J. Intell. Inf. Syst. 38, 1 February, 2012 [21] G. Dini, F. Martinelli, A. Saracino and D. Sgandurra, “MADAM: a Multi-Level Anomaly Detector for Android Malware”. In the proceedings of 6th International Conference on Mathematical Methods, Models and Architectures for Computer Network Security, MMM-ACNS 2012, St. Petersburg, Russia, October 17-19, ,pp.240-253, 2012 [22] D. J.Wu, C. H. Mao, T. E.Wei, H. M. Lee1, K. P.Wu, “DroidMat:Android Malware Detection through Manifest and API Calls Tracing”, In Proceedings of Seventh Asia Joint Conference on Information Security, pp.62-70, 2012 [23] Borja Sanz, Igor Santos, Carlos Laorden, Xabier Ugarte-Pedrero, Pablo Garcia Bringas, Gonzalo Álvarez Marañón, “PUMA: Permission Usage to Detect Malware in Android”, CISIS/ICEUTE/SOCO Special Sessions 2012: pp.289-298, 2012 [24] Aswini A M, Vinod P, “Droid Permission Miner: Mining Prominent Permissions for Android Malware Analysis”, In the proceedings of 5th IEEE International Conference
on the Applications of the Digital Information and Web Technologies (ICADIWT), 2014 [25] Ling, Fei Xia, Feature selection, http://courses.washington.edu/ling572/winter2013/slides/ class7_feature_selection.pdf, (accessed April 9, 2014) [26] Yanbing Liu, Shousheng Jia, and Congcong Xing, “A Novel Behavior-Based Virus Detection Method for Smart Mobile Terminals,” Discrete Dynamics in Nature and Society, vol. 2012, Article ID 262193, 12 pages, 2012 [27] Hyo-Sik Ham, Hwan-Hee Kim, Myung-Sup Kim, and Mi-Jung Choi, “Linear SVM-Based Android Malware Detection for Reliable IoT Services,” Journal of Applied Mathematics, vol. 2014, Article ID 594501, 10 pages, 2014
Author Biographies Aswini A M is currently pursuing M.Tech in Computer Science and Engineering with specialization in Information Systems, from SCMS School of Engineering and Technology, Kerala, India affiliated to Mahatma Gandhi University. She received her B.Tech Degree in Information Technology from Cochin University of Science and Technology in 2012. She has published number of articles in the area of Android Malware analysis. Her area of interest includes mobile malware detection approaches, data mining and pattern analysis.
Vinod P. is an Associate professor in Department of Computer Science and Engineering at SCMS School of Engineering and Technology, Kerala, India. He received his PhD in Malware Analysis and Detection methodologies from Malaviya National Institute of Technology, Jaipur, India. His current area of interest is Desktop and Android malware detection methods, intrusion detection, ethical hacking, algorithms and sentiment analysis. He has widely published 55 papers in reputed international conferences, book chapters and journals. He is also a member of technical program committees in the domain of information and network security.