Key words:Agile Methods, Extreme Programming, Object-Oriented. Metrics ... the XP class, in the first semester of 2006. ... available metrics collected by the plug-in, comprising four of six metrics from. 1 Survey available at http://www.agilcoop.org.br/portal/Artigos/Survey.pdf ... The plug-in exported an XML file with raw data.
Tracking the Evolution of Object-Oriented Quality Metrics on Agile Projects Danilo Sato, Alfredo Goldman, and Fabio Kon Department of Computer Science University of S˜ ao Paulo, Brazil {dtsato, gold, kon}@ime.usp.br
Abstract. The automated collection of source code metrics can help agile teams to understand the software they are producing, allowing them to adapt their daily practices towards an environment of continuous improvement. This paper describes the evolution of some object-oriented metrics in several agile projects we conducted recently in both academic and governmental environments. We analyze seven different projects, some where agile methods were used since the beginning and others where some agile practices were introduced later. We analyze and compare the evolution of such metrics in these projects and evaluate how the different project context factors have impacted the source code. Key words:Agile Methods, Extreme Programming, Object-Oriented Metrics, Tracking
1
Introduction
In recent years, the adoption of agile methods, such as Extreme Programming (XP) [4], in the industry has increased. The approach proposed by agile methods is based on a set of principles and practices that value the interactions among people collaborating to deliver high-quality software that creates business value on a frequent basis [5]. Many metrics have been proposed to evaluate the quality of object-oriented (OO) systems, claiming that they can aid developers in understanding design complexity, in detecting design flaws, and in predicting certain quality outcomes such as software defects, testing, and maintenance effort [8, 11, 14]. Many empirical studies evaluated those metrics in projects from different contexts [3, 6, 7, 10, 13, 17, 18] but there are a few in agile projects [1, 2]. This paper describes the evolution of OO metrics in seven agile projects. Our goal is to analyze and compare the evolution of such metrics in those projects and evaluate how the different project context factors have impacted the source code. The remainder of this paper is organized as follows. Section 2 describes the projects and their adoption of agile practices. Section 3 presents the techniques we used to collect data and the OO metrics chosen to be analyzed. Section 4 analyzes and discusses the evolution of such metrics. Finally, we conclude in Sect. 5 providing guidelines for future work.
2
Projects
This paper analyzes five academic projects conducted in a full-semester course on XP and two governmental projects conducted at the S˜ ao Paulo State Legislative Body (ALESP). Factors such as schedule, personnel experience, culture, domain knowledge, and technical skills may differ between academic and reallife projects. These and other factors were discussed more deeply in a recent study [16] that classified the projects in terms of the Extreme Programming Evaluation Framework [20]. This section will briefly describe each project, highlighting the relevant differences to this study as well as the different approaches of adopting agile methods. 2.1
Academic Projects
We have been offering an XP course at the University of S˜ ao Paulo since 2001 [9]. The schedule of the course demanded 6 to 8 hours of weekly work per student, on average. All academic projects, except for projects 3 and 5, have started during the XP class, in the first semester of 2006. The semester represents a release and the projects were developed in 2 to 4 iterations. We recommended 1 month iterations but the exact duration varied due to the team experience with the technologies, holidays, and the amount of learning required by projects with a legacy code base. – Project 1 (Archimedes): An open source computer-aided design (CAD) software focused on the needs of professional architects. We analyze the initial 4 iterations. – Project 2 (Grid Video Converter ): A Web-based application that leverages the processing power of a computational grid to convert video files among several video encodings, qualities, and formats. We analyze the initial 3 iterations. – Project 3 (Colm´eia): A library management system that has been developed during the last four offerings of the XP class. Here, we analyze 2 iterations of the project. Other system modules were already deployed. Hence, the team had to spend some time studying the existing system before starting to develop the new module. – Project 4 (Gin´ astica Laboral ): A stand-alone application to assist in the recovery and prevention of Repetitive Strain Injury (RSI), by frequently alerting the user to take breaks and perform some pre-configured routines of exercises. We analyze the initial 3 iterations. – Project 5 (Borboleta): A mobile client-server system for hand-held devices to assist in medical appointments provided at the patients’ home. The project started in 2005 with three undergraduate students and new features were implemented during the first semester of 2006. We analyze 3 iterations during the second development phase in the XP class.
2.2
Governmental Projects
The governmental schedule demanded 30 hours of weekly work per employee. In addition, some members of our team were working in the projects with partialtime availability. – Project 6 (Chinchilla): A human resources system to manage information of all ALESP employees. This project started with initial support from our team, by providing training and being responsible for the coach and tracker roles. After some iterations, we started to hand over these roles to the ALESP team and provided support through partial-time interns from our team. We analyze the initial 8 iterations, developed from October/2005 to May/2006. – Project 7 (SPL): A work-flow system to manage documents (bills, acts, laws, amendments, etc.) through the legislative process. The initial development of this system was outsourced and deployed after 2 years, when the ALESP employees were trained and took over its maintenance. Due to the lack of experience on the system’s technologies and to the large number of production defects, they were struggling to provide support for end-users, to fix defects, and to implement new features. When we were called to assist them, we introduced some of the primary XP practices, such as Continuous Integration, Testing (automated unit and acceptance tests), and Informative Workspace [4]. We analyze 3 iterations after the introduction of these practices, from March/2006 to June/2006. 2.3
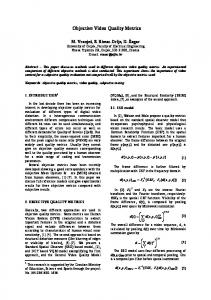
XP Radar Chart
To evaluate the level of adoption of the various agile practices, we conducted an adapted version of Kreb’s survey [12]. We included questions about the adoption of tracking, the team education, and level of experience1 . The detailed results of the survey were presented and analyzed in a recent study [16]. However, it is important to describe the different aspects of agile adoption in each project. To evaluate that, we chose Wake’s XP Radar Chart [19] as a good visual indicator. Table 1 shows the XP radar chart for all projects. The value of each axis represents the average of the corresponding practices, retrieved from the survey and rounded to the nearest integer to improve readability. Some practices overlap multiple chart axis.
3
Metrics and Method
Chidamber and Kemerer proposed a suite of OO metrics, known as the CK suite [8], that has been widely validated in the literature [3, 6]. Our metrics were collected by the Eclipse Metrics plug-in2 . We chose to analyze a subset of the available metrics collected by the plug-in, comprising four of six metrics from 1 2
Survey available at http://www.agilcoop.org.br/portal/Artigos/Survey.pdf http://metrics.sourceforge.net
Radar Axis XP Practices Programming Testing, Refactoring, and Simple Design Planning Small Releases, Planning Game, Sustainable Pace, Lessons Learned, and Tracking Customer Testing, Planning Game, and Onsite Customer Pair Pair Programming, Continuous Integration, and Collective Code Ownership Team Continuous Integration, Testing, Coding Standards, Metaphor, and Lessons Learned
Programming 10 8 6
Team
Planning
4 2
Pair
Customer
Project 1
Project 2
Project 3
Project 5
Project 6
Project 7
Project 4
Table 1. XP Radar Chart (some practices overlap multiple axis)
the CK suite (WMC, LCOM, DIT, and NOC) and two from Martin’s suite [14] (AC and EC). We were also interested in controlling for size, so we analyzed LOC and v(G). The files were checked out from the code repository, retrieving the revisions at the end of each iteration. The plug-in exported an XML file with raw data about each metric that was post-processed by a Ruby script to filter production data (ignoring test code) and generate the final statistics for each metric. – Lines of Code (LOC ): the total number of non-blank, non-comment lines of source code in a class of the system. Scope: class. – McCabe’s Cyclomatic Complexity (v(G)): measures the amount of decision logic in a single software module. It is defined for a module (class method) as e − n + 2, where e and n are the number of edges and nodes in the module’s control flow graph [15]. Scope: method. – Weighted Methods per Class (WMC ): measures the complexity of classes. It is defined as the weighted sum of all class’ methods [8]. PWe are using v(G) as the weighting factor, so WMC can be calculated as ci , where ci is the Cyclomatic Complexity of the class’ ith method. Scope: class. – Lack of Cohesion of Methods (LCOM ): measures the cohesiveness of a class and is calculated using the Henderson-Sellers method [11]. If m(F ) is the number of methods accessing a field F , LCOM is calculated as the average of m(F ) for all fields, subtracting the number of methods m and dividing the result by (1 − m). A low value indicates a cohesive class and a value close to 1 indicates a lack of cohesion. Scope: class. – Depth of Inheritance Tree (DIT ): the length of the longest path from a given class to the root class (ignoring the base Object class in Java) in the hierarchy. Scope: class. – Number of Children (NOC ): the total number of immediate child classes inherited by a given class. Scope: class.
– Afferent Coupling (AC ): the total number of classes outside a package that depend on classes inside the package. When calculated at the class level, this metric is also known as the Fan-in of a class. Scope: package. – Efferent Coupling (EC ): the total number of classes inside a package that depend on classes outside the package. When calculated at the class level, this metric is also known as the Fan-out of a class, or as the CBO (Coupling Between Objects) metric in the CK suite. Scope: package.
4
Results and Discussion
4.1
Size and Complexity Metrics: LOC, v(G), and WMC
200
4
Average Class Size
160 140 120
Average Cyclomatic Complexity
Project 1 Project 2 Project 3 Project 4 Project 5 Project 6 Project 7
180
100 80 60 40 20
Project 1 Project 2 Project 3 Project 4 Project 5 Project 6 Project 7
3.5 3 2.5 2 1.5 1
1
2
3
4
5
6
7
8
1
3
4
5
Iteration
(a) LOC
(b) v(G)
50
6
7
8
7
8
1 Project 1 Project 2 Project 3 Project 4 Project 5 Project 6 Project 7
40 35 30
Project 1 Project 2 Project 3 Project 4 Project 5 Project 6 Project 7
0.8 Average LCOM
45
Average WMC
2
Iteration
25 20 15
0.6
0.4
0.2
10 5
0 1
2
3
4
5
Iteration
(c) WMC
6
7
8
1
2
3
4
5
6
Iteration
(d) LCOM
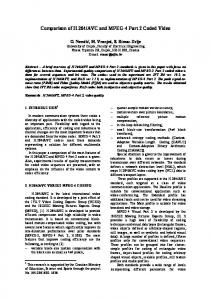
Fig. 1. Evolution of mean values for LOC, v(G), WMC, and LCOM
The mean value of LOC, v(G), and WMC for each iteration were plotted in Fig. 1(a), Fig. 1(b), and Fig. 1(c) respectively. The shapes of these 3 graphs display a similar evolution. In fact, the valur of Spearman’s rank correlation between these metrics (Table 2) shows that these metrics are highly dependent. Several studies found that classes with higher LOC and WMC are more prone to faults [3, 10, 17, 18].
Metrics Correlation (ρ) p-value LOC vs. v(G) 0.861 < 0.000001 LOC vs. WMC 0.936 < 0.000001 v(G) vs. WMC 0.774 < 0.00001 Table 2. Spearman’s Rank Correlation test results
Project 7 had a significantly higher average LOC, v(G), and WMC than the other projects. This was the project where just some agile practices were adopted. In fact, it had the most defective XP implementation, depicted in Tab. 1. This suggests that Project 7 will be more prone to errors and will require more testing and maintenance effort. By comparing Project 7 with data from the literature, we found that projects with similar mean LOC (183.27 [10] and 135.95 [17]) have a significantly lower WMC (17.36 [10] and 12.15 [17]). Other studies show similar WMC values, but without controlling for size: 13.40 [3], 11.85, 6.81, and 10.37 [18]. These values of WMC are more consistent with the other six agile projects, although our projects have smaller classes (lower LOC). We can also notice a growing trend through the iterations. This tendency is more accentuated in the initial iterations of green field projects (such as Project 1), supporting the results from Alshayeb and Li [1]. After some iterations the growing rate seems to stabilize. The only exception was Project 5, showing a decrease in size and complexity. This can be explained by the lack of focus on testing and refactoring during the first development phase. The team was not skillful on writing automated tests in J2ME before the XP class. This suggests that testing and refactoring are good practices for controlling size and complexity and these metrics are good indicators to be tracked by the team. 4.2
Cohesion Metric: LCOM
The mean value of LCOM for each iteration was plotted in Fig. 1(d), however we could not draw any interesting result from this metric, due to the similar values between all projects. In fact, the relationship between this metric and the source code quality is controversial: while Basili et al. has shown that LCOM was insignificant [3], Gyim´ othy et al. found it to be significant [10]. 4.3
Inheritance Metrics: DIT and NOC
The mean value of DIT and NOC for each iteration were plotted in Fig. 2(a) and Fig. 2(b) respectively. The use of these metrics as predictors for fault-proness of classes is also controversial in the literature [7, 10]. Table 3 shows the average DIT and NOC from several studies for comparison. None of our projects show high values for DIT or NOC, showing that the use of inheritance was not abused. Mean values of DIT around 1.0 can be explained by the use of frameworks such as Struts and Swing, that provide functionality through extension of their base classes. In particular, a large part of the code base
2
0.6 Project 1 Project 2 Project 3 Project 4 Project 5 Project 6 Project 7
Average NOC
Average DIT
1.5
Project 1 Project 2 Project 3 Project 4 Project 5 Project 6 Project 7
0.5
1
0.4 0.3 0.2
0.5 0.1 0
0 1
2
3
4
5
6
7
8
1
2
3
Iteration
4
5
6
7
8
Iteration
(a) DIT
(b) NOC
Fig. 2. Evolution of mean values for DIT and NOC Metric [3] DIT 1.32 NOC 0.23
[10] 3.13 0.92 Table 3. DIT
[18] A 1.25 0.20 and NOC
[18] B [18] C [17] 1.54 0.89 1.02 0.70 0.24 N/A mean values on the literature
[7] 0.44 0.31
from Project 5 was a mobile application, and some of its base classes inherited directly from the J2ME UI classes, resulting in a higher value of DIT. NOC was usually lower for green field projects, and a growing trend can be observed in most of the projects. This can be explained by the fact that a large part of the evolution of a system involves extending and adapting existing behavior. Coupling Metrics: AC and EC
25
60
Project 1 Project 2 Project 3 Project 4 Project 5 Project 6 Project 7
Average AC
50 40
Project 1 Project 2 Project 3 Project 4 Project 5 Project 6 Project 7
20 Average EC
4.4
30
15
10
20 5
10 0
0 1
2
3
4
5
Iteration
(a) AC
6
7
8
1
2
3
4
5
6
7
8
Iteration
(b) EC
Fig. 3. Evolution of mean values for AC and EC
The mean value of AC and EC for each iteration were plotted in Fig. 3(a) and Fig. 3(b) respectively. The shapes of these 2 graphs display a similar evolution. In fact, there is a high dependency between these metrics. Spearman’s
rank correlation of 0.971 was determined with statistical significance at a 95% confidence level (p-value < 10−14 ). Unfortunately, we can not compare our results with other studies because we used different coupling metrics at a different scope level (package). The most usual metric in the literature is CBO, which is similar to EC but calculated at the class level. Project 7 have again a higher average AC and EC than the other projects. Binkley and Schach found that coupling measures are good predictors for maintenance effort [6]. In this case, due to the outsourced development, the team was already struggling with maintenance. There were also no automated tests to act as a safety net for changing the source code. We had some improvements in the adoption of Continuous Integration [16] by automating the build and deploy process, but the adoption of automated testing was not very successful. Writing unit tests for a large legacy code project is much harder and requires technical skills. However, we had some success on the adoption of automated acceptance tests with Selenium3 and Selenium IDE3 .
5
Conclusions
In this paper, we analyzed the evolution of eight OO metrics in seven projects with different adoption approaches of agile methods. By comparing our results with others in the literature, we found that the project with less agile practices in place (Project 7) presented higher size, complexity, and coupling measures (LOC, v(G), WMC, AC, and EC), suggesting that it would be more prone to defects and would require more testing and maintenance efforts. We also found that there is a high correlation between size and complexity metrics (LOC, v(G) and WMC) and coupling metrics (AC and EC). We think that the automated collection of these metrics can support the tracker of an agile team, acting as good indicators of source code quality attributes, such as size (LOC), complexity (WMC), and coupling (AC and EC). In our study we found that these curves are smooth, and changes to the curves can indicate the progress, or lack of progress, on practices such as testing and refactoring. In future work, we plan to gather more data from different agile projects. We are interested in measuring defects and bugs after deployment to analyze their relationship with the collected metrics. We are also interested in studying similar projects, adopting agile and non-agile methods, to understand the impact of the development process on the evolution of the OO metrics.
References 1. Mohammad Alshayeb and Wei Li. An empirical validation of object-oriented metrics in two different iterative software processes. IEEE Transactions on Software Engineering, 29(11):1043–1049, 2003. 3
http://www.openqa.org/selenium and http://www.openqa.org/selenium-ide
2. Walter Ambu, Giulio Concas, Michele Marchesi, and Sandro Pinna. Studying the evolution of quality metrics in an agile/distributed project. In 7th International Conference on Extreme Programming and Agile Processes in Software Engineering (XP ’06), pages 85–93, 2006. 3. Victor R. Basili, Lionel C. Briand, and Walc´elio L. Melo. A validation of objectoriented design metrics as quality indicators. IEEE Transactions on Software Engineering, 22(10):751–761, 1996. 4. Kent Beck and Cynthia Andres. Extreme Programming Explained: Embrace Change. Addison-Wesley, 2nd edition, 2004. 5. Kent Beck et al. Manifesto for agile software development. http:// agilemanifesto.org, Feb. 2001. Last Access: Jan. 2007. 6. Aaron B. Binkley and Stephen R. Schach. Validation of the coupling dependency metric as a predictor of run-time failures and maintenance measures. In 20th International Conference on Software Engineering, pages 452–455, 1998. 7. Michelle Cartwright and Martin Shepperd. An empirical investigation of an objectoriented software system. IEEE Transactions on Software Engineering, 26(7):786– 796, 2000. 8. Shyam R. Chidamber and Chris F. Kemerer. A metrics suite for object oriented design. IEEE Transactions on Software Engineering, 20(6):476–493, 1994. 9. Alfredo Goldman, Fabio Kon, Paulo J. S. Silva, and Joe Yoder. Being extreme in the classroom: Experiences teaching XP. Journal of the Brazilian Computer Society, 10(2):1–17, 2004. 10. Tibor Gyim´ othy, Rudolf Ferenc, and Istv´ an Siket. Empirical validation of objectoriented metrics on open source software for fault prediction. IEEE Transactions on Software Engineering, 31(10):897–910, 2005. 11. Brian Henderson-Sellers. Object-Oriented Metrics: Measures of Complexity. Prentice Hall PTR, 1996. 12. William Krebs. Turning the knobs: A coaching pattern for XP through agile metrics. In Extreme Programming and Agile Methods - XP/Agile Universe 2002, pages 60–69, 2002. 13. Wei Li and Sallie Henry. Object oriented metrics that predict maintainability. J. Systems and Software, 23:111–122, 1993. 14. Robert C. Martin. Agile Software Development: Principles, Patterns, and Practices. Prentice Hall PTR, 2002. 15. Thomas J. McCabe and Arthur H. Watson. Software complexity. Crosstalk: Journal of Defense Software Engineering, 7:5–9, 1994. 16. Danilo Sato, Dairton Bassi, Mariana Bravo, Alfredo Goldman, and Fabio Kon. Experiences tracking agile projects: an empirical study. To be published in: Journal of the Brazilian Computer Society, 2007. http://www.dtsato.com/resources/ default/jbcs-ese-2007.pdf. 17. Ramanath Subramanyam and M.S. Krishnan. Empirical analysis of CK metrics for object-oriented design complexity: Implications for software defects. IEEE Transactions on Software Engineering, 29(4):297–310, 2003. 18. Mei-Huei Tang, Ming-Hung Kao, and Mei-Hwa Chen. An empirical study on object-oriented metrics. In 6th International Software Metrics Symposium, pages 242–249, 1999. 19. William Wake. XP radar chart. http://www.xp123.com/xplor/xp0012b/index. shtml, Jan. 2001. Last Access: Jan. 2007. 20. Laurie Williams, Lucas Layman, and William Krebs. Extreme Programming evaluation framework for object-oriented languages – version 1.4. Technical report, North Carolina State University Department of Computer Science, 2004.