resolution automation modes (i.e., trial-planning automation and advisory ... separation criticality index, and two degrees of freedom indices appear to be ...
AF2008109
Traffic Complexity Measurement Under Higher Levels of Automation and Higher Traffic Densities Parimal Kopardekar * NASA Ames Research Center, Moffett Field, CA 94035 Tom Prevot† San Jose State University, Moffett Field, CA 94035 and Michael Jastrzebski‡ University of California Santa Cruz, Moffett Field, CA 94035
An understanding of the complexity factors that affect controller workload under higher levels of automation for conflict detection and resolution and under higher traffic densities is critical for future operations. This paper examines traffic complexity variables under higher levels of automation where the human controller is still in the loop, but is being supported by advanced conflict detection and resolution automation. The study involved two conflict resolution automation modes (i.e., trial-planning automation and advisory automation) and three traffic densities (i.e., 1X, 2X and 3X). The results indicate that under the 1X traffic condition, controller workload was the lowest with advanced levels of automation. The complexity and workload increased progressively for the 2X and 3X traffic conditions. Results also showed that several variables such as horizontal proximity, aircraft density, separation criticality index, and two degrees of freedom indices appear to be relevant complexity measures for higher traffic densities. The degrees of freedom index for aircraft in conflict appears to be a relevant measure for higher levels of automation. Regression results show that automation resolution mode, number of aircraft, number of conflicts, separation criticality index, and degrees of freedom for aircraft in conflict represent complexity and correlate with controller workload under higher densities.
C
ontroller workload is the main factor limiting en route airspace capacity. One of the key factors
contributing to controller workload is conflict detection and resolution activity. Higher levels of automation for conflict detection and resolution are being investigated to reduce the controller workload and increase en route capacity. These levels include conflicts being detected by automation and three levels of automation for conflict resolution. Under the first level of automation for conflict resolution, the controller resolves conflicts using an automated trial planning capability.[1-3] Under the second level, the automation suggests resolution to the controller, and under the third level the automation also resolves the conflicts. It is anticipated that the controller workload will reduce under the higher levels of automation. However, there have been no studies thus far to identify the complexity variables that will contribute to the controller workload under the first and second automation options. Under the third level, the role of controller is somewhat unclear and largely reduced to monitoring. The complexity factors applicable under the first and second automation levels are not understood. The study reported in this paper focuses on the first two automation options. Multiple studies have been conducted to measure and predict controller workload under current operations. Controller workload is subjective and is an effect of air traffic complexity. A number of complexity factors affect *
Principal Investigator, NASA Ames Research Center, 210-15, Moffett Field, CA 94035, Senior Member AIAA Tom Prevot, Senior Research Engineer, San Jose State University, NASA Ames Research Center, 262-4, Moffett Field, CA 94035, Member AIAA ‡ Michael Jastrzebski, Senior Analyst, University of California, Santa Cruz †
1 American Institute of Aeronautics and Astronautics
controller workload; these factors include, but are not limited to, potential conflicts, number of handoffs, heading and speed differences, aircraft proximity to each other and sector boundaries, presence of severe weather, and traffic density.[4-8] Many of the complexity factors are related to the trial-planning automation mode of operation where there is a little or no decision support available for conflict detection and resolution, hand-offs, and data block management. The study objective was to identify complexity factors associated with the higher levels of conflict detection and resolution automation. In this study, all conflicts were detected by automation and two resolution automation levels were included: first, automated conflict detection and trial-planning automation for resolution identification, and second, automated conflict detection and advisory for conflict resolution. Additionally, the study examines the relationship of higher levels of traffic densities (e.g., 1X, 2X, and 3X) with complexity factors. Traffic complexity is defined as the effect of all factors that contribute to the difficulty of a traffic situation.
I.
Background
Controller task analysis shows that controllers conduct four main activities. These activities are monitoring, conflict detection, resolution, communications, and data entry.[9] With higher levels of automation, the monitoring and conflict detection and resolution workload is expected to reduce as the automation will be responsible for conflict detection and may be responsible for portions of the conflict resolution tasks. Additionally, communications workload will reduce considerably with data link. Moreover, the data entry workload is expected to reduce since hand-offs will be automated. This means that the complexity associated with the air traffic will significantly alter as more automation is available for controllers. This should help in increasing the en route capacity. Based on the literature review of traffic complexity research,[4-8] and automation levels and role of the controller considered in the study, it was necessary to focus on those traffic complexity variables that are still applicable for the automation levels considered in the study. The study included data link, automated conflict detection and two levels of conflict resolution. These conflict resolution levels include: controller uses trial-planner to create a resolution and automation suggests resolution but controller may change it. The paper will not explicitly address the complexity involved with the complete automation for resolution where automation resolves all conflicts, takes away majority of the controller workload, and hence removes the controller from any cognitive duties under nominal situations. The traffic complexity notion for complete automation for resolution has to be completely adapted to automation/algorithmic complexity rather than coupled with the air traffic controller workload. However, the other two automation levels still require that the controller be in the loop for the conflict resolution decision. In the first level, the conflicts are detected by automation and the controller develops a resolution with trial planning. During trial planning, the conflicts are also detected by automation. In the second level, the automation detects conflicts and suggests or advises a resolution. The controller either accepts the advisory or resolves the conflict using trial planning. Based on prior research,[4-8] the following complexity factors may be relevant to the situations when controller is responsible for conflict resolution: Number of aircraft: the number of aircraft refers to an instantaneous aircraft count for which a controller is responsible for separation assurance. Number of impending conflicts: the number of impending conflicts refers to an instantaneous count of conflicts shown in the conflict list. Aircraft density: aircraft density is defined as the number of aircraft divided by the occupied volume. It is hypothesized that the higher the aircraft density, the higher the complexity. Vertical proximity: vertical proximity for each aircraft refers to minimum vertical separation within 10 nm radius. Vertical proximity over entire airspace is average of vertical proximity values of all aircraft. Horizontal proximity index: horizontal proximity for each aircraft refers to inverse of minimum horizontal proximity at the same altitude. Horizontal proximity index over entire airspace is average of horizontal proximity values for all aircraft. Separation criticality index: separation criticality index only applies to aircraft pairs that are in conflict. It is a measure of how close the conflicting aircraft are with respect to their separation minima. Degrees of freedom index: degrees of freedom index applies to aircraft in conflict. It is based on how many constraints a conflicting pair has to resolve an impending conflict. Each aircraft can climb, descend, turn right, turn
2 American Institute of Aeronautics and Astronautics
left, speed up, and slow down (i.e., 12 degrees of freedom for a pair). The fewer the number of maneuver options, the higher the complexity. The values of these complexity variables should be use for comparative purposes across traffic conditions and resolution automation options to identify trends and relationships. The absolute values should not be used and could not be interpreted on their own.
II.
Approach
A. Simulation Design A human-in-the-simulation study was used to identify relevant complexity factors under higher levels of automation. The complexity assessment was focused on automated conflict detection, two automated conflict resolution modes under three traffic conditions. These two automated conflict resolution conditions include: automated conflict detection and controller uses trial plan to resolve the conflict, and automated conflict detection and automation provides a resolution advisory. The controller can use the advised resolution or create one using trial planning. Table 1 describes the overall simulation design and six study conditions Table 1. Overall Simulation Design Resolution Method Trial-planning Automation Advisory Automation
1X 1X
Traffic Condition 2X 3X 2X 3X
Each controller completed all six conditions (two resolution methods, each under three traffic conditions). Under the trial-planning automation resolution condition, the participant controllers used a trial-planning function. Under the advisory automation condition, the controller participants received conflict resolution advisories from the Advanced Airspace Concepts (AAC) conflict resolution algorithm.[1] All aircraft were equipped with data link. Controllers could use the algorithm to request a conflict resolution trajectory and uplink it unchanged, modify the resolution trajectory using the trial planner and then uplink it, or cancel the modification. Table 2 describes the scenario characteristics in terms of number of aircraft in a sector per hour, total number of aircraft in sectors, total number of scripted conflicts, and frequency of conflict types per hour. Two sectors were combined into one to provide adequate higher traffic and density. Table 2. Scenario Characteristics Scenario Characteristics Average number of aircraft in a sector/hour Total number of aircraft in sectors Approximate total number of scripted conflicts/hour Conflict types: • Level/level conflicts • Level/climb conflicts
1X 30 144 11 8 (73%) 0 (0%) 3 (27%)
Traffic Condition 2X 3X 60 90 282 424 68 134 53 (78%) 5 (7%) 10 (15%)
104 (78%) 11 (8%) 19 (14%)
• Level/descent conflicts
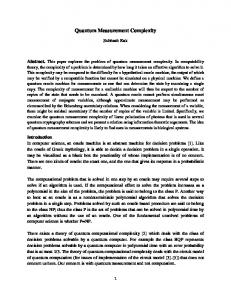
B. Controller Workstation Figure 1 contrasts en route controller display to the display prototype developed for higher levels of automation. The aircraft that are in conflict also have limited data block but their altitudes are brighter and a chevron symbol is shown next to the altitude. Displays were modified to support the added automation, and the new allocation in roles and responsibilities between controllers. Multi Aircraft Control System (MACS) 11,12 was used as the simulation platform for this study. The left-side display for radar controller indicates full data blocks of all aircraft without any automation for conflict detection and resolution. It depicts the potential clutter problem and overwhelming traffic without the automation. The right-side display for radar controller indicates only limited and dimmed data blocks for that aircraft that are not in conflict. A controller can access a full data block if necessary.
3 American Institute of Aeronautics and Astronautics
Figure 1. Full Data Block Information without Automation (Left) and Study Display with Higher Automation Levels (Right) under Higher Traffic Densities Most notable to the operators were the changes in the look and feel of the Display System Replacement (DSR) screen. The MACS framework was used to configure a controller display for future air traffic operations that would be very different from that which is in use today. In a current day DSR screen, the data block for each aircraft owned by a controller must be fully displayed while inside their sector or whenever the controller has track control. Once an aircraft is handed off and outside of their sector, the controller can then collapse, or minimize, the data block of that aircraft in order to reduce clutter and possible confusion. When increasing traffic two and three times current day levels, the display would become so cluttered with each aircraft’s data block that the individual working the sector would spend nearly the entire time trying to de-clutter their display, which would leave no time to deal with air traffic control tasks, such as separation assurance. The clutter would make it difficult even to identify any aircraft in conflict, severely constraining the participant’s ability to conduct any reasonable job. As a result, changes were made to the DSR screen that support controllers managing separation assurance by creating conflict resolution trajectories under such high traffic volumes. These changes to the DSR look and feel were done with the configuration setup panels in MACS. The data blocks were displayed according to the aircraft conflict status as follows: 1. If no conflict is detected, display as a limited data block in dark grey 2. If a conflict is detected between 9 and 12 minutes out, display as a limited data block in white 3. If a conflict is detected between 5 and 8 minutes out, display as a limited data block in yellow 4. If a conflict is detected less than 5 minutes out, display as a limited data block in orange With the aircraft in conflict highlighted, the controller could then easily access that aircraft’s full data block by clicking on the aircraft symbol. C. Assumptions The following assumptions were made regarding aircraft characteristics: A. All aircraft were equipped with a Flight Management System (FMS) and a data communication capability that enables uplink and processing of routes and altitudes (similar to Future Air Navigation System (FANS) 1/A). B. Precise position and speed information was available for all aircraft using Automatic Dependent Surveillance – Broadcast (ADS-B). C. The lateral navigation performance of the aircraft was assumed to be Required Navigation Performance (RNP) 1 or better. 4 American Institute of Aeronautics and Astronautics
D. The ground system maintained 4D trajectories for all aircraft, based on filed flight plans and planned climb, cruise and descent speeds that could be submitted pre-flight by the airline or from the flight deck. E. Trajectory changes were implemented by the controllers using trajectory-planning tools that create and distribute the appropriate trajectory amendments throughout the ground system and data link clearances to aircraft. F. A new set of flight rules was created, labeled “Managed Flight Rules (MFR).” This idea was similar to the introduction of Autonomous Flight Rules (AFR) in earlier Distributed Air-Ground Traffic Management (DAG-TM) research.[10] The responsibility for detecting conflicts involving MFR aircraft resides with the ground automation and not with the human controller or the flight crew. MFR Aircraft were cleared to fly along their trajectory unless instructed differently by the controllers. Aircraft were therefore assumed to initiate altitude changes at the top of descent or start of climb points programmed and predicted in their FMS trajectories. D. Participants Two groups participated in the study, four recently retired air traffic controllers and five aviation knowledgeable students. The two groups were selected to represent current generation air traffic controllers, and operators who grew up with automation and could be candidates for the future. Each participant was responsible for resolving all conflicts that were predicted to occur within the simulated airspace. This airspace was comprised of two combined sectors, Kansas Center Sector 90 (ZKC 90) and Indianapolis Center Sector 91 (ZID91). ZKC 90 reflects en route traffic patterns with primarily level flight traffic, whereas ZID 91 includes a larger portion of climbing and descending traffic. Each participant conducted 12 30-minute simulation runs, managing separation at three traffic levels – 1X, 2X, and 3X, and two levels of automation: trial planning and automation advises a conflict resolution but the controller decides the right resolution. The first level of automation is referred to as trial planning automation since trial plan has to be initiated manually, but automation will detect a conflict and indicate if the trial plan is conflict free. The second level of automation is referred to as advisory automation since automation advises a resolution. Each traffic and automation level combination was repeated twice providing 12 simulation runs. The participants were trained for half a day, followed by the data collection that lasted for one and a half days.
III.
Analysis
Controllers provided a workload rating based on traffic at five-minute intervals on 1 to 7 scale. The workload rating 1 referred to very low, 4 referred to moderate, and 7 referred to very high. The values of complexity variables, listed in the background section, were computed at the same five-minute intervals. The following analyses were conducted: A. Comparison of workload ratings under 1X, 2X, and 3X traffic conditions, and under the trial-planning automation and advisory automation modes. Such comparison indicates if there is a workload, and hence complexity, difference among these conditions. B. Comparison of complexity variables under three traffic conditions and under two automation resolution options. This comparison was conducted using a two-way ANOVA (Analysis of Variance) with traffic condition (with three levels – 1X, 2X, and 3X) and automation resolution option (with two levels – trialplanning automation and advisory automation). Such comparison indicates whether the differences in the levels of the factors contributed to the differences in the complexity variable values. It also identifies the complexity variables that are sensitive to increased traffic levels and higher levels of automation. C. A step-wise regression analysis was performed to identify the strength of relationships between complexity variables and workload ratings.
IV.
Results and Discussion
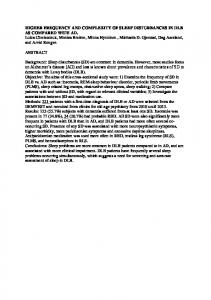
A. Workload Analysis Figure 2 shows the histograms of workload under 1X, 2X, and 3X traffic conditions and two resolution modes. The Y-axis shows the percentage of workload ratings and X-axis shows the range of workload rating. The histograms indicate that the majority of workload (and complexity) ratings under 1X traffic condition is very low as more than 90% of the workload ratings were at 1. Additionally, the workload is very similar under trial-planning 5 American Institute of Aeronautics and Astronautics
automation and advisory automation mode of operation under 1X condition. It appears that the workload ratings under 3X was higher than 1X and 2X as shown by higher percentage of workload ratings were in the category of 5, 6, and 7. The workload also appears to be higher under trial-planning automation resolution mode when compared with the advisory automation mode, particularly under 2X and 3X conditions. This provides an insight as to how the complexity variables should behave if they were to represent the workload. It implies that the complexity should increase from 1X, 2X, and 3X conditions and should be higher under trial-planning automation as compared with the advisory automation.
Figure 2. Histogram of Controller Ratings under Three Traffic Conditions and Two Resolution Modes It is interesting to note that most of the workload ratings were very low (i.e., 1) under 1X traffic condition. This is due to the fact that the controllers were operating the same level of traffic as they do today but with data link, and automated conflict detection and automation for conflict resolution. Two main workload factors of current-day operations are communications and conflict management. As automation was supporting these functions, the workload was considerably lower. The same finding was observed under the assessment of MITRE’s performancebased air traffic management.[13, 14] B. Analysis of Variance of Complexity Variables A two-way analysis of variance (with traffic condition and resolution mode as two factors) was conducted on the following complexity variables: A. Aircraft density B. Horizontal proximity index C. Vertical proximity D. Separation criticality index E. Degrees of freedom index for aircraft in conflict F. Degrees of freedom index for individual aircraft An analysis of variance was not conducted on the number of aircraft and the number of conflicts since they were independent variables. A significance level (∝) value of 0.01 was used to determine if a factor was significant. a. Aircraft Density Table 3 shows the results of a two-factor analysis of variance for aircraft density as a dependent variable. It indicates that only the traffic condition was significant and resolution mode was not found to be significant. This implies that the aircraft density was only affected by traffic condition.
6 American Institute of Aeronautics and Astronautics
Table 3. Two-Way Analysis of Variance for Aircraft Density Source Traffic condition Resolution method Traffic condition*Resolution method
Mean Square 1.69X 10⁻⁵ 2.33X 10⁻⁶ 4.91X 10⁻⁶
F 6.08 0.83 1.76
p-value 0.002 0.36 0.172
Significance Yes No No
In order to study how the aircraft density was affected by the traffic condition, the aircraft density means were plotted. Table 3 shows the mean aircraft density across three traffic conditions. The figure shows that the aircraft density increased as the traffic increased from 1X to 3X, which was expected since more aircraft were operating in the same airspace.
Figure 3. Mean Aircraft Density across Traffic Conditions The ANOVA results and Figure 3 indicate that the mean aircraft density increases from 1X to 3X traffic conditions and resolution mode does not affect the mean aircraft density. The increase in the mean aircraft density is because as the traffic increases from 1X to 3X, the more number of aircraft operate in the same volume of airspace. b. Horizontal Proximity Index Table 4 shows the results of a two-factor analysis of variance for horizontal proximity index as a dependent variable. It indicates that only traffic condition factor was significant implying that horizontal proximity index was not affected by resolution mode and was only affected by the varying densities of traffic. Table 4. Two-Way Analysis of Variance for Horizontal Proximity Index Source Traffic condition Resolution method Traffic condition*Resolution method
Mean Square 0.012 0.000 9.09 X 10 -5
F 129.29 3.31 0.95
p-value 0.0 0.069 0.385
Significance Yes No No
In order to study how horizontal proximity index was affected by the traffic condition, the means were plotted. Figure 4 shows the mean horizontal proximity across three traffic conditions. The figure shows that horizontal proximity index increased as traffic increased indicating that the aircraft were flying closer to each other under the 3X traffic condition.
7 American Institute of Aeronautics and Astronautics
Figure 4. Mean Horizontal Proximity Index across Traffic Conditions The ANOVA results and Figure 3 indicate that the mean horizontal proximity index increases from 1X to 3X traffic conditions and resolution mode does not affect the horizontal proximity. The increase in the horizontal proximity index (or the reduction in inter-aircraft distance) is associated with more aircraft operating in the same volume of airspace and closer to each other as the traffic increases from 1X to 3X. c) Vertical Proximity Table 5 shows the results of a two-factor analysis of variance for vertical proximity as a dependent variable. It indicates that the independent variables (i.e., traffic condition and resolution method) and their interaction were not significant, implying that the vertical proximity was not affected by either traffic condition or by resolution method. Table 5. Two-Way Analysis of Variance for Vertical Proximity Source Traffic condition Resolution method Traffic condition*Resolution method
Mean Square 33.18 7.713 25.88
F 1.06 0.25 0.827
p-value 0.347 0.620 0.438
Significance No No No
A possible reason why the vertical proximity was not impacted is that the aircraft would still continue to operate at their desired altitudes regardless of the resolution method or traffic condition. Additionally, the vertical separation minimum was still kept at 1000 ft. thereby not affecting the vertical proximity. d) Separation Criticality Index Table 6 shows the results of a two-factor analysis of variance for separation criticality index. It indicates that only the traffic condition was a significant factor indicating that the separation criticality index was affected by it. Table 6. Two-Way Analysis of Variance for Separation Criticality Index Source Traffic condition Resolution method Traffic condition*Resolution method
Mean Square 1225180.73 38811.63 29016.57
F 184.20 5.83 4.36
p-value 0.00 0.016 0.013
8 American Institute of Aeronautics and Astronautics
Significance Yes No No
In order to study how the separation criticality index was affected by traffic condition, the means were plotted. Figure 5 shows the mean separation criticality index across three traffic conditions. The figure shows that the separation criticality index increased as the traffic density increased. This indicates that the aircraft were closer to their separation minima as the traffic increased from 1X, 2X, and 3X. This is somewhat expected, as the traffic increases, the average distance between aircraft decreases.
Figure 5. Mean Separation Criticality Index across Traffic Conditions The ANOVA results and Figure 5 indicate that the mean separation criticality index increases from 1X to 3X traffic conditions and resolution mode does not affect the separation criticality index. The increase in the mean separation criticality index is because as the traffic increases from 1X to 3X, the closer they operate. The closer the aircraft operate with each other, the closer they are with respect to their separation minima. e) Degrees of Freedom Index for Aircraft in Conflict Table 7 shows the results of a two-factor analysis of variance for degrees of freedom index for aircraft in conflict as a dependent variable. It indicates that the independent variables (i.e., traffic condition and resolution method) and their interaction were significant; implying that the degrees of freedom index for aircraft in conflict was affected by both traffic condition and resolution method. Table 7. Two-Way Analysis of Variance for Degrees of Freedom Index for Aircraft in Conflict Source Traffic condition Resolution method Traffic condition*Resolution method
Mean Square 354951.92 38197.66 2868.74
F 93.18 10.02 7.53
p-value 0.0 0.002 0.001
Significance Yes Yes Yes
In order to study how the degrees of freedom index was affected by the two factors and their interaction, the means were plotted. Figure 6 shows the mean degrees of freedom index across three traffic conditions for the two resolution mode options. The figure shows that degrees of freedom index increased with increase in traffic density. Additionally, the lines for trial-planning automation and advisory automation resolution modes were not parallel, indicating the presence of interaction. It appears that for 3X traffic condition, under the trial-planning automation mode, the index increased much more rapidly than under the advisory automation mode. This could be because under the trial-planning automation mode, identifying conflict resolution was time-consuming task. Therefore, many 9 American Institute of Aeronautics and Astronautics
conflicts remained with less than five minutes to loss of separation. This short time to loss of separation limited the choices under the trial-planning automation mode and hence increased the degrees of freedom index particularly under the 3X condition. Under trial-planning mode, the controllers had to identify a conflict-free path, then uplink the clearance to the flight deck, which became overwhelming under 3X condition.
Figure 6. Mean Degrees of Freedom Index for Aircraft in Conflicts under Three Traffic Conditions The ANOVA results and Figure 6 indicate that the degrees of freedom index for aircraft in conflict increases from 1X to 3X traffic conditions. This finding is interesting and implies that as the traffic density increases, the difficulty in identifying resolution options increase as the number of maneuver options decrease. Additionally, the resolution mode seems to affect the degrees of freedom for aircraft in conflict and it appears to be higher under trialplanning automation as compared with the advisory automation, particularly at 3X traffic condition. Furthermore, the trial-planning mode appears to become more constraining than the advisory automation most likely because it does not allow for the timely solution of all conflicts at a high traffic density.
V.
Extension of Degrees of Freedom Index Concept for Highly Automated Operations
Furthermore, degrees of freedom available for an individual aircraft could be considered an indicator of the complexity under a highly automated system where the conflict detection and resolutions are completely automated. If an aircraft has at least one degree of freedom available, should it go into a conflict state, then the situation could be resolved. However, if an aircraft does not have any degree of freedom left, and should a conflict occur, then the complexity of that situation is very high. So the notion of degree of freedom could be extended to the automated separation management operations as well. In order to examine if the degrees of freedom index could be applicable under higher automation levels, the degrees of freedom index was computed at five-minute intervals for individual aircraft, regardless of their potential conflict status. For each aircraft, a degree of freedom index is computed to determine if the aircraft could climb, descend, turn right or turn left thus maximum of four degrees of freedom for each aircraft The degrees of freedom index is based on how many degrees of freedom are available, the fewer the available degrees of freedom, the higher the degrees of freedom index. Similar to previous analysis, the degrees of freedom index was compared using a two-factor analysis of variance. Table 8 shows the results of a two-factor analysis of variance for the degrees of freedom index for individual aircraft (not just the ones in conflict) as a dependent variable. It indicates that the only traffic condition factor was significant, implying that the degrees of freedom index was affected by only traffic condition and not by resolution method.
10 American Institute of Aeronautics and Astronautics
Table 8. Two-Way Analysis of Variance for Degrees of Freedom Index of Individual Aircraft Source Traffic condition Resolution method Traffic condition*Resolution method
Mean Square 654666.87 14345.49 4004.29
F 291.01 6.377 1.780
p-value 0.0 0.012 0.17
Significance Yes No No
In order to study how the degrees of freedom index for individual aircraft was affected by the traffic condition, the means were plotted. Figure 7 shows the mean degrees of freedom index across three traffic conditions. The figure shows that as the traffic density increased from 1X to 3X the degrees of freedom index for individual aircraft increased as well.
Figure 7. Mean Degrees of Freedom Index for Individual Aircraft across Traffic Conditions The ANOVA results and Figure 7 indicate that the mean degrees of freedom index for individual aircraft increases from 1X to 3X traffic conditions and resolution mode does not affect the degrees of freedom index for individual aircraft. The increase in the mean degrees of freedom index for individual aircraft is because as the traffic increases from 1X to 3X, the maneuver flexibility for each aircraft reduces.
VI.
Relationship of Controller Workload Rating and Complexity Variables
The above analysis indicated that values of complexity variables increase across traffic conditions (1X, 2X, and 3X) and appear to have higher complexity under trial-planning automation as compared with the advisory automation mode. Figure 8 shows that the median workload rating§ increases across traffic conditions. Although the median workload is the same under the 1X traffic condition where as under 2X and 3X traffic condition, the workload associated with the trial-planning automation mode appears to be higher as compared with the workload under advisory automation mode. Particularly, it appears that higher the traffic density, the higher the difference in workload under trial planning automation and advisory automation.
§
Workload rating being an ordinal scale, median is used as a statistic of interest. 11 American Institute of Aeronautics and Astronautics
Figure 8. Median Workload Rating under Two Resolution Modes across Three Traffic Conditions In order to determine if the complexity variables were statistically correlated with the workload ratings, Spearman’s correlation coefficients and their significance were computed. Table 9 shows complexity variables with statistically significant correlation coefficients. A level of significance (∝ = 0.01) was used. The complexity variables that were significantly correlated with the workload ratings and with higher than 0.5 correlation coefficient were: number of aircraft, number of conflicts, horizontal proximity, degrees of freedom index for aircraft in conflict, degrees of freedom index for individual aircraft, and separation criticality index. These significant correlations and their positive correlations reinforce the notion that some complexity variables are related to the complexity and controller workload. Complexity variables such as aircraft density, vertical proximity, and fraction of climbing or descending were not significantly correlated with workload ratings. Prior studies5-8 have shown that these variables were significantly related with workload. However, the operational paradigm in those studies was different where controllers were in charge of detecting and resolving conflicts. Table 9. Statistically Significant Correlation Coefficients between Workload Complexity Rating and Complexity Variables Complexity Variable
Correlation coefficient
Number of aircraft
Number of conflicts
0.67
0.76
Horizontal proximity index
0.50
Separation criticality index
0.66
Degrees of freedom index for aircraft in conflict
Degrees of freedom index for individual aircraft
0.55
0.64
In order to determine how well complexity variables represent controller workload ratings, a multiple linear regression was performed. A step-wise regression method was used. The regression results identified following statistically significant complexity variables:
resolution mode number of aircraft number of conflicts separation criticality index degrees of freedom index for aircraft in conflict
The coefficient of determination (R2), which indicates the strength of relationship between workload ratings and complexity variables, was found to be 0.61 (R = 0.78). 12 American Institute of Aeronautics and Astronautics
Results of complexity related studies of current operations have shown that the range of R2 values is between 0.84 (for Denver Center) and 0.51 (for four Centers).[7] Interestingly, variables such as horizontal proximity and degrees of freedom index for individual aircraft were not significant in the regression model. A closer examination of these variables indicates a very high correlation of these variables with the variables that were statistically significant in the regression model. For example, correlation between degrees of freedom index for individual aircraft and degrees of freedom for aircraft pairs that are in conflict was 0.85. Similarly, the horizontal proximity index was highly correlated with separation criticality index with a correlation of 0.81. Additionally, the degree of freedom for individual aircraft was highly correlated with horizontal proximity with a correlation coefficient of 0.85. It is therefore plausible that because of their high correlations with other complexity variables, horizontal proximity index and degrees of freedom index individual aircraft become redundant. It appears that linear regression using resolution mode, number of aircraft, number of conflicts, separation criticality index, and degrees of freedom index for aircraft in conflict is useful for predicting complexity.
VII.
Conclusion
The study has three critical findings. First, a set of complexity variables that is relevant for higher traffic densities were identified. Second, complexity variables specifically sensitive to higher levels of conflict detection and resolution automation levels were identified. Third, a strength of relationship, using a coefficient of determination between these variables and controller workload ratings, was established to validate these variables. Based on prior studies, a set of complexity variables which were relevant for higher levels of conflict detection and resolution automation was identified. This initial set included: aircraft density, horizontal proximity index, vertical proximity, separation criticality index, and degrees of freedom index for aircraft in conflict. Controller workload ratings and the values of these complexity variables increased as the traffic density increased from 1X to 3X traffic implying that these complexity variables accurately followed the trend in workload ratings. Additionally; the horizontal proximity index, separation criticality index, two degrees of freedom indices were significantly correlated with controller ratings implying that these variables represent controller workload rather well. Furthermore, average workload ratings and average degrees of freedom index for aircraft in conflict were higher under trial-planning automation as compared with their values under the advisory automation. This implies that the degrees-of-freedom index for aircraft in conflict is sensitive to changes in workload associated with the two conflict resolution automation levels. Using multiple linear regression analysis, the strength of relationship between complexity variables and workload ratings was examined. Complexity variables that were found to be significant in the regression analysis were resolution mode, number of aircraft, number of conflicts, separation criticality index, and degrees of freedom index for aircraft in conflict. These five complexity variables were able to capture the controller workload ratings rather well (R = 0.78 and R2 = 0.61). In conclusion, the study identified a set of complexity variables that are suitable for higher traffic densities and higher levels of conflict detection and resolution automation.
Acknowledgment This work is sponsored by NASA’s NextGen Airspace Project, a Project of the Airspace Systems Program.
References 1
Erzberger, H., 2004, Transforming the NAS: The Next Generation Air Traffic Control System, 24th International Congress of the Aeronautical Sciences, Yokohama, Japan, August 2005. 2 McNally, D. and Gong, C., 2007, Concept and Laboratory Analysis of Trajectory-Based Automation for Separation Assurance, Air Traffic Control Quarterly, pp 35-63. 3 Prevot, T., Homola, J., and Mercer, J., 2008, Human-in-the-loop Simulation of Ground-based Automation for Separation Assurance for NextGen, Submitted to AIAA ATIO. 4 Arad, B. A., 1964, The Control Load and Sector Design, Journal of Air Traffic Control, pp 13-31. 5 Mogford, R., Guttman, J Morrow, S., & Kopardekar, P., 1995, The complexity construct in Air Traffic Control: A review and Synthesis of the Literature, DOT/FAA/CT-TN-95/22, FAA Technical Center: Atlantic City. 6 Chatterji, G.B. & Sridhar, B., 2001, Measures for Air Traffic Controller Workload Prediction, Proceedings of the First AIAA Aircraft Technology, Integration, and Operations Forum, Los Angeles, CA. 7 Kopardekar, P. & Magyarits, S., 2003, Measurement and Prediction of Dynamic Density, 5th USA/Europe Air Traffic Management 2003 R&D Seminar, Budapest, Hungary. 13 American Institute of Aeronautics and Astronautics
8
Kopardekar, P., Schwartz, A., Rhodes, J., & Magyarits, S., 2007, Airspace Complexity Measurement: An Air Traffic Control Simulation Analysis, 7th USA/Europe Air Traffic Management 2007 R&D Seminar, Barcelona, Spain. 9 Rodgers, M. D. & Drechsler, G. K., 1993, Conversion of the CTA Inc., En Route Operations Concepts database into a formal sentence outline job task taxonomy. DOT/FAA/AM-93/1. Washington, D. C., Department of Transportation, Federal Aviation Administration, Office of Aviation Medicine. 10 Barhydt, R., & Kopardekar, P., 2005, Joint NASA Ames/Langley Experimental Evaluation of Integration AirGround Operations for En Route Free Maneuvering, 6th USA/Europe Air Traffic Management R&D Seminar, Baltimore, MD. 11 Prevot, T. ,2002, Exploring the Many Perspectives of Distributed Air Traffic Management - The Multi Aircraft Control System MACS, In S.Chatty, J. Hansman, and G. Boy (Eds.) Proceedings of the International Conference on Human-Computer Interaction in Aeronautics, HCI-Aero 2002 AAAI Press, Menlo Park, CA pp. 159-157. 12 Prevot, T. & J. Mercer, 2007, MACS: A Simulation Platform for Today’s and Tomorrow’s Air Traffic Operations, AIAA. 13 Rozen, N.E., 2007, Performance-based Air Traffic Management: Evaluation of En Route Benefits, 7th AIAA Aviation Technology, Integration and Operations (ATIO) Conference, Belfast, Northern Ireland. 14 Celio, J., 2007, Performance-based ATM: Concept and Service Provider Roles and Responsibilities, 7th AIAA Aviation Technology, Integration and Operations (ATIO) Conference, Belfast, Northern Ireland.
14 American Institute of Aeronautics and Astronautics