Oct 25, 2017 - residential groups and permanent settlements increased in frequency ...... comprises groups who lived in a large, agglomerated settlement with.
Author Query
U
N C
O
R
R
EC
TE D
PR
O
O
FS
AQ1 Author – are bold values significant? Footnote to be added?
Chapter No.: 1 Title Name: � Comp. by: Date: 25 Oct 2017 Time: 08:32:18 PM Stage: WorkFlow: 0003342911.INDD 1
�
0003342911.INDD Page Number: 1 25-10-2017 20:32:18
91
FS
5 Temporal and Geographic Variation in Robusticity
O
Brigitte Holt1, Erin Whittey1, Markku Niskanen2, Vladimir Sládek3, Margit Berner4, and Christopher B. Ruff5 1
Department of Anthropology, University of Massachusetts, Amherst, MA, USA Department of Archaeology, University of Oulu, Oulu, Finland 3 Department of Anthropology and Human Genetics, Faculty of Science, Charles University, Prague, Czech Republic 4 Department of Anthropology, Natural History Museum, Vienna, Austria 5 Center for Functional Anatomy and Evolution, Johns Hopkins University School of Medicine, Baltimore, MD, USA
PR
O
2
TE D
5.1 Introduction
N C
O
R
R
EC
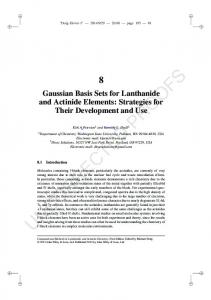
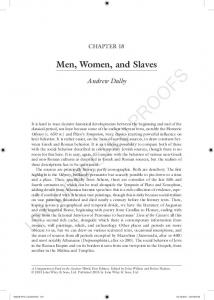
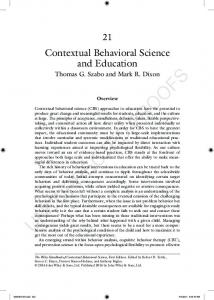
Modern human skeletons are less robust than those of our Pleistocene ancestors, probably the result of a temporal decline in physical activity and muscle strength (Ruff et al., 1993; Ruff, 2005; see Figure 5.1). Much of the earlier decline in overall lower limb bone strength relative to body size, prior to the Upper Paleolithic, may be attributable to changes in body shape (Puymerail et al., 2012; Trinkaus and Ruff, 2012). However, more recent declines appear to be linked to changes in subsistence behavior, including in particular the adoption of a more sedentary lifestyle (Frayer, 1981; Jacobs, 1985; Holt, 2003). Over the past 30 years, numerous studies have illustrated changes in skeletal robusticity that have occurred in the context of subsistence or socioeconomic transitions within the Holocene (see Ruff and Larsen, 2014, for a summary; also see below). These studies, however, always cover a relatively limited arc of time. The paucity of well‐preserved skeletal samples from most regions of the world prevents extensive chronological studies. Europe, however, represents a notable exception. In Europe, nearly 40 000 years of uninterrupted occupation and a long history of prehistoric research have yielded a uniquely rich skeletal record that spans every economic transition until the present. Our purpose in this chapter is to show how European limb robusticity changed in response to the major socio‐ economic transitions of the period spanning approximately 40 000 years to the present.
U
5.2 Background 5.2.1 Limb Bone Robusticity and Subsistence Changes Analyses of Late Pleistocene and early Holocene human skeletal remains show that long bone diaphyseal robusticity patterns track changes and variability in subsistence behavior (Ruff, 2000; Stock and Pfeiffer, 2001; Holt et al., 2000; Holt, 2003; Sladek et al., 2006a,b; Stock, 2006; Shackelford, 2007; Marchi, 2008). For instance, differences in postcranial robusticity of recent Skeletal Variation and Adaptation in Europeans: Upper Paleolithic to the Twentieth Century, First Edition. Edited by Christopher B. Ruff. © 2018 John Wiley & Sons, Inc. Published 2018 by John Wiley & Sons, Inc.
Chapter No.: 1 Title Name: � Comp. by: Date: 25 Oct 2017 Time: 08:32:18 PM Stage: WorkFlow: 0003342911.INDD 91
�
0003342911.INDD Page Number: 91 25-10-2017 20:32:19
Skeletal Variation and Adaptation in Europeans
(b) 100
100
50
1000
100
10
1
.1
Log (1000 years before present)
80
FS
150
60
40
1000
100
10
O
200 Femoral cortical area/body size
Femoral section modulus/body size
(a)
1
.1
Log (1000 years before present)
O
92
PR
Figure 5.1 Temporal changes in femoral strength (a) and cortical area (b) standardized by body size in early Homo (squares) and means for three modern human samples (open stars: Pecos archaeological and modern East African sample means ± 2 SD; filled stars: modern US white sample mean). Reprinted with permission from Ruff, 2005.
U
N C
O
R
R
EC
TE D
hunter‐gatherer groups, compared to agriculturalists from the same region, reflect variation in levels of activity and lower limb loading (Larsen, 1995; Ruff et al., 1984; Marchi et al., 2006, 2011). Compared to agricultural groups, foragers tend to have thicker femoral diaphyseal cortices (Ruff et al., 1993) and femoral shafts that have relatively wide antero‐posterior (A‐P) dimensions (Ruff et al., 1984; Ruff, 1987). Similar results were also reported by Stock and Pfeiffer (2001), who found that predominantly terrestrial foragers had more robust femora and tibiae compared with the stronger humeri and clavicles of marine‐adapted island foragers. Similarly, Weiss (2003) reported that native North American male ‘ocean‐rowers’ exhibited significantly more robust humeri than ‘river‐rowers’ and groups that did not paddle at all. These studies demonstrate clearly that diaphyseal cross‐sectional rigidity and shape patterns reflect habitual mechanical loads and can, therefore, be used to infer subsistence behavior. A number of studies have shown that the shift from hunting gathering to food production is associated with declining upper and lower limb bone strength, probably the result of decreased mobility and workload in agriculturalists (Ruff and Larsen, 2001; Ruff and Hayes, 1983a,b). Other studies, however, found that agriculturalists exhibited decreased relative lower limb strength but more robust humeri than their foraging predecessors (Bridges, 1989; Bridges et al., 2000). In this case, food production reduced mechanical loads on the legs but increased the workload involving upper limb bones. This lack of consistency between subsistence strategies and skeletal robusticity patterns suggests the decline in skeletal robusticity has not been linear, and that simple subsistence categories do not always reflect the types of mechanical loadings applied to bones. While the elevated robusticity of Paleolithic hunter‐gatherers clearly reflects their strenuous lifestyles (Shaw and Stock, 2013), cultural factors such as subsistence technology, gender roles and status, as well as environmental characteristics such as terrain may modify observed differences in later groups. 5.2.2 Cultural and Economic Factors Europe provides an unparalleled opportunity to examine long‐term trends in limb bone robusticity in the context of major economic and social changes that have characterized the last 40 000 years in the same geographic region. While such a study cannot take into account
0003342911.INDD 92
25-10-2017 20:32:19
Temporal and Geographic Variation in Robusticity
93
U
N C
O
R
R
EC
TE D
PR
O
O
FS
i ndividual‐level behavior, and must of necessity paint relatively broad strokes, the rich European archeological record allows the reconstruction of important aspects of lifeways and economic and social behavioral characteristics for each time period. Many of these behaviors, such as mobility, craft specialization, food production intensification through mechanized means, and urbanization imply varying physical activity levels that will affect skeletal robusticity. Our goal in this chapter is to outline some of the major temporal changes in skeletal robusticity from the Paleolithic to modern times in light of the unprecedented cultural developments that shaped European populations. We begin by reviewing these events. The Upper Paleolithic (UP), the period widely associated with the spread of modern humans and of modern patterns of behavior, emerged in Europe during the last Würm‐Weichsel Interpleniglacial, around 40 kya, (Straus, 1995; van Andel et al., 2003; Mellars, 2006). During that time, a gradual decline in temperature resulted in the buildup of large ice sheets over most of northern Europe and lower sea levels, a process that cumulated during the Last Glacial Maximum (LGM), around 20 kya, the time of lowest sea levels. Temperature began to rise after 16 kya, as ice sheets retreated. While technology began playing a role in human adaptive strategies around 2.5 million years ago, the proliferation of techno‐complexes after 40 000 BP points to the increased prevalence of culture as an environmental buffer (Gamble et al., 2004). Although the UP is generally associated with major technological innovations, none of these innovations figures systematically until after the LGM (Straus, 1995). The spearthrower and harpoon, for instance, do not appear until after the LGM (Schmitt et al., 2003). The appearance of these technologies, and of distinct organizational systems following the LGM, form the basis for the traditional division of the Upper Paleolithic into two distinct phases – Early (EUP), from 40–20 kya, and Late (LUP) Upper Paleolithic, from 19 kya to the end of the Last Glacial, around 10 kya. Numerous indicators suggest that EUP groups were highly mobile, covering large territory for procurement of raw material and maintenance of intergroup relations (Gamble, 1986; Kozlowski, 1991; Svoboda et al., 1996; Flébot‐Augustin, 1997; Negrino and Starnini, 2003). Climatic deterioration and shorter growing seasons associated with the LGM, compounded by demographic stress caused by the influx of populations into ice age refugia (Mellars, 1985; Clark and Straus, 1986; Jochim, 1987; Mussi and Zampetti, 1988), led to decreased resource reliability (Straus, 1995). The LUP record suggests that human groups, faced by demographic and environmental pressures, were forced to intensify resource exploitation. The development and refinement of throwing technology, such as points that were probably used as projectiles thrown by the newly introduced spearthrower (atl‐atl) indicate diversification of subsistence (Freeman, 1973; Straus, 1990, 1993). Diversification of the food base to include fish, shellfish, and birds suggests a need to cope with demographic stress by adding low‐yield/high‐cost foods (Straus et al., 1981; Straus, 1986; Stiner, 2001; Stiner et al., 1999). While uneven distribution of resources generally results in higher foraging mobility (Winterhalder, 1981; Keeley, 1988), reduced availability of exploitable territory forced groups to intensify the exploitation of existing resources (Straus and Clark, 1986; Stiner et al., 1999). The presence of relatively sedentary, complex hunter‐gatherer groups during the later part of the LUP (Mellars, 1985; Jochim, 1987) attests to further reduction in mobility. Previous work on UP skeletal robusticity showed increased upper limb robusticity (Churchill 1994; Churchill et al., 2000) and increased lower limb diaphyseal circularity (Holt, 2003), possibly linked to resource intensification and reduction in mobility at the LGM. The major climatic changes initiated around 16 kyr signaled the disappearance of large herds of reindeer, horse, and bison and the onset of the Mesolithic, the period between the end of the Pleistocene and introduction of agriculture, when the last European foragers lived (Milisauskas, 2002a). Systematic incorporation of shellfish allowed for the exploration of new and expanding estuary and riverine environments (Straus, 1995). Although mobility remained high, large residential groups and permanent settlements increased in frequency towards the Late Mesolithic
0003342911.INDD 93
25-10-2017 20:32:19
94
Skeletal Variation and Adaptation in Europeans
U
N C
O
R
R
EC
TE D
PR
O
O
FS
(Price, 1987; Jochim, 2002; Brumfiel, 1987). This, and the shift away from large game in favor of smaller game and aquatic resources, likely resulted in further decreases in skeletal robusticity. The European Neolithic ranges from about 7000–4050 cal BP and, as elsewhere in the world, is defined by the appearance of agriculture, ceramics, and markedly increased sedentism (Milisauskas, 2002a,b). Although the use of throwing technologies declined, new implements such as stone‐ground tools, hoes, digging sticks, and axes required substantial bimanual physical effort (Milisauskas, 2002a,b; Marchi et al., 2006). In the Southeast United States, the shift from hunting to agricultural technologies in fact correlates with increased upper limb robusticity, probably reflecting a rise in the use of agricultural technology (Bridges, 1989). Starting around the middle part of the Neolithic, the introduction of draft animals and copper allowed for intensification of wheat and barley, and for the development of complex technologies such as the ox‐drawn plow and wheeled vehicles (Milisauskas and Kruk, 2002a). While further declines in lower limb robusticity can be expected during the Neolithic, the combined effects of technological improvements on the one hand, and the shift to labor intensive food sources on the other hand, may produce patterns of upper limb change that are more difficult to interpret. Indeed, intensification of crops in Late Neolithic may arguably result in increased upper limb robusticity. While the use of metal initiates during the later Neolithic, metallurgy became much more systematic in the Bronze Age (4350–2950 cal BP). While the majority of people continued a rural subsistence economy based on Neolithic technologies such as ox‐drawn plows, increased metal mining and smithing imply the rise of trade specialization. More efficient metal farming technologies allowed further crop intensification and increased productivity, heralding major socioeconomic and power structure transformations by the middle Bronze Age. Rather than universally improving life conditions, increased food productivity led to increased population size and rising inequality in resource distribution and social stratification. Rich caches of weapons often associated with high‐status burials point to increased warfare and the rise of an elite male warrior class (Whitehouse, 2001). Such socioeconomic changes may predict increased variability in skeletal robusticity patterns, especially with respect to the upper limb. Food staple intensification, increased social complexity and stratification observed during the Bronze Age become much more marked during the Iron Age (2250–1650 cal BP). The adoption of iron resulted in more efficient farming tools, such as hoes, shovels, iron plowshares and axes, making agriculture less physically demanding and more productive and facilitating unprecedented demographic growth (Boserup, 1965, 1975; Peroni, 1979; Collis, 1984; Wells, 1990; Guidi and Piperno, 1992). The Iron Age also sees the appearance of proto‐urban centers in the form of large settlements or city‐states controlling surrounding farms and villages (Milisauskas, 2002a). The increase in social complexity and stratification that developed in the Iron Age led to craft specialization and unequal distribution of labor (Kristiansen, 1987, 2000; Kristiansen and Rowlands, 1998; Henrich and Boyd, 2008). This is expected to impact the variability in type and intensity of the activities performed by the Iron Age population (Sparacello et al., 2011). The fall of the Roman Empire in the 5th century signals the beginning of the Medieval period, divided here into early (500–999 AD) and late (1000–1599 AD) periods. Many of the large urban settlements that flourished in late Iron Age disintegrated, and major parts of Europe, such as England and Germany, become almost entirely rural in the early Medieval period (Duby, 1976; Dyer, 1995). The economy of early Medieval Europe remained primarily based on farming and herding. With the ever‐growing demand for iron to improve farming technology, craft specialization increased further (Duby, 1976). While the use of oxen‐drawn and, later, horse‐drawn plows became more prevalent, these required significant manual labor to dig through superficial soil layers into the rich and heavy deeper clays. The eventual addition of wheeled front sections to plows and the spread of water and windmills (Duby, 1976; Campbell, 1995) further reduced the physical demands of farming. Paradoxically, these improvements
0003342911.INDD 94
25-10-2017 20:32:19
Temporal and Geographic Variation in Robusticity
95
TE D
PR
O
O
FS
also raised the cost of farming technology, and more sophisticated plows and large investments such as mills were beyond the means of many peasants, resulting in further social inequalities (Duby, 1976; Campbell, 1995). Even in relatively well‐developed areas, mills were not uniformly available and manual milling remained the norm (Duby, 1976). Hence, a combination of high levels of physical labor and unequal access to significant technological improvements may result in little to no decline in skeletal robusticity. The Early Modern period (1600–1899 AD) encompasses the major social and economic transformations engendered by the Industrial Revolution, a time of unprecedented mechanization and urbanization, and movement of many farming populations into factories. The introduction of mechanized and, eventually, electric devices had profound consequences in all sectors of life. Implements such as steam tractors and washing machines, for instance, reduced the amount of strenuous manual labor in areas such as farming and the household (Cowan, 1999; Musson and Robinson, 1969). The Industrial Revolution, however, also brought about very poor environmental and harsh child labor conditions in some areas of Europe (Humphries, 2010). Elevated levels of physical activity in pre‐ and post‐adolescent periods of active bone formation could result in higher adult skeletal robusticity (Ruff et al., 1994). Nevertheless, we expect that the introduction of mechanized means in all spheres of life should be reflected in significant declines in robusticity in Early Modern Europeans. This brief survey of the behavioral, social, economic and technological transformations that have shaped the past 40 000 years of European prehistory and history allows the formulation of a number of hypotheses regarding the impacts of these changes on limb bone robusticity:
U
N C
O
R
R
EC
1) Overall skeletal robusticity and skeletal markers of mobility will decline markedly from Upper Paleolithic to Mesolithic, and again in the Neolithic with the shift from hunting‐ gathering to food production. Apart from some local geographic variations, there should be little further change in these parameters from Neolithic through Medieval periods. 2) Skeletal robusticity and markers of mobility will decline further in the Early Modern and Recent periods, as urbanization and sedentism increase and physical tasks are increasingly taken over by animal labor and mechanization. 3) Levels of upper limb robusticity should remain relatively high through the Bronze Age, and decrease significantly in Iron Age and again in Early Modern and Recent, reflecting increased use of mechanized means. We also expect that upper limb strength may increase somewhat between Early and Middle/Late Neolithic, reflecting higher physical labor tied to agriculture intensification. 4) The rise in craft specialization, social complexity and inequalities that appeared during the Bronze Age should be reflected in increased within‐sample heterogeneity of skeletal robusticity in the Bronze Age, becoming more marked in the Iron Age (Harding, 2002; Milisauskas and Kruk, 2002b). 5) Differences in skeletal robusticity, in particular in the upper limb, between rural and urban samples should increase from the late Iron/Roman period onwards as urban centers increase in size, with lower robusticity levels in urban groups (Wells, 2002). 6) Sexual dimorphism in skeletal markers of mobility will decline from the Upper Paleolithic to Neolithic, and then again from Medieval to modern times, reflecting changes in sexual division of labor and gender‐specific economic tasks (Ruff, 1987). This hypothesis is addressed in Chapter 6. 7) Asymmetry in upper limb robusticity patterns should decline after the Upper Paleolithic, reflecting the shift from unimanual hunting technology to more bimanual implements. The use of unimanual weapon in warfare in Bronze Age and Iron Age periods, however, may be reflected in increased upper limb asymmetry. These hypotheses are addressed in Chapter 7.
0003342911.INDD 95
25-10-2017 20:32:19
96
Skeletal Variation and Adaptation in Europeans
5.2.3 Terrain
Populations living in areas with substantially more elevated terrain will exhibit higher lower limb robusticity and markers of mobility.
O
●●
O
FS
Previous studies have shown a correlation between physical terrain and femoral robusticity (Ruff, 1999). Among a set of Native American archeological samples, groups inhabiting mountainous regions exhibited higher relative femur strength than those from flat areas. Terrain, however, had no impact on humeral robusticity, clearly strengthening the causal link between locomotor loads and lower limb bone structure. Higher A‐P bending loads produced by hamstring and quadriceps muscles during climbing are expected to result in an A‐P‐reinforced diaphysis, particularly around the knee region (Ruff, 1987). Given the wide array of European landscapes, from flat coastal and river plains to alpine mountains, it is reasonable to assume that variability in lower limb robusticity should reflect terrain here as well. Based on this assumption, we also tested the following additional hypothesis:
PR
5.3 Materials
R
EC
TE D
The sample comprises 1834 (1048 males and 786 females) adult skeletons from Europe, divided into seven geographic regions and nine time periods (Table 5.1). The time periods include Upper Paleolithic, Mesolithic, Neolithic, Bronze Age, Iron Age/Roman, Early Medieval, Late Medieval, Early Modern, and Recent (Table 5.2). These divisions provide a somewhat arbitrary but useful chronological framework because they reflect major cultural and/or socioeconomic transitions. While the Upper Paleolithic is traditionally divided into early (EUP) and late (LUP) periods, EUP and LUP samples are combined here because the important changes that took place across the Upper Paleolithic have been published previously (Frayer, 1981, 1984; Jacobs, 1985; Formicola and Giannecchini, 1999; Churchill et al., 2000; Holt, 2003; Holt and Formicola, 2008). In this study, we wish to emphasize the changes that took place in the context of post‐ Glacial adaptations and beyond. Details about data collection protocol and time periods are given in Chapter 1.
R
Table 5.1 Sample size by time period and region.
N C
O
Region
Time period
Scandinavia
North‐Central Europe
France
Italy
Iberian Peninsula
Balkans
0
67
26
0
0
52
0
Early Modern
40
50
0
32
22
0
0
Late Medieval
119
198
116
0
8
48
54
0
0
174
15
34
63
0
U
Recent
Britain
Early Medieval
118
63
49
18
17
0
0
Bronze Age
Iron Age/Roman
17
0
162
0
33
32
0
Neolithic
19
107
128
30
9
0
0
Mesolithic
0
26
2
12
7
5
15
Upper Paleolithic
2
1
12
13
17
0
0
0003342911.INDD 96
25-10-2017 20:32:19
Temporal and Geographic Variation in Robusticity
97
Recent
≥1900 AD
Early Modern
1600–1899 AD
Late Medieval
1000–1599 AD
Early Medieval
500–999 AD
Iron Age/Roman
2250–1650 BC
Bronze Age
4350–2950 BC
Neolithic
7000–4050 BC
Mesolithic
10500–5880 BP
Upper Paleolithic
32 285–10 000 BP
O
Date range*
O
Time period
FS
Table 5.2 Dates for each time period.
PR
* Dates indicated as BP are calibrated.
5.4 Methods 5.4.1 Aging and Sexing
TE D
Age and sex were determined from a number of standard skeletal indicators (Buikstra and Ubelaker, 1994; see Chapter 1). 5.4.2 Reconstruction of Cross‐Sectional Dimensions
U
N C
O
R
R
EC
Long bone diaphyseal cross‐sectional dimensions were obtained from either computed tomography (CT) scans or a combination of bi‐planar radiographs and molds, following protocols established in previous studies (Trinkaus and Ruff, 1989; O’Neill and Ruff, 2004). Because access to CT technology was possible in only a few cases, the latter method was used for the majority of the sample (see Chapter 3 for details). Cross‐sectional geometric parameters were assessed at three locations: at femoral and tibial midshaft, and at 35% of humeral length from the distal end. These locations provide information about upper and lower limb mechanical loads that reflect some important components of subsistence behavior (Ruff and Hayes, 1983a; Ruff et al., 1993, Trinkaus et al., 1994). Length dimensions used to determine these positions are defined in Ruff (2002). Given low levels of bilateral asymmetry in lower limb diaphyseal dimensions, right or left femur and tibia were used, either from the best‐preserved side or at random. Ample evidence shows, however, that asymmetry in upper limb bone cross‐sectional properties can be marked, providing important functional information for reconstructing behavior (Trinkaus et al., 1994; Churchill and Formicola, 1997; Ruff, 2008; Rhodes and Knüsel, 2005; Auerbach and Ruff, 2006). Therefore, both right and left humeri were included when available. To ensure consistent orientation of cross‐sectional contours, bones were set up in standard positions relative to a set of anatomical axes (Ruff, 2002). 5.4.3 Robusticity Variables Bone robusticity was evaluated by comparing average bone rigidity or strength, standardized for body size differences (see Chapter 3), and bone shape through comparisons of relative strength in different planes. The polar section modulus, Zp, was used as a measure of overall
0003342911.INDD 97
25-10-2017 20:32:19
98
Skeletal Variation and Adaptation in Europeans
bending strength. Section moduli around the M‐L and A‐P axes were calculated to estimate A‐P (Zx) and M‐L (Zy) bending strength, respectively. Ratios of these variables reflect diaphyseal shape (e.g., Zx/Zy). Cortical thickness or percentage cortical area was also examined through ratios of cortical area and total subperiosteal area (CA/TA). 5.4.4 Standardizing Cross‐Sectional Dimension for Differences in Body Size
PR
O
O
FS
Meaningful comparisons of bone robusticity require accurate body mass reconstruction (Ruff et al., 1993). Body mass was reconstructed using two approaches. When bi‐iliac (maximum pelvic) breadth (BIB) could be measured, we used so‐called ‘cylindrical’ equations that combine height (stature) and breadth (BIB) (Ruff, 2000; Auerbach and Ruff, 2004; Ruff et al., 2005; see Chapter 2 for details on body size reconstruction). When this technique could not be used we estimated body mass from femoral head breadth (Ruff et al., 2012; also see Chapter 2). To control for body size differences prior to analysis, cross‐sectional areas (CA, TA) are divided by body mass estimates, and section moduli (Zp, Zx, Zy) by body mass × bone length of the corresponding skeletal element (Ruff, 2000; see also Chapter 3). 5.4.5 Quantification of Terrain
N C
O
R
R
EC
TE D
In order to evaluate the impact of topographic relief on lower limb bone robusticity patterns, elevation data were obtained from Digital Elevation Models (DEMs) from the Consortium for Spatial Information (CGIAR; Jarvis et al., 2008) or, for latitudes above 60°N, the Global Land Survey Digital Elevation Model (USGS, 2008). This high‐resolution digital elevation model dataset covers most of the globe at a resolution of three arc seconds, or about 90 m. ArcGIS software was used to find the maximum slope between each three arc second pixel and its neighbors. The average, maximum, and standard deviation of these slope values within a 10‐ km radius of each archeological site’s geographic coordinates were calculated using ArcGIS’s Focal Statistics tool. Binford (2001) estimates typical daily forager logistical mobility as having a radius of 6–9 km and an average round‐trip distance of 15 km. A 10‐km radius was used to capture all terrain likely to be covered by a single‐day foraging trip. Agricultural and urbanized populations are expected to cover less ground by walking, so this radius should still capture most of the terrain typically traversed. A combination of maximum and average slope values was used to produce a measure of the ‘hilliness’ of the local area. Resulting elevation values were categorized into a three‐code system representing the three levels of hilliness. Regions with maximum slope values below 22 degrees were considered ‘Flat,’ those with maximum slopes between 22 and 44.9 degrees and an average slope below 8 degrees were considered ‘Hilly,’ and those with a maximum slope of 45 degrees and above or an average slope of 8 degrees or more were considered ‘Mountainous.’
U
5.4.6 Categorization of Urbanization In order to evaluate the impact of urbanization on robusticity patterns, sites were coded along a rural–urban dichotomy (see Chapter 1). No pre‐Iron Age site fell into the ‘Urban’ category. 5.4.7 Analysis of Robusticity Overall temporal trends were assessed through linear regressions of upper and lower limb robusticity variables and calibrated dates. As shown previously (Ruff et al., 1993), temporal trends in markers of relative bone strength and bone shape are better fitted by log‐linear than
0003342911.INDD 98
25-10-2017 20:32:19
Temporal and Geographic Variation in Robusticity
99
PR
O
O
FS
linear regressions, hence regressions were carried out against log (dates). In addition, in order to explore these trends both across the entire time period, as well as in the post hunter‐gatherer period, regressions were performed both on the entire sample and excluding pre‐Neolithic groups. Assessments of temporal changes were also carried out with two‐way ANOVA with temporal period and sex as independent variables. If an interaction between sex and period was detected in the two‐way ANOVA, differences within sex were examined with one‐way ANOVA, with post‐hoc pairwise Tukey comparisons between periods (p