2.2.1 Hydrostatic puncture tests. Hydrostatic tests were performed according to the NF P84-523 standard. This short-term test consists in applying an increasing.
Table of contents
Search
Author index
Geosynthetics - 7 th ICG - Delmas, Gourc & Girard (eds) © 2002 Swets & Zeitlinger, Lisse ISBN 90 5809 523 1
Understanding and prediction of hydrostatic puncture resistance of geomembranes S. LAMBERT, Cemagref, Antony, France
ABSTRACT: The aim of this paper is to investigate the behavior of geomembranes exposed to hydrostatic puncture, comparing the resistance of different geomembranes and looking at possible correlation with simple tests. Nine commonly used polymer geomembranes were submitted to hydrostatic puncture test, static puncture test and bi-axial tensile test. Hydrostatic puncture tests results showed significant differences in both resistance to puncturing and rupture mode. Influence of the polymer type and thickness of the geomembrane are discussed. Static puncture test and bi-axial tensile test results are found to be correlated with hydrostatic puncture resistance. These tests could be used to predict both behavior and resistance of geomembrane submitted to hydrostatic puncture. 1 INTRODUCTION Geomembranes used in water containment facilities may be exposed to severe puncturing conditions due to gravel, stones or other sharp objects protruding from the supporting soil, even when a protective geotextile is used. In practical, it is often observed that the behavior of geomembranes submitted to gravel puncturing in hydraulic projects varies significantly from one kind of geomembrane to another. These differences were investigated in the laboratory with nine different geomembranes with the aim of contributing to the understanding of puncturing phenomenon and developing a designing method based on easy tests. In the following methods are described, underlining important and critical points, results are presented and detailed. A discussion presenting correlation between the tests follows. It allows the reader to interpret these results and to understand the phenomenon involved. 2 MATERIALS AND METHODS 2.1 Materials Table 1 presents the nine smooth polymeric geomembranes. These are commonly used and available in Europe. Thickness ranging from 1 to 2 mm are producer’s values. Their respective producers as flexible polyethylene geomembranes vaguely defined references 5 and 6. Table 1. Geomembranes tested. Geomembrane Type reference 1 PVC
Thickness (mm) 1.5
2
LDPE
1.5
3
HPDE
1.5
4
VLDPE
1.0
5
PE-f
1.5
6
PE-f
2.0
7
PVC
2.0
8
PP
2.0
9
PP
1.5
2.2 Methods The previously described geomembranes were submitted to hydrostatic puncture tests and then to two other simple mechanical tests with the aim of finding correlation. The two other tests were selected because they simulate both principal rupture mode observed during the hydrostatic puncture test. These three tests are short-term tests. There is thus no stressrelaxation. Changing the rate may influence the results for some products. 2.2.1 Hydrostatic puncture tests Hydrostatic tests were performed according to the NF P84-523 standard. This short-term test consists in applying an increasing water pressure on a 300 mm in diameter specimen of geomembrane laying on a gravel layer. The pressure is increased progressively by 50 kPa/min. until perforation occurs, creating a leak of water through the geomembrane observed under the cell. The 30-50 mm gravel is crushed basalt. Pieces of gravel are angular but exhibit no sharp edge. The gravel is rearranged between two tests and it is fully replaced after a series of 10 tests. The result is the mean value of the pressure necessary to puncture 5 specimens successively tested. Each specimen was examined after testing in order to define its mode of rupture. Two main modes of rupture are generally observed after the test: burst, referred hereafter as B mode, and puncture, referred hereafter as P mode. The first mode occurs between gravel layer contact points as a result of tensile solicitations whereas the second one occurs on the gravel layer contact points. Thus, it was thought that P-mode geomembranes hydrostatic puncture test results should be compared to static puncture test results. In the same way, B-mode geomembranes hydrostatic puncture test results should be compared to bi-axial tensile test results. 2.2.2 Static puncture tests Static puncture tests were performed according to the NF P84507 standard that consists in submitting a 10 cm in diameter specimen of geomembrane to static puncture by a 8 mm in diameter probe, displaced at a rate of 50 mm/min. 10 specimens are submitted to the test. The results are mean values of strength and displacement of the probe. This test method has been previously used in damage related studies (Duquennoi & Artières 1997).
1391
2.2.3 Bi-axial tensile tests Bi-axial tensile tests were performed according to the NF P84503 standard. This test is a burst test conducted controlling the deformation of the specimen, such a way that the strain rate is 5% per minute. Formula used to calculate stress and strain from deflection and pressure measurements are based on the assumptions of a spherical deformed shape and of a uniform thickness. The reduction of thickness in the center point of the specimen during the test is taken into account according to the calculation described by Lambert & Duquennoi (2001). Three specimens of each geomembrane were submitted to the test. The results can be expressed in terms of pressure and deflection of the center point of the specimen or in terms of stress and strain. The interest of such a test is that stress-strain results are not dependent on the thickness of the geomembrane but only on the material of which the geomembrane is made. (Lambert and Duquennoi 2001). 3 RESULTS
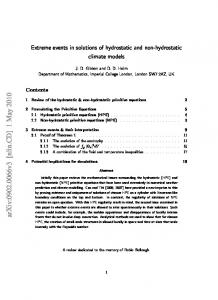
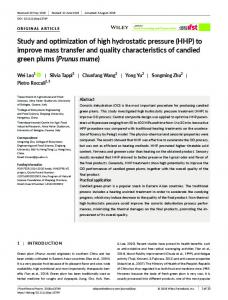
3.2 Static puncture tests Results given in Table 2 are characteristics at the maximum resistance or at the first peak observed on the curves. The reason for choosing the characteristic at yield will be discussed later. The displacement varies from 15.2 to 25.9 mm and the strength varies from 224 to 609 N. The strength depends on the thickness of the geomembrane. Comparing geomembranes of same thickness, the ranking from the lowest to the highest resistance is PP, PE-f, PVC and LDPE, and HDPE geomembranes. Figure 1 shows the shapes of the curves obtained. Curves obtained exhibit similarities of shape from one geomembrane to another of similar composition. Differences of shapes for geomembranes of different compositions are important. The difference between HDPE and VLDPE only bears on the characteristics but not on the shape of the curve as well as for the PVC geomembranes. The others products have similar global behaviors. Indeed, comparison of shapes of curves (8, 9), (4, 5) and 6 shows that the difference of shape exists but is little.
The results of the three tests are given in Table 2. These will be presented, discussed and used in the following. Force
1, 7
3.1 Hydrostatic puncture tests Comparing geomembranes of same thickness the ranking from the lowest to the highest resistance is LDPE, PP, HDPE, PE-f, and PVC. As it is 1 mm thick, the VLDPE geomembrane cannot be compared with the others. Nevertheless, its resistance is rather medium considering its low thickness. The puncture resistance of PVC geomembranes appears to be proportional to the thickness of the geomembrane. That is clearly not the case for the PP geomembranes. HDPE and LDPE geomembranes exhibited a P-mode of rupture. PE-f and PP geomembranes exhibited a B-mode of rupture. PVC geomembranes exhibited both mode of rupture. In fact, for these geomembranes rupture mainly followed a B mode, but sometimes the rupture occurred on a contact point as a result of both tensile stress and puncturing. It was also noticed that the zone of the HDPE geomembrane concerned by puncturing exhibited the same aspect in the laboratory as on site. The plastic zone (zone were the thickness is dramatically reduced due to yielding) is located just along the contact line with the gravel; it does not enlarge and remains a few millimeters large until perforation appearing as a point on this line. Table 2. Tests results. Hydrostatic puncture test Static puncture test Bi-axial tensile test DisplaceDeflectMode Pressure ment Strength ion Pressure GMB
(kPa)
(mm)
(N)
(mm)
(kPa)
25.4
427
150
147*
3, 2
8, 9
4, 5
6
0
Probe displacement
0
Figure 1. Shapes of curves obtained at static puncture tests.
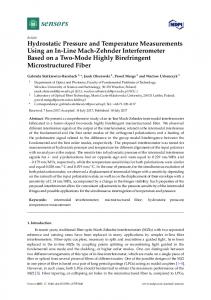
3.3 Bi-axial tensile tests For HDPE and LDPE geomembranes the results given in Table 1 are pressures and deflections at burst. For the other geomembranes, that are flexible products, deflections at burst are greater than 180 mm, which is over the limits of the apparatus. For these products, the results given are the pressures measured at a 150 mm deflection, i.e. a strain of 115 %. Nevertheless the pressure at rupture may not be dramatically different from the pressure presented here, as the end of the pressure-deflection curves for these products is rather flat. Comparing flexible geomembranes of same thickness, the ranking from the lowest to the highest resistance is PP, PE-f, and PVC geomembranes. The resistance of HPDE and LDPE geomembranes are higher. Figure 2 shows the stress-strain curves calculated from the pressure and deflection measurements. The PVC and PP geomembranes respectively exhibit the same curve. Geomembranes 4 and 5 exhibit the same curve: they are certainly made of the same material. The change of density from HDPE to LDPE geomembranes has an influence on both the shape of the curve and the stress at burst.
1
B/P
1451
2
P
707
18.8
436
109
216
3
P
1034
15.6
609
100
292
4
B
986
18.6
233
150
85*
5
B
1230
18.4
329
150
133*
6
B
1496
20.7
392
150
152*
7
B/P
1974
25.9
544
150
200*
5
8
B
958
16.4
287
150
88*
0
9
B
906
15.2
224
150
70*
Stress (MPa)
30
1,7
25
3
20
2
15 8, 9
10
0
50
100 Strain (%)
Figure 2. Bi-axial tensile test curves.
1392
4, 5 62
150
The global shape of the curves of PE-f, VLDPE and PP geomembranes are similar. In the stress-strain graph, the HDPE geomembrane is the only one exhibiting a real yield. PE-f, PP, LDPE and VLDPE geomembranes exhibit an inflection point. On the other side, pressure-deflection curves of all the geomembranes exhibit a peak Evidences given by the two tests allow considering the geomembranes 4 and 5 as of same composition. 4 COMPARISONS OF TESTS RESULTS 4.1 Preliminary comments on results obtained from different test methods Comparison of the test methods is fundamental prior comparing the results obtained from different tests on various geomembranes. Points to be considered are the way they are performed and the meaning of the results they give. Characteristics to compare are to be selected considering this comparison. The first test described, i.e. hydrostatic puncture test, is rather a performance test whereas the two others are rather index tests. These index tests were selected because they reproduce the two mode of rupture observed during the hydrostatic puncture test. The main difference between these tests is the way the rupture is reached. The hydrostatic puncture test is performed controlling the pressure, that is to say increasing the stress in the geomembrane. Static puncture test and bi-axial tensile tests are performed controlling the deformations. This is of great importance, and mainly for materials exhibiting a yield. Indeed, rupture occurs very rapidly after the yield during a 'stress increased test' whereas it takes long before the rupture is reached during a strain-controlled test. This is due to the fact that the plastic zone or 'yielded zone' is allowed to enlarge in the second type of test but not in the first one. During a stress-controlled test, an increase of force in the plane of the specimen concerns each elementary volume of the geomembrane. When the geomembrane yields in a point, its local thickness decreases. As a consequence, the stress in the geomembrane is locally higher than in the rest of the specimen. An incremental increase of force on the specimen will then lead the yielded zone to rupture, without enlarging the yielded zone. On the other side, the increasing deformation applied during a strain controlled test concerns the whole specimen. After the yield point, the deformation occurs mainly in the yielded zone that will enlarge with an incremental increase of deformation the stress in the geomembrane remaining almost constant. In the case of a mono-axial tensile test performed with dumbbell specimens, the yielded zone enlarge until it reaches the section of the specimen where the width increases. In the case of an axisymetric test like the bi-axial tensile test the rupture occurs when the force necessary to enlarge the yielded zone to an elementary ring of specimen is too important. Another point is that during a static puncture test, the geomembrane tends to get in close contact with the probe cylinder under high deformation, mainly after the yield.
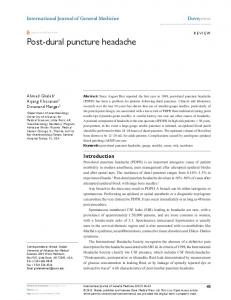
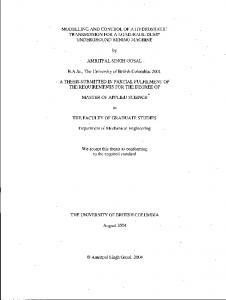
Thus, measurements for high probe displacement also take into account other properties than puncture resistance, e.g. friction. It was thus decided that hydrostatic puncture test results would be compared to static puncture test values at rupture or peak, if any. If two peaks were observed on the curve, then the first one was considered. The same approach will be consider for bi-axial tensile test results. Moreover, designers only have an estimation of the pressure applied on the geomembrane on site and know nothing about the deformation. Thus the only data of interest for all three tests is the pressure or the force 4.2 Comparison between hydrostatic puncture test and static puncture test Figure 3 gives hydrostatic puncture test results as a function of static puncture test results for both mode of rupture. It shows a good correlation for B-mode geomembranes. This test was supposed to give evidence of a correlation with hydrostatic puncture test for P-mode geomembranes mainly. But, due to insufficient data concerning this mode, no conclusion can be drawn for the concerned geomembranes. Points concerning Pmode geomembranes are plotted just to illustrate that they are not aligned with B-mode ones. The fact is that for a same static puncture resistance, a P-mode geomembrane will be weaker than a B-mode geomembrane when exposed to hydrostatic puncture. Complementary results could confirm if or not there is a correlation. 4.3 Comparison between hydrostatic puncture test and bi-axial tensile test The results presented in Table 2 were used to plot the graph in Figure 4 showing the correlation existing between the hydrostatic puncture test and the bi-axial tensile test for the seven Bmode geomembranes. The linear regression presented is not extrapolated but restricted to the range of pressure of concern. Pmode geomembranes points cannot be plotted on this graph as their rupture occurs for deflections lower than 150 mm. Figure 4 shows that the bi-axial properties of geomembranes govern the hydrostatic puncture resistance of B-mode geomembranes The diameter of the geomembrane effectively submitted to burst in the standardised test is really different from the voids existing between two pieces of gravel. The effective geomembrane diameter submitted to burst is 200mm in the standardised test. On the other side, imprints on the geomembrane after hydrostatic puncture tests allowed to estimate that the diameter of voids existing between the gravels was of about 35 mm. The relation presented depends on the size of voids existing between pieces of gravels. It may not be used for other gravels. Moreover the influence on burst resistance of the thickness of the geomembrane increases when decreasing diameter. The relation presented may not be good for thicker geomembranes, even if these geomembranes are flexible.
Hydrostatic puncture pressure (kPa)
Hydrostatic puncture pressure (kPa)
2000 B mode 1500
1000 P mode 500 150
250 350 450 550 Static puncture test yield resistance (N)
Figure 3. Hydrostatic puncture test vs. bi-axial tensile test results.
2000 1500 1000 500 50
650
100
150
200
Pressure for a 150 mm deflection (kPa) Figure 4. Hydrostatic puncture test vs. bi-axial tensile test results for Bmode geomembranes.
1393
4.4 Comparison between static puncture test and bi-axial tensile test
Static puncture test - Force at peak (N)
The two correlations established between the hydrostatic puncture test and the two index tests for B-mode geomembranes suggests the existence of a correlation between the static puncture test and the bi-axial tensile test. To be properly investigated, this relation must be based on comparable data. The probe displacement and the force at the first peak should respectively be compared to the pressure and the deflection at peak, observed in a pressure-deflection graph. Bi-axial tensile test peak characteristics were thus determined to plot the points presented in Figure 5. Results are not explicitly presented here. Except for two points corresponding to the PVC geomembranes, there is a good linear correlation between peak values obtained from both tests. The fact that PVC geomembranes have no yield compared to the other geomembranes that are made of polyolefin may explain this. It is underlined that considering PVC bi-axial tensile test pressure near rupture changes almost nothing to this graph. 650
PVC geomembranes
550 450 350 250 150 50
150 250 350 Bi-axial tensile test - Pressure at peak (kPa)
450
6 CONCLUSION
Figure 5. Correlation between static puncture and bi-axial tensile tests.
5 DISCUSSION The results presented in section 2 confirm the interest of the biaxial tensile test, and also of the static puncture test, to compare different geomembranes and identify their nature when imprecisely defined. This has been done in this study on a geomembrane of unknown composition. The comparisons presented in the previous section tend to show that the hydrostatic puncture resistance of B-mode geomembranes can be predicted using static puncture tests or biaxial tensile tests results. Nevertheless, it seems to be more satisfactory and convenient to consider the static puncture test. First, this test is the easiest to perform. Second, it is difficult to use biaxial tensile tests raw data with the aim of comparing these with other tests results for any kind of geomembrane. Indeed, the 150 mm deflection initially considered is arbitrary and cannot be applied for any kind of geomembranes and the peak observed in pressure-deflection graphs is not meaningful for any kind of geomembrane. The hydrostatic puncture resistance of B-mode geomembranes can thus be predicted using the following relation deduced from Figure 3: HPR = 3.27 SPR + 145
Concerning hydrostatic puncture test results it appears, considering products of same thickness, that the PVC geomembranes have the highest resistance, followed by VLDPE, PE-f, HDPE, PP and finally LDPE geomembranes. This resistance is proportional to the thickness for the PVC geomembranes and almost for VLDPE geomembranes. That is not really the case for the PP geomembranes, what is unexplained. The hydrostatic puncture test mode of rupture of a geomembrane depends on its stiffness or flexibility, which can be evaluated from the static puncture test curve. A stiff geomembrane will be less sensitive to deflection between contact points. As a consequence, the stress will be concentrated on the contact points leading to a P-mode rupture. On the other side, a more flexible geomembrane will deform between contact points and will get in close contact with the pieces of gravel, reducing the static puncture stress and giving the opportunity for a B-mode of rupture. In this case, the more deformable the geomembrane, the smaller the area submitted to burst and the higher the resistance to hydrostatic puncture. Even if it is stronger at static puncture test a stiff geomembrane will be weaker at hydrostatic puncture test, confirmed by the fact that P-mode geomembranes points are not aligned with B-mode geomembranes ones in Figure 3. The most important consequence is that the hydrostatic puncture resistance of a geomembrane depends on both its resistance and its deformation during static puncture test. This explains why the HDPE and LDPE geomembranes are among the weakest geomembranes and why the PVC geomembranes have the highest resistance. These experimental results could be confronted with previously developed theory (Giroud et al 1995), but such a comparison is rather difficult to carry.
(1)
where HPR is the hydrostatic puncture resistance, in kPa, and SPR the maximum resistance or the resistance at the first peak during static puncture test, in Newton. The unexpected relation between the static puncture and the bi-axial tensile test must not be considered as a misunderstanding of fundamental phenomenon involved in hydrostatic puncturing. It only suggests the existence of a relation between these two axy-symmetrical tests. This relation seems to be linear for polyolefin geomembranes and is independent of the mode of rupture of the geomembrane during the hydrostatic puncture test.
It has been suggested that the behavior of a geomembrane submitted to hydrostatic puncture, and mainly the mode of rupture, depends on its flexibility. If the geomembrane is not flexible enough, then it will endure higher puncture stresses. Thus, to resist to hydrostatic puncture, a geomembrane must be flexible and have a good resistance to puncturing. Moreover, the hydrostatic puncture resistance of polymer geomembranes may be predicted using static puncture tests. Complementary tests are necessary to improve this prediction and mainly concerning geomembranes exhibiting a puncture mode of rupture or investigating the influence of the size of the pieces of gravel. Finally, a correlation between yield characteristics at static puncture test and bi-axial tensile test has also been touched on. 7 ACKNOWLEDGEMENT The author is grateful to ALKOR DRAKA for authorizing the publication of these results obtained thanks to a contract with Cemagref. 8 REFERENCES Lambert S. & Duquennoi C., 2001, From burst test to bi-axial tensile test, Geosynthetics conference 2001, Proc. Internation. conf., Portland, USA, 12-14 February 2001. IFAI. 701-714 Duquennoi C. & Artières O. 1997 Practical use of mechanical tests to design synthetic lining systems against localised damage. Proceedings of Sardinia 97, sixth international landfill symposium. Cagliaryi Italy, 13-17octobre, 177-187 Giroud, J.P., Badu-Tweneboah, K. & Soderman, K. L. 1995 Theoretical analysis of geomembrane puncture. Geosynthetics International 2(6): 1020-1048.
1394