Apr 28, 2007 - have spent their time while using a computer, we felt pro- .... Company A is a management consulting firm specializing in contract and applied ...
Understanding Memory Triggers for Task Tracking A.J. Bernheim Brush, Brian R. Meyers, Desney S. Tan, Mary Czerwinski Microsoft Research One Microsoft Way, Redmond, WA USA {ajbrush, brianme, desney, marycz}@microsoft.com ABSTRACT
Software can now track which computer applications and documents you use. This provides us with the potential to help end-users recall past activities for tasks such as status reporting. We describe findings from field observations of eight participants writing their status reports. We observed interesting trends, including the reliance on memory triggers, which were either retrieved from explicit selfreminders, from implicit breadcrumbs left while performing their tasks or directly from memory. Participants perceived spending relatively short amounts of time composing their status reports, suggesting that any technology solution must offer dramatic improvements over current practice. Author Keywords: Status reports, field study, information worker, office ACM Classification Keywords: H.5.2 User Interface; user centered design INTRODUCTION
Technological advances have made it possible to track a user’s actions while they work on a computer. We can now record the programs and documents a person uses as well as the time spent on each activity. We believe that access to this information will not only allow machines to derive valuable information for the user, but also provide useful memory triggers for personal reflection, planning and reporting. To explore these ideas, we built PersonalVibe [3], a monitoring tool that tracks and logs computer window event activity. While PersonalVibe was immediately useful in gathering quantitative data that provided us with a better understanding of how and what users do on their computers, we wanted to explore how access to this data might be valuable to the end-user. Since past research [e.g. 5] has shown that people can have trouble accurately identifying how they have spent their time while using a computer, we felt providing end-users with the data from PersonalVibe could be Permission to make digital or hard copies of all or part of this work for personal or classroom use is granted without fee provided that copies are not made or distributed for profit or commercial advantage and that copies bear this notice and the full citation on the first page. To copy otherwise, or republish, to post on servers or to redistribute to lists, requires prior specific permission and/or a fee. CHI 2007, April 28–May 3, 2007, San Jose, California, USA. Copyright 2007 ACM 978-1-59593-593-9/07/0004...$5.00.
valuable in a number of ways. For example, knowing the time spent on a specific task could motivate a user to make changes in work habits such as spending less time working on email or reducing the length of IM conversations. Given the number of people who write status reports, we decided to develop the first interface for PersonalVibe data to support users in recalling and reflecting on past work. Unfortunately, initial internal deployment revealed that the interface was not as useful in supporting status writing as we hoped. To better understand the nature of the status writing task and inform a redesign, we conducted a series of field visits to observe information workers while they wrote their status reports. In this paper, we focus on understanding how people access and compile information from various information sources as they write periodic status reports that are shared with members of their workgroup or customers. While there has been excellent research on how users manage and track their tasks and to-do lists (e.g. [1]), much less has been done to understand how users compile the data needed for status reports. We observed several trends: 1) several of our participants explicitly recorded information during the week to trigger their memory when compiling their report, 2) status report authors use a large amount of learned or perceived social knowledge about their target audience to choose what to include in the reports, and 3) status report writing, while seen as somewhat tedious, is not actually perceived to take a large amount of time (whether it does or not), so any technology created to support the task would need to be lightweight and of obvious, immediate value to the user. PERSONALVIBE LOGGING TECHNOLOGY
Windows XP provides system hooks that allow the tracking of various user activities. A variety of employee monitoring software packages like Netvizor™ by EmployeeMonitoring or SureTime™ by First Guarantee utilize these hooks to allow managers to see what their employees are doing on the PC, including high level activity as well as keystrokes and mouse movements. As secondary functionality, some of these programs provide feedback to the employee to support more accurate time tracking for billing. We developed PersonalVibe with a different goal. Rather than a tool to monitor someone else, we believed that the historical record of PC activity could be useful to individual
Method
Eight people (3 females) from two different companies volunteered to be observed while writing their weekly status reports. The participants were split evenly between companies and several were in the same workgroup. This allowed us to observe the different methods employed by people involved in related jobs in similar business environments. We also chose to include both managers and individual contributors so that we could explore potential differences between these groups. (See Table 1)
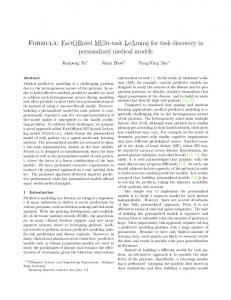
Figure 1: Interface presenting data from PersonalVibe
users tracking their own time. To this end, PersonalVibe logs the active window, along with its size, position, application used, and, if possible, the document it has loaded. In addition, we track the keyboard and mouse activity at a high level in order to determine whether the PC is in active use or not. All information is stored in a local database to preserve the privacy of the user. With the historical record that PersonalVibe provides, users can quickly find answers to questions like, “What documents did I work on last week?” or “How much time did I spend on this document?” In addition, the system has information about hours of use, application usage, and even window positions on the display over time. Using the data we built an interface that presented a summarized view of the activity per window (see Figure 1). We presented the data showing time spent on each item on a per day basis. Users can also filter the data either by document or application. Although we knew beforehand that this information was not labeled according to what the user perceived their tasks to be, we hoped it would be helpful in remembering the week’s activities when writing a status report. Unfortunately, initial deployment of this interface demonstrated that many people did not find sufficient benefit from viewing the data in this manner. Some problems noted by initial users were that duration of a task was not necessarily a good proxy for the importance of including it in a status report, and that the custom application did not include enough context from other time management tools like their calendar. Because of this, many commented that the tool did not adequately summarize their work and hence did not fit into their current work practice. We decided we needed a better understanding of the techniques participants currently use when reporting on work accomplished and hence conducted a field study. FIELD STUDY
Our main research questions were R1) What processes and tools do people use to track what they are working on? R2) How much information on task duration do they provide? R3) How do users decide what content to include in the status reports? R4) How long do people spend tracking their work and creating status reports?
Company A is a management consulting firm specializing in contract and applied research for local governments and utilities. At Company A, each participant worked in a group that included 2-3 people, so some status was verbally reported. However, due to the consulting nature of their business, each person had a weekly requirement to enter the time they spent on different projects into a time accounting system – these reports could be viewed by managers and in some cases were directly shared with them. Participants at Company A received a software gratuity. Company B is a large software company where the authors work. These 4 participants were from 2 different groups each with 8 people in them. In these groups, the members summarize their accomplishments every week in an email to other group members. P7 and P8 are co-authors of this paper. Participants at Company B received a lunch coupon. In the study, we observed participants writing their status reports, asked clarifying questions, and then used a checklist of questions to make sure we had covered everything of interest to our research during our observation. Each observation took between 1 and 1½ hours. In addition to answers to our questions, we identified 307 additional notes from our observations and then used affinity diagramming to categorize and tally the behaviors we encountered the most often and to identify common themes. Findings Processes and Tools (R1)
Through our observations and affinity diagramming, we concluded that participants employed a diverse range of strategies to track their time and activities. Specifically, we saw large variance in the degree to which participants would perform explicit actions that would later remind them of their activities and the time they had spent on them. Some users would continuously track and record their work during the week, making the status report writing primarily a compilation exercise, others would wait until they had to write their status reports to search though various information sources in order to reconstruct their time. Of our participants, P2, P3, P4, P5 and P7 seemed to adopt the approach of explicitly and continuously tracking their activities. As Table 1 shows, these participants used a variety of methods to record their work during the week. For example, P2 used a combination of digital timers and a paper notebook, P4 used an excel spreadsheet and P5 tried to edit a draft email message every day. These participants
P1 P2
Male Male
Yes No
Time to create (min. per week)