Unsupervised Learning from Continuous Video in a Scalable Predictive Recurrent Network
arXiv:1607.06854v1 [cs.CV] 22 Jul 2016
Filip Piekniewski∗
[email protected]
Patryk Laurent
[email protected]
Csaba Petre
[email protected]
Micah Richert
[email protected]
Dimitry Fisher
[email protected]
Todd L. Hylton
[email protected]
July 26, 2016
Abstract Understanding visual reality involves acquiring common-sense knowledge about countless regularities in the visual world, e.g., how illumination alters the appearance of objects in a scene, and how motion changes their apparent spatial relationship. These regularities are hard to label for training supervised machine learning algorithms; consequently, algorithms need to learn these regularities from the real world in an unsupervised way. We present a novel network meta-architecture that can learn world dynamics from raw, continuous video. The components of this network can be implemented using any algorithm that possesses certain key characteristics. The highly-parallelized architecture is scalable, with localized connectivity, processing, and learning. We demonstrate an implementation of this architecture where the components are built from multi-layer perceptrons. We use this implementation to create a system capable of stable and robust visual tracking of objects as seen by a moving camera. Results show performance on par with or exceeding state-of-the-art tracking algorithms. The tracker can be trained in either fully supervised or unsupervised-then-briefly-supervised regimes. Success of the briefly-supervised regime suggests that the unsupervised portion of the model extracts useful information about visual reality. The results suggest a new class of AI algorithms that can learn from and act within the real world.
1
Introduction
We are interested in creating practical vision systems that can power front-ends for applications like autonomous robots, self driving cars, or intelligent security systems. By “practical,” we mean vision systems that can function in real time, in the real world, be scalable, and perform well when faced with challenging visual conditions. Objects and scenes are subject to numerous temporal and contextual effects, including changes in lighting, shadows, reflections, motion blur, and partial occlusions. Although conceptually the physical dynamics that, e.g., underlie an object rolling into and out of a shadow are relatively simple, inferring these effects from the pixel values projected onto a camera is a non-trivial task, as illustrated in Figure 1. Building systems that can learn the common-sense knowledge to reliably process such scenes has long remained an unsolved problem. Nearly 30 years ago, Hans Moravec pointed out the problem of common-sense perception for artificial intelligence (AI) systems (Moravec, 1988) in the following paradox: It is comparatively easy to make computers exhibit adult level performance on intelligence tests or playing checkers, and difficult or impossible to give them the skills of a one-year-old when it comes to perception and mobility. ∗ Corresponding
author.
1
To-date the issues raised by Moravec have not been directly tackled or successfully addressed by either machine learning or robotics researchers, despite the massive progress in general computing. In the case of machine learning research, the focus on games has continued – from checkers, to chess (Campbell et al., 2002), Jeopardy (Lewis, 2012), and most recently, Go (Silver et al., 2016) and Atari games (Mnih et al., 2013). Benchmarks such as ImageNet (Deng et al., 2009) or CIFAR-10 (Krizhevsky and Hinton, 2009) have moved research in the direction of perception, but as we point out in later sections, high-level adult-human categorization of objects does not facilitate the kind of common sense knowledge learning implied by Moravec’s paradox. ImageNet, despite its use of real-world images, is heavily skewed by human cognitive and perceptual category labels, which are based not just on visual information, but on myriad contextual, functional and cultural factors, as shown in Figure 2. In light of Moravec’s paradox, ImageNet and similar benchmarks are not the kind of tasks we expect from a one year-old. In robotics, at the same time, efforts have been focused on building algorithms that work very well in restricted environments (c.f., Universe of Discourse Lighthill, 1973). The results of the recent DARPA robotics challenge clearly show the extent to which problems of perception, manipulation, and mobility remain very challenging in unrestricted environments (Atkeson et al., 2015). Our approach, described in this paper, involves rethinking both the nature of the benchmark task and the construction of machine learning components used for perception. In the spirit of Moravec’s paradox, we shied away from adult-level tasks like image categorization and opted instead for visual object tracking as a task that is challenging, practical, yet one that might be expected of a one-year-old. We call the architecture that we are developing based on these ideas the Predictive Vision Model (PVM). As we will claim below, the architecture has the properties necessary to discover common-sense dynamical information from the world that is currently missing from machine learning approaches. This paper as organized as follows: first we provide background on the machine learning problem in computer vision and identify the shortcomings in current deep learning techniques (Section 2). Next we present our novel architecture and a neural network implementation of it that attempts to overcome these shortcomings (Section 3). We show results from three experiments related to visual object tracking (Section 4). We discuss the results in Section 5. Next we provide concluding remarks and future research directions in Section 6.
2 2.1
Background History: Neuroscientific origins of machine learning in computer vision
Modern machine learning approaches to computer vision originate primarily from the idea of the Neocognitron (Fukushima, 1980). The Neocognitron in turn was largely inspired by a series of seminal studies in the biology of the mammalian visual system. Studies by David Hubel and Torsten Wiesel on cat primary visual cortex asserted that vision arises as a primarily feedforward hierarchy of alternating functions, namely, feature construction and invariance-generating pooling (Hubel and Wiesel, 1959, 1962)1 . The Neocognitron inspired many subsequent models including the H-max model (Riesenhuber and Poggio, 1999; Serre et al., 2005), and LeNet (LeCun et al., 1995). The recent renaissance of connectionist approaches to vision under the moniker deep learning (LeCun et al., 2015) is a direct continuation of the above mentioned work, but in the context of significantly increased computing power and certain optimized initialization and regularization techniques that allow the models to contain many more layers than in previous work (Krizhevsky et al., 2012; Srivastava et al., 2014). In many cases, including modern deep learning, modelers were inspired by the findings of “complex” cells and built in layers composed of max operators that work on a weight shared feature map, generating translational invariance. Attempts thus far to incorporate other biologically-inspired concepts like invariances based on slowly-changing features (F¨ oldi´ ak, 1991; Wiskott and Sejnowski, 2002) have met with limited success. The potential benefits of other concepts from biology and cognitive science, like prediction, recurrent connectivity, top-down feedback, and highly local learning, have yet to be realized. 1 Fundamental to the design of the Neocognitron was the idea of “simple” and “complex” cells. Simple cells were orientation-selective cells with potent responses to a fixed stimulus bar at particular orientations and eccentricities – called “simple cell” receptive fields – in layer 4 of primary visual cortex, and orientation selective cells with broader invariant response to spatial shifts – called ”complex cell” receptive fields – in layers 2 and 3.
2
Figure 1: The Same Object at Different Times and in Different Contexts. An artificial vision system is challenged when tasked with simply classifying whether images contain a green basketball. This figure shows crops of a green basketball from video as it rolled around on the ground in a naturally lit room with an open window. Notice that this single object looks markedly different in different frames. The way an objects appears depends strongly on ambient contextual effects (e.g., lighting, background, shadows), temporal context (e.g., motion, rotation), and even the dynamics of the camera. The colors in these images vary in hue from blue-green to yellow-green. Shadow and specular reflections alter the apparent shape of the ball. Motion blur momentarily obscures features like texture. Purely feedforward algorithms cannot use either context or time to classify these static images; rather, they are “forced” to find ways to group together clusters of visual space that are meaningfully linked through physical transformations. Because of the problems of high-dimensionality described in the text, feedforward algorithms are highly unlikely to discover the true general decomposition of these spatial and temporal effects and apply them across objects.
2.2
Image classification and the problem of generalization
To motivate our work, this section reviews the typical machine vision problem that deep learning techniques are primarily used to solve today — image classification. In image classification, the stated problem is to associate some vector of high dimensional data points with some lower dimensional representation — usually an image to a class label — in a way that generalizes to new data. For example, an image could be labeled (classified) as whether or not it depicts a catfish. In the case of binary classification, the high dimensional image vectors have to be projected onto a set composed of 0 and 1 (indicating whether the sample belongs to a category or not) or to a [0, 1] segment if fractional category membership is allowed. The set of data samples used to train the system is called a “training set” and is assumed to be a fair (i.e., unbiased) representation of the true, unknown distribution of the data. Under this assumption, it is often concluded that given enough sample data, the correct values of metaparameters, and enough training time, the solution found by the training procedure of the machine learning algorithm will generalize to correctly classify new samples. In other words, the algorithm will be able to output the correct associations for input vectors it has not seen before. This statement should be taken with caution, as even though there are important theoretical results such as the universal approximation theorem (Gybenko, 1989; Hornik et al., 1989), whether a good solution can be achieved in practice is by no means guaranteed and subject to many conditions (Domingos, 2012). In cases where the training set is not sufficiently representative of the actual data distribution, the machine learning algorithm may form a non-general solution, which gives good performance on the training set, but very poor
3
(A)
(C)
(B)
(D) (F)
(E)
Figure 2: Direct Mapping from Images to the Human Category Label “Airplane”. In the ImageNet competition, deep networks are tasked with mapping images like these to human category labels. The images in this figure are labeled with the category “airplane”. In our opinion, ImageNet is not a good benchmark task for general AI learning systems, because correct generalized classification of these images requires much more than just visual inspection. Humans access additional contextual, dynamical and cultural knowledge when identifying each image in a general way: e.g., (A) airplanes fly, rather than just remain on the ground, (B) airplanes have complex controls in their cockpits, (C, D) views from an airplane’s windows include the ground, (E) what airplanes look like when they are in pieces, (F) the fact that humans can order and enjoy snacks on an airplane. Contemporary, feedforward deep convolutional nets trained offline on ImageNet are unable to abstract out and learn these facts. It is, however, possible for a system with many parameters to memorize these images and textures in a non-generalizable way. (Images from ILSVRC 2014).
performance on actual new data. In fact, with enough parameters and after sufficiently long training time, even relatively simple algorithms (e.g., a multilayer perceptron trained using backpropagation of error) are likely to return a solution that will always perform very well on the training set but poorly on new data. Seemingly paradoxically, performance on the new data may even decrease with more training on the training set. This phenomenon — in which the algorithm performs worse on new data with more training on the training set — is called overfitting (Hawkins, 2004). Overfitting does not just depend on the specifics of the algorithm, but also very much depends on the properties of the data: Consider for comparison purposes the easily-generated cases of artificial datasets that exist on low dimensional manifolds but are submerged into very high-dimensional spaces — for example, a gaussian cloud spanning only a few dimensions, or a set of image classes that reliably differ only by a simple pixel tag (e.g., a single pixel in the corner of the image that contains all the information needed to classify the image). These two cases can be handled very well by most machine learning systems as the boundary separating the classes is rather regular and can be inferred from a relatively low number of training samples. However, even artificially generated problems such as the two-spiral set (Lang, 1988) can be very hard to separate. Given its origin in complex physical reality (e.g., see Figure 1), visual data may span hundreds of dimensions and may have fractal-like regions of much greater complexity than spirals. The number of samples of data needed for supervised machine learning algorithms to correctly separate such regions (i.e., in a way that generalizes) can easily exceed any number that would be practical to collect and label. Deep convolutional nets attempt to address these problems by exploiting assumptions of translational invariance of textures and features, which help to reduce the dimensionality of the visual signal being processed as well as the number of parameters needed in the model. These assumptions make the learning problem more tractable, and make it possible to train networks with more layers. However, even deep convolutional networks suffer from numerous problems leading to their inability to generalize as humans would (Nguyen et al., 2015; Papernot et al., 2016; Goodfellow et al., 2014). Importantly, as observed in Goodfellow et al. (2014) and Szegedy et al. (2013), these mis-classifications (“adversarial examples”) are not just isolated cases, but entire subspaces of inputs that persist across multiple deep learning models trained on a variety of data. These deficiencies likely stem at least in part 4
from the fact that convolutional symmetry is merely an approximation to a group of real symmetries of the data manifolds. In the case of these high dimensional problems, reducing the number of parameters to mitigate over-fitting is ultimately futile: in actuality, far more parameters are needed to adequately capture the complexity of real visual scenes. However, with more parameters comes the need for strong constraints. Translational invariance is just one way of constraining parameters in the end-to-end training paradigm but, as noted above, is not sufficient. There are many other transformations and changes in visual appearance that preserve the identity of objects which could serve to constrain parameters in a predictive paradigm. These transformations are difficult for people to recognize and to code as priors. In addition, direct end-to-end mappings using deep networks are still very technically challenging to configure for successful learning. The large number of layers makes credit assignment difficult, a problem known as the vanishing gradient (Glorot and Bengio, 2010; Hochreiter, 1998). Recent techniques such as orthogonal weight initialization or pre-training with restricted Boltzmann machines (Hinton et al., 2006) partially help to deal with this issue, but have not solved it entirely. Although some very deep networks have been reported (He et al., 2015), these are often built using advanced “residual nets” techniques where the true minimal depth of the network — expressed as the shortest path from input to output layer — is not actually larger than more conventional deep learning networks. Despite these challenges, deep networks can learn representations that are useful for a number applications. These representations are semantically relevant and have been used for image search, content-aware advertising, content filtering and so on. However, these transformations are insufficient for general scene understanding and vision for autonomous action. Below we summarize the problems we believe need to be addressed to achieve robust visual perception: • Visual data consists of very high dimensional input, and exists on complex manifolds embedded in high dimensional spaces. Convolutional approaches cannot replicate the complexity of the general manifold. • The vanishing gradient in end-to-end training paradigms is only partially addressed by convolutional feature maps, residual networks, orthogonal initialization, or other such methods. • Good generalization is exceedingly unlikely with the amount of labeled data available; there is a much higher probability of “memorizing” textures which leads to peculiar failure modes (Nguyen et al., 2015; Papernot et al., 2016; Goodfellow et al., 2014)
2.3
Beyond the Neocognitron
As we’ve argued in previous sections, we believe that current algorithms based largely on Neocognitron-type architectures (Fukushima, 1980) only partially address the problems of dimensionality reduction, learning, and robust visual perception. Close examinations of conflicting bodies of research within neuroscience, along with our own requirements for robust robotics vision algorithms, compelled us to take a different approach that abandoned Neocognitron-based designs entirely. Evidence in neuroscience has accrued that the predominantly feedforward, hierarchical picture presented by Hubel and Wiesel is greatly simplified. First of all, anatomical studies of the neocortex point to substantial feedback connectivity (Douglas and Martin, 2007), which significantly affects even the responses in peripheral parts of the primary visual cortex (Girard et al., 2001; Hupe et al., 1998). The functional taxonomy into simple and complex cells is not nearly as clear cut as was originally claimed (Fournier et al., 2011), as there are numerous modulation effects of spatial and temporal context on any receptive field (Angelucci and Bressloff, 2006). Aside from this, the majority of visual learning in early childhood is clearly unsupervised, which is not addressed by current models very well. Finally, there is no evidence in support of weight sharing in the cortex, which is a common optimization in deep learning networks. Given the above, we opted to investigate building a model that could encompass ubiquitous feedback, and learn in a primarily unsupervised way. Inspired by ideas of brains as predictive systems (Clark, 2013; Rao and Ballard, 1999; Palm, 2012; Vondrick et al., 2016; Ranzato et al., 2014) and the requirement to develop computer vision algorithms that could scale to real world robotics applications, we designed an architecture that: • • • •
Uses unsupervised learning (mediated by prediction) of regularities in the visual world Incorporates recurrence/feedback to facilitate discovery of regularities across multiple temporal scales Features a multiscale hierarchical organization, to capture regularities spanning multiple spatial scales Uses local learning to overcome the vanishing gradient problem that makes credit assignment difficult in deep hierarchies 5
• Builds using composable components, in a scalable manner • Builds out of simple components (associative memory units), without being wedded to any particular implementation of those components
2.4
Selecting the benchmark task
Selecting appropriate benchmark tasks is a critical and often overlooked step in building a new machine learning architecture (Torralba and Efros, 2011). On one hand, selecting a benchmark that incorporates aspects of practical tasks helps to ensure that the new algorithm may find applications. On the other hand, focusing on a single task may hamper generality and robustness of the new algorithm, as inevitably, priors about the data will leak into its design. Benchmarks in machine learning are useful to the extent to which they allow for the creation of new algorithms, but their value diminishes once the performance of any algorithm approaches the theoretical maximum (typically indicative of “meta-overfitting”2 ). Benchmarks that have been available for a long time (e.g., MNIST LeCun et al. (1998)) are increasingly subject to the multiple comparisons problem3 . Results obtained from such benchmarks lack statistical significance and in the worst case lead to data “dredging” (Gabbay et al., 2011; Giles and Lawrence, 1997; Smith and Ebrahim, 2002; Elkan, 2012). For a publicized incident, see Markoff (2015). Finally, another problem is that various pressures for novelty and publication impact among scientists and researchers can create the harmful illusion that if a new algorithm does not outperform state of the art in one of the well established benchmarks then it is not worthy of further study. With these constraints and cautionary notes in mind we sought a task/benchmark for PVM that would: • • • • • • •
Be aligned with a problem that is currently unsolved and challenging for current approaches Be natural to formulate as an online, real-time task Have several existing state-of-the-art, general algorithms to compare against Be a first step in a progression towards more complex benchmarks Allow for easy gathering of data Allow experimenters to test hypotheses about what the system “knows” given its training Be relatively low-level on the scale of perceptual and cognitive abilities (i.e., not overly influenced by high-level human cognition, categories, or ambiguities.)
A task that adequately meets the above requirements is visual object tracking.
2.5
Visual object tracking
Visual object tracking is a well known, challenging, yet easily definable task in machine vision — making it suitable for a benchmark. Even though substantial research has gone into making robust tracking systems for particular object types, general object tracking continues to be a very difficult, unsolved problem (see Section 2.5.1). A number of academic and commercial algorithms have been designed for tracking particular objects characterized by distinct features, such as histograms of oriented gradients (Dalal and Triggs, 2005) or the use of keypoints as in the SIFT algorithm (Lowe, 2004). General tracking of arbitrary objects is, however, much more difficult. In this section we describe tracking and the benefit of using tracking as a benchmark task in more detail. Briefly, the goal of visual object tracking is to provide a bounding box around the object of interest in a continuous sequence of images. The object may be occluded or out of view in some number of the frames (the algorithm should then report the absence of the target). As the sequence of images continues, the appearance of the object may change substantially as it undergoes transformations and illumination changes. The online aspect of this task means that the sequence of images is presented to the algorithm and results should be returned after each new frame (prior to the next one). Consequently the algorithm may have access to the history of the sequence but does not have access to the entire sequence upfront, much like an agent acting in a physical environment. Thus, tracking enforces online processing, offers data with rich temporal correlations, and can be unambiguously benchmarked. 2 Another way of saying that multiple tests on the entire dataset, optimization of meta-parameters by hundreds of researchers over many years deprives further results obtained on such sets from any statistical significance, see page 1108 in Gabbay et al. (2011) 3 Also known as the “look-elsewhere effect” or “knowledge leakage” in Machine Learning (Elkan, 2012), this stems effectively from the fact that once an algorithm was trained and evaluated on a test set, then that same test set can no longer be used to evaluate subsequent modifications to the algorithm without losing statistical significance.
6
As a benchmark task, visual object tracking naturally fulfills our requirement that ML systems should use temporal structure: typically datasets are video clips showing moving objects, often with hand-labeled bounding boxes outlining some target object. Visual object tracking is also of practical importance and can be used in multiple applications including: approaching objects, avoiding obstacles, reaching for objects, sorting objects (e.g., on conveyors), and navigating towards or around objects. Unlike image classification, visual object tracking does not rely on humancreated category labels4 . Tracking is not subject to artificially inflated scores, as has been the case when algorithms have expert knowledge that most humans do not have (e.g., super-human recognition of a sub-species, see breeds of dogs in ImageNet Deng et al. (2009)). To avoid fixation on one task, tracking can be expanded into a series of increasingly complex tasks, like target pursuit and object manipulation tasks. When benchmark scores become high, the next more complex task should be used5 . 2.5.1
Existing state-of-the-art tracking algorithms
There are various existing solutions to visual object tracking (for a comprehensive list, see references in Wu et al., 2013). Some tracker algorithms are highly engineered for a particular class of objects (e.g., human faces), whereas others attempt to be more general. General trackers typically have a brief priming phase in which the tracker is “instructed” to track the object of interest. The priming phase typically employs some sort of machine learning technique that operates on one or more static images and searches for a particular distribution of image features. Details of the trackers included for comparison in our tracking benchmark are provided in Section 3.2.2. Some trackers, like TLD (Kalal et al., 2012), incorporate motion information during learning or priming and make use of the resulting independent, but unreliable, estimate of where an object is. In these usages, motion is computed explicitly by comparing the difference between many successive frames. The resulting information is used, e.g., to improve the training of a feature-based classifier. However, much of the information present in the motion itself — i.e., the dynamics of motion for the object of interest, and the resulting image transformations — is ignored. Rather, motion is simply used as a means to identify the set of static image features belonging to the object, visible from different vantage points across time. Thus, in state-of-the-art trackers, although motion helps extract information about objects, motion itself is not directly incorporated into the learning part of the algorithm. Besides motion information, there is a lot of other valuable information in visual signals that is also not used but could be enormously informative as to the position of the object and its expected appearance. This includes the global scene context (which includes shadow distribution, source of illumination, positions of occluders, etc.) as well as temporal context (e.g., the fact that the object was recently occluded or is motion blurred because of a sudden shake of the camera). These valuable pieces of information are not used by state-of-the-art trackers since they are very hard to realize in a rigidly coded algorithm. There are several recent papers employing deep learning for online object tracking (Hong et al., 2015; Wang et al., 2015). In summary these approaches use pre-trained layers of convolutional features as a front-end to a classifier that then generates a heatmap by sliding the classifier over the entire image. These features were trained on ImageNet and for reasons we elaborate on in section 2.2 cannot represent any temporal context of the scene. Such an approach can provide good results in certain limited cases such as relatively small benchmarks (Wu et al., 2013), but are effectively equivalent to existing trackers where hand-engineered features are replaced with a convolutional net front-end. In summary, existing trackers track appearances of objects but know little about the physical reality in which those objects exist. We believe that this is a fundamental problem that can only be addressed by learning the basic physical properties of reality as presented to a visual sensor. 2.5.2
Existing visual object tracking benchmarks
There are multiple existing visual object tracking benchmarks, e.g.: • Geiger, Lenz & Urtasun (KITTI; 2012) (Geiger et al., 2013) • Wu, Lim & Yang (2013) (Wu et al., 2013) • Oron, Bar-Hillel, Avidan (2015) (Oron et al., 2015) 4 A tracker does not need to know the category membership or identity of the object it is tracking, neither its cultural context , but it should know how it transforms in physical environment. 5 An older benchmark can still be used for development if it is of practical importance, but it should not be used for research on general AI anymore.
7
• VOT challenge http://www.votchallenge.net The above-listed benchmarks are all suitable for classical tracking algorithms, but are not adequate for developing the kinds of algorithm we propose. Both KITTI (Geiger et al., 2013) and the benchmark developed by Oron et al. (2015) are focused on automotive applications, which contain primarily one type of complex, human-defined object — cars. Wu et al. (2013) is a general benchmark composed out of smaller datasets released along with tracking algorithms and contains many short clips with a large variety of different objects, consequently each object is represented by a very small amount of data. Similarly, the VOT challenge aims at (quoted from their website): “single-object short-term trackers that do not apply pre-learned models of object appearance (model-free)”. Instead, PVM focuses on building models of not just the target object but of broader visual reality. In addition, the algorithms we are developing require more data in the form of labeled video than just a single “priming” frame, which is the methodology used for most other trackers. We also require the captured video to be unadulterated – that is, it should include challenging conditions including lighting changes, shadows, reflections, backlighting, and lens flares. Finally, it is important that the continuous, unadulterated video be shot from many different and changing viewing angles (addressed to some extent in the benchmark by Oron et al., 2015)). Having investigated the benchmarks above we decided to create a moderately sized dataset that would fit our needs better (see Section 3.2.1).
Figure 3: Meta-Architectural Scale View of the PVM Circuit. This figure shows an example of PVM processing units and their inter-connectivity. PVM is a recurrent, predictive model meta-architecture of units (purple boxes) with near-neighbor (lateral) and top-down (feedback) connectivity. Sensory information, here an image from a video stream, is divided into tiles and presented at the input of the network (bottom). At each level, units process their input signal and send dimensionality-reduced signal to the next level of the hierarchy, creating the inputs at that level (orange arrows). To aid in local prediction, each unit also receives contextual information from both lateral and superior units (blue arrows). Feedback connectivity can also be configured to skip across levels. E.g., in the simulations presented here, context from the top-most is also fed back to all units in the network (connections not shown for clarity).
3
General Methods
In this section we will describe the architecture we have developed, and the methodology we used for training and testing it. The architecture is abstract in that it is not strongly dependent on the specifics of the algorithm within each unit – hence we use the term meta-architecture. The architecture design is driven by two basic requirements: 8
(1) it must learn and operate online with real world data (e.g. video), and (2) it must scale simply and efficiently (in hardware and software). The general notion of prediction of the future local signal is a powerful training paradigm that satisfies the first constraint. The architecture is composed of interconnected processing units, each of which learns to locally predict the signal it receives, using prior values of the signal and contextual information from neighboring units. Scalability is met by several properties of the meta-architecture: it is composed of a large number of identical processing units, shows good convergence time in the number of training parameters, has highly local and stable learning, comes with high availability of training data thanks to its unsupervised training paradigm, and has the ability to function without a global clock. We elaborate on these aspects of scalability in Section 5.2. Although PVM does allow for deep hierarchies, it is substantially different from existing deep convolutional networks. PVM is recurrent, with ubiquitous feedback connectivity. Indeed, in our implementations, the majority of the input to each unit is recurrent input from lateral and top-down feedback connections6 . Recurrent feedback allows PVM to discover regularities in time as well as effects of spatial and temporal context. Each PVM unit broadcasts a compressed representation of its prediction as signal input or context to other, connected units (see Figures 3 and 4). In the implementation described below, units are mostly connected to their neighbors. This connectivity reflects the fact that in vision applications the nearby spatial information is the most relevant. Nothing in the architecture, however, prevents non-neighboring, non-hierarchical connectivity which might be advantageous in other applications. PVM is predisposed to extract common-sense regularities from the data, unlike models that have to build direct mappings between 2D visual images and high-level concepts. As we discussed previously in Section 2.2, such direct mappings are complex and fraught with numerous discontinuities.
3.1
PVM architectural details
The Predictive Vision Model (PVM) is a collection of associative memory units connected into a pyramid-like hierarchy7 as shown in Figure 3. Each unit in this architecture can be thought of as an abstract processing unit serving as an associative memory. Each PVM unit: • • • •
receives a “primary” signal of moderate dimensionality (on the order of 100-d) builds an association from context and an input signal to future values of that input signal predicts the next value of the signal based on the learned association creates an intermediate, compressed (reduced dimensionality) representation of the prediction suitable for transmitting to connected units8 • has an optional “readout” layer that can be trained, via supervision, to serve as a task-related output (see Figure 4). These readouts will be later used in constructing a heatmap that will serve as output of the tracker.
Refer to Table 1 for a brief comparison highlighting the differences between PVM and existing deep learning approaches.
Information Flow Computation Spatio-Temporal Context Data Advantages of Neuromorphic Impl. Learning Example Tasks
Deep Learning Feedforward End-to-end error propagation Not used 9 Shuffled frames/vectors Small Offline, primarily Supervised Human-centric Classification
Predictive Vision Model Extensive Feedback Local prediction Top-Down/Integrated Continuous video Large10 Online, primarily Unsupervised Object Tracking
Table 1: High level comparison of existing approaches in deep learning and the proposed PVM architecure. 6 Which
is what appears to be observed in biological cortex as well (Douglas and Martin, 2007). pyramid-like structure or hierarchy are not a hard requirements of the PVM design. Other structures are possible. 8 All implementations of PVM units must output a reduced dimensionality signal for the architecture to scale, see Section 5.2. 7 The
9
3.1.1
PVM unit implementation details
Refer to Figure 4 for a diagram of a PVM unit and Algorithm 1 for pseudo-code. In the current implementation, each unit is built around a multilayer perceptron (MLP) with sigmoid activation neurons (Rumelhart et al., 1985) trained with stochastic gradient descent online (without shuffling). The task of each unit is to predict the future of ∗ this primary signal, i.e., to generate a prediction Pt+1 that approximates the true Pt+1 . Dimensionality reduction is achieved through the “bottleneck” provided by an MLP with a smaller hidden layer than the input and output layers — similarly to a denoising auto-encoder (Vincent et al., 2008). The input signal for each MLP consists of three parts. The first part of the input is the primary signal Pt , which comes from the video input or from the output of lower level units. The second part of the unit’s input consists of context inputs from lateral and superior units (as well as the top unit, in this particular tracking application). In addition, pre-computed features of the primary signal are added as a third part of the input. See Table 2 for details. Algorithm 1 PVM unit (runs in parallel for all units, synchronised by the barrier) 1: 2: 3: 4: 5: 6: 7: 8: 9: 10: 11: 12: 13: 14: 15: 16: 17: 18: 19: 20: 21: 22:
procedure PVM unit run(barrier) memory1 memory2
. Represents associative memory for the predictive part . Represents associative memory for the task readout part . memory1 and memory2 can have shared parts
while True do Synchronize(barrier) input ← Concatenate(signal, precomputed features, context) signal prediction ← Make Prediction(memory1, input) readout prediction ← Make Prediction(memory2, input) output signal ← Get Compressed Representation(memory1) Publish(output signal) . Make output available to everyone else Publish(readout prediction) . Used to create the tracker readout Synchronize(barrier) signal ← Collect Current Signal() . Actual next value of the primary signal precomputed features ← Precompute Features(signal) . Integral, derivative etc. . Supervising signal for the task readout ← Collect Current Readout() p error ← Calculate Prediction Error(signal prediction, signal) r error ← Calculate Readout Error(readout prediction, readout) Train(memory1, p error) Train(memory2, r error) Synchronize(barrier) context ← collect current context()
As noted above, PVM utilizes local learning and is currently implemented with “shallow” three-layer perceptrons. Even though the entire model can be considered deep — the model reported here has six layers of hierarchy, see below — we did not need to use of any of the recently developed deep learning techniques like convolution (LeCun et al., 1995), half-rectified linear units (Nair and Hinton, 2010), dropout (Srivastava et al., 2014) and so forth. It is worth emphasizing that there is nothing specific about this particular unit-level implementation11 and other algorithms can used as the associative memory as long as they produce a compressed representation of the prediction, e.g., Boltzmann machines (Ackley et al., 1985) or spiking networks capable of compression (e.g., August and Levy, 1999; Levy et al., 2005). 9 There are recent attempts (Misra et al., 2016) to share parts of two models for two different tasks, an approach that might be viewed as use of lateral context or co-prediction. In PVM we built this feature deep into the fabric of the architecture, such that it becomes essential part of it. 10 We elaborate in section 6.2.2 on why we believe this is the case. Notably there are hardware implementations of deep networks, but they more resemble a vectorized CPU’s than a uniform neuromorphic fabric. 11 We have preliminarily explored sending gradient information among units via their feedback connections as a part of their context (data not reported). This would make the meta-architecture dependent on gradient-based learning methods. However, our preliminary findings suggest that sending gradient information as part of context is not crucial for the network to function.
10
Output used as the primary signal in a higher area
Primary Signal (predictive)
Readout Signal (supervised)
Pt+1
Output used as lateral context
Mt+1 Predictive compressed features (output)
p r e Ht di c t i o n
Pt Primary Signal
Output used as predictive context in a lower area
Predictive feedback context
PVM Unit
Primary signal inputs from several units below
Lateral context
It Integral of Signal
Dt/t-1
Et/t-1
Derivative of Signal
Error at previous frame
Ct-1 Context
Precomputed functions (features) of the primary signal (others are possible)
Figure 4: Detail View of a Single PVM Unit. In the present implementation, a PVM unit is built around a multilayer perceptron (MLP). The two inputs to the PVM unit are the primary signal (ascending), and the context inputs (lateral and descending). The two inputs are concatenated with locally computed features and fed into the MLP (see Table 2). The output of a PVM unit is the compressed representation from the hidden layer of the MLP, which according to PVM design assumptions is of strictly lower dimension than the primary signal. In the first layer of PVM units, the primary input signal (to use and predict) consists of a subset of tiles from the image. At higher stages of the PVM hierarchy, the primary input signal (to use and predict) consists of concatenated compressed representations from a lower level. Pt : Primary Input Signal; Pt+1 : Primary Predicted Signal, self-supervised; Mt+1 : Readout Signal, supervised (i.e., used to construct the tracker heatmap).
The compressed representations from the units are concatenated and serve as the primary input signal for units in the next level of the hierarchy (see Figure 5). In addition those same compressed representations serve as context for their lateral neighbors as well as units lower in the hierarchy (via recurrent feedback connections). The context serves as an additional input alongside the primary signal that allows each unit to make better predictions and as a memory akin to that found in the Simple Recurrent Network (Elman, 1990). We further elaborate on a surprising relationship between PVM and Simple Recurrent Networks in Section 5.1. Feedback and lateral connections are a critical part of this architecture. They can be liberally wired everywhere in the hierarchy. For example, units at the top-most level of the hierarchy can send their feedback projections all the way down to the input layer. Although the locality of physical events and economy of connectivity are good reasons for predominantly local connections, long range projections may be helpful for efficiently capturing global illumination effects. Importantly, because each PVM unit is locally self-supervised by the primary signal, amplifying loops in the feedback connectivity are inherently unstable as they dissipate as soon as they start corrupting the predictions. Thus the feedback is self-stabilizing. 3.1.2
Specific architectural parameter values
The particular models described in this paper had the following sizes and values: • Six layers of hierarchy, first 16 × 16, second 8 × 8, third 4 × 4, fourth 3 × 3, fifth 2 × 2, sixth 1 PVM units, respectively. • The input image was 96 × 96 RGB pixels, chopped into 6 × 6 RGB tiles (i.e., 6 × 6 × 3 = 108 inputs), and each tile was fed into a corresponding PVM unit in the first layer. 11
Layer or Sub-layer Signal Integral Derivative Previous Prediction Error Context
Symbol Pt It Dt/t−1 Et/t−1 Ct−1
Hidden
H
Predicted Signal Tracking Task
∗ Pt+1 M ∗t+1
Number of neurons in PVM unit Definition Inputs variable ∼ 100 Fan-in from inferior layer or raw video tile same as Pt τ ∗ It−1 + (1 − τ )Pt same as Pt 1/2 + (Pt − Pt−1 )/2 same as Pt 1/2 + (Pt∗ − Pt )/2 variable ∼ 200 concat[Ht ...] from Hidden of self/lateral/superior/topmost units Output 49 σ(Wh · [Pt ; Dt/t−1 ; It ; Et/t−1 ; Ct ]) Predictions same as Pt σ(Wp · Ht ) (not sent out) variable 1 ∼ 256 σ(Wm · Ht ) To heat map
Table 2: Summary Table of a PVM Unit. Each PVM unit consists of a three layer MLP with sigmoid activation neurons. ∗ Here Pt∗ and Pt+1 are the predictions of the primary signal at times t and t+1, whereas Pt is the actual primary signal at time t. Values provided are for the models presented in this paper; other values are possible. Refer to the published source code (http://www.github.com/braincorp/PVM) for the exact way these values are obtained.
• The compressed representation formed by each PVM unit (the MLP’s hidden layer) was 7 × 7 = 49 sigmoid neurons. • Each PVM unit in the higher levels of the hierarchy received a concatenation of 4 (2 × 2) compressed representations from underlying PVM units. • Each PVM unit received lateral context from its four nearest neighbors (except for those at the edge, which received context from fewer). • If a PVM unit sends signal to a PVM unit in a higher level of the hierarchy, then the upper one sends feedback context back down to the lower one. • The top-most PVM unit sends context back to all units in the hierarchy. • The readout heatmap resolution was 16×16 pixels for all layers (entire layer) except for fifth where it was 18×18 pixels. Consequently, the readout layer Mt+1 had the following sizes for each PVM unit: 1 × 1 pixel for PVM units in first layer, 2 × 2 pixels in the second, 4 × 4 pixels in the third, 8 × 8 pixels in the fourth, 6 × 6 pixels in the fifth and 16 × 16 pixels in the sixth. • All the parameters used in the models presented here can be found in the file http://github.com/braincorp/ PVM/PVM_models/model_zoo/classic_medium.json. The parameters presented here generated models that we could train in reasonable time (several weeks) given our multicore implementation and available compute hardware (Amazon Web Services c4.8xlarge instance or equivalent). Although these values are important for reproducing the current results, they are not the only possible values. Some experimentation has shown that the model is not very sensitive to most of these values (unpublished results). The parameter to which the PVM is the most sensitive is the size of the hidden layer H (i.e., the PVM unit’s output), because varying it also changes the sizes of the input to afferent units as well as the size of the context (with fan-in kept constant). Increasing the hidden layer size would result in a supralinear (quadratic) increase in the overall size of the model and training time, both in terms of number of required training trials and total execution time. 3.1.3
Tracker readout
The tracker readout refers to the estimate of the location of the tracked object by the PVM tracker. The tracker readout is computed by averaging the output Mt+1 of multiple PVM units (Figures 6 and 7). This readout is trained via supervised learning on the training dataset, see Section 4.1 for more information. Because the model has many layers and substantial recurrence, we experimented with evaluating the model by allowing it to settle for several steps on each frame of video before estimating the target location and processing the next frame. We found that allowing the model to settle for a few steps on each frame enhanced the tracking performance slightly12 . The results presented below were obtained with the model allowed to settle for 4 frames. The algorithm to convert the readout into a bounding box is minimal (see Algorithm 2): it involves identifying the 12 By
at most 3 percent.
12
PVM Unit
Level N+1
Readout Signal (supervised)
Primary Signal (predictive)
Pt+1
Mt+1
Legend
Feedback/lateral context connections
Pt Primary Signal
Level N
Predictive compressed features (output)
p r e d i c t i o n
Feedforward connections (primary signal)
It
Dt/t-1
Precomputed features of the signal P
Readout Signal (supervised)
Pt+1
Pt Primary Signal
Pt+1
Dt/t-1
Precomputed features of the signal P
Mt+1 Predictive compressed features (output)
p r e d i c t i o n
Predictive compressed features (output)
It
Et/t-1 Previous prediction error
Context
Readout Signal (supervised)
Primary Signal (predictive)
Mt+1
p r e d i c t i o n
Ct-1
Previous prediction error
PVM Unit
PVM Unit Primary Signal (predictive)
Et/t-1
Pt
Ct-1
Primary Signal
Context
It
Dt/t-1
Precomputed features of the signal P
Et/t-1 Previous prediction error
Ct-1 Context
Figure 5: PVM Local Circuit. Several units in the lower level of the hierarchy provide their compressed predictions to a unit in the upper level. Each unit sends its own predictions up (as primary signal) as well as down and lateral (as context).
peak of the heatmap, the contour around it, and includes logic to handle the odd case e.g., when the detected peak is outside the traced heatmap countour. The algorithm uses only the heatmaps generated by the PVM — i.e., it does not include any particular logic/priors about the tracking dataset. The bounding box extraction algorithm was kept simple and fixed over our research period to avoid injecting additional priors into it and artificially inflating our tracking results13 . The heatmaps from each layer of the hierarchy are averaged and an algorithm to detect deviations from the mean value was employed to make a decision as to whether there is a peak and to estimate the counter around it. Algorithm 2 has a threshold parameter for detection that was chosen without systematic tuning and is constant for all the results shown in this document. Any reference to PVM tracking or detection threshold refers to this parameter in the bounding box calculation algorithm. 3.1.4
Execution time considerations
With its current multicore framework implementation, the entire model (as specified in this work) runs at approximately 20 frames per second on an Amazon Web Services c4.8xlarge cloud instance (36 cores at 2.9GHz) or m4.10xlarge instance (40 cores at 2.5 GHz). This enables an execution rate of approximately 1M steps per 15 hours of computing, while learning is enabled. The model runs 3-4 times faster with learning disabled, as when its performance on the tracking task is being evaluated.
3.2 3.2.1
Benchmarking and testing the model Tracker benchmark datasets
Three labeled datasets were created containing movies of: (1) a green basket ball rolling on the floor/pavement, (2) a stop sign viewed from 5-15 feet, and (3) a human face as seen from a handheld camera (see Figure 8 for a few 13 There
are likely numerous ways to improve the results by tweaking the final classifier, or even just adjusting the threshold value, but our primary focus was on building the machine learning architecture and demonstrating its usefulness on an important task, rather than on building the best visual tracker.
13
Figure 6: PVM Running in Our Software Framework. Shown is one of the models discussed in this paper with six layers of hierarchy. Top row from left to right: input frame, internal compressed representations of subsequent layers (columns 2-7), visualization of tracking heatmap superimposed on the input image (last column). Second row from the top: predictions generated by each layer (columns 1-6), averaged tracking heatmap, tracking bulls-eye. Third row: differences between signal and predictions for each layer (columns 1-6), averaged tracking heatmap scaled to [0-255] (last column), last row: individual per-layer tracking heatmaps. Note the target (stop sign) position is recovered in all the layers including the last one which is 7 perceptron layers away from the input.
examples). The datasets contained long portions of continuous video, with the objects entering and exiting the frame of view periodically. The objects were also subject to numerous lighting condition changes, shadows and specular reflection. Each data set was divided into a training set and test set. None of the test sets were ever used for training, and none of the reported evaluations were done on the training set. Detailed information on the datasets used for the results in this paper is presented in Table 3. Note that these sets are not very big by “big data” standards, nevertheless, the combined test set is larger than the Tracker Benchmark 1.0 dataset (Wu et al., 2013) used in the literature, which contains 51 movie sequences but only 23,690 frames (the complete PVM dataset is more than 6× larger). Also in terms of raw data, depending on resolution used, the dataset consists of several gigabytes of compressed images, which decompresses into roughly 100GB. Finally, we would like to note that it is relatively easy for anyone to create more data. In fact, parts of the test set were recorded after we had already trained some of our models, and we continued to expand the test set as the models were being trained on the training set. The models generalized very well to the newly acquired test data, see Section 4.2. 3.2.2
Trackers used for comparison
PVM has been tested and compared with the following state of the art trackers that we incorporated into our testing framework: • Struck - Structured Output Tracking with Kernels (Hare et al., 2011). • TLD - Tracking Learning Detection (Kalal et al., 2012)
14
Algorithm 2 Bounding box creation 1: 2: 3: 4: 5: 6: 7: 8: 9: 10: 11: 12: 13: 14:
procedure get bounding box threshold ← 32 combined heatmap ← mean(per layer heatmaps) peak ← argmax(combined heatmap) max val ← max(combined heatmap) med val ← median(combined heatmap) if max val > med val + threshold then cutoff ← (max val − med val) ∗ 0.5 + med val binary ← cv2.threshold(combined heatmap), cutoff) contours ← cv2.contours(binary) contours with peak ← find (contours, peak ∈ contour ) return box surrounding largest contour with peak peak else return empty box
Name Green ball training Green ball testing Stop sign training Stop sign testing Face training Face testing Total training Total testing
# sequences 5 29 20 30 10 25 35 84
Length (frames) 12,764 34,791 15,342 22,240 29,444 34,199 57,550 91,230
. Fixed in all our simulations
Approx. duration at 25fps 8.5 min 23 min 10 min 15 min 19.6 min 23 min 38 min 60 min
Table 3: Durations of the PVM Training and Testing Sets. These values apply to results shown in this paper. The complete data set is published to allow reproduction of the results presented here at http://pvm.braincorporation.net. Note that the test portions of the set are substantially larger than the training portions. The separation into training and testing is arbitrary (we collected training set first and then kept adding to the testing set).
15
PVM Tracker PVM (Unsupervised)
Tracker Readout (Supervised)
Average
Bounding Box (Thresholding)
PVM Tracker Output Supervisory Signal PVM Unit Tracker Readout Heatmap
Figure 7: PVM Tracker Design. The unsupervised PVM network was used as a tracker by training its units’ readout layers, Mt+1 , to generate a heatmap at each level of the hierarchy. These readouts were averaged and thresholded to generate a bounding box suitable for comparing to other trackers (or to human ground-truth labeling).
• CMT - Clustering of Static-Adaptive Correspondences for Deformable Object Tracking (Nebehay and Pflugfelder, 2015) Many other trackers exist, but the above three are typically very high performers in several published benchmarks (e.g., Wu et al., 2013) and are representative of the current state of the art. We also verified that the performance of STRUCK and TLD agrees with that reported in (Wu et al., 2013), confirming that both our tracker implementations and our testing framework are sound. In addition, we implemented two simple color trackers based on color histograms (Swain and Ballard, 1992) and Camshift bounding box estimation (Bradski, 1998): • UV Tracker - calculates the histogram of U and V channels in the YUV color space • HS Tracker - calculates the histogram in Hue and Saturation channels of the HSV color space The performance of color-based trackers is typically indicative of how informative color features are for a given dataset. Since our dataset contains two subsets of entities for which we expect color to be a very discriminative feature, namely the green basketball set and the stop sign set, we wanted to know if such a simple heuristic would be sufficient to solve the task at a satisfactory level. As the results show in Figure 10, the color histogram-based trackers listed above performed somewhat better than the state-of-the-art trackers on the green basketball set. However, contrary to our expectations their performance was far from good, and far below the PVM tracker’s performance. 16
Figure 8: PVM Dataset Examples. The dataset contains clips of green basketball rolling on floor/pavement, stop signs seen from 5-15 feet and face (one of the authors) seen from a hand-held camera. The movies are taken in everyday conditions, including varying weather, lighting, etc., using an off-the-shelf camera. The intent was to have general coverage of the kinds of conditions a robot might see in a typical human environment. The entire dataset is available for download at http: //pvm.braincorporation.net.
We also implemented two control trackers to provide a baseline for performance and to uncover positional biases in the data: • null tracker - uses the bounding box from the last frame of priming for all tracked frames (assumes the target remains where it was last seen) • center tracker - uses a bounding box centered on the frame, with 10% width and height of the frame (assumes the target is in the center). 3.2.3
Tracker performance metrics
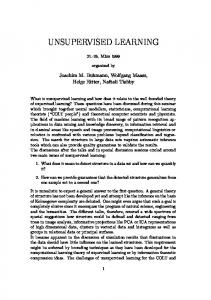
Three measures were used to evaluate tracking performance (see Figure 9): • Success (Overlap): Quantifies the quality of the bounding box. A Success plot displays the fraction of frames in which the overlap (ratio of area of the intersection to the area of the sum) of the ground truth bounding box and the tracker bounding box is greater than a given argument θ (from 0 to 1). The area under the curve quantifies the skewness of this plot, which is greater for better trackers. Success is used in state of the art tracker benchmarking, see (Wu et al., 2013). • Precision: Quantifies the quality of the center of the bounding box (see Wu et al., 2013). Precision measures the fraction of frames in which the distance between the center of the ground truth bounding box and tracked box falls below a given number of pixels, ρ. Precision at ρ = 20 pixels compares performance among trackers. The threshold of 20 pixels is used in the literature, but the meaning of the result varies as a function of the
17
resolution of the movie frames. Since PVM operates at the relatively low resolution of 96 × 96 pixels, sampling Precision at 20 pixels is not a particularly informative measure; it merely quantifies the fraction of frames where the tracked bounding box is in the correct general area of the frame. Another disadvantage of Precision is that it is only concerned with true positives and ignores true negatives. If a tracker always returns a bounding box even when the target is missing, Precision ignores these errors. These issues led us to develop a measure which is similar to Precision in that it measures the quality of the bounding box center, but also takes into account true negatives; we call it Accuracy (see below). • Accuracy: A new metric introduced by us that quantifies tracking with regards to both true positives and true negatives in a resolution-independent manner. Accuracy measures the fraction of frames in which the center of tracked box lies inside the ground truth bounding box plus the fraction of frames in which the target is absent and the tracker also reports that is is absent. To reflect how close the centers are to the ground truth, the ground truth bounding box is scaled by a parameter φ to generate a curve (φ = 1.0 means original ground truth bounding box). Thus, Accuracy is qualitatively similar to Precision but, because it operates in the units of the ground truth bounding box size, has the benefit of being resolution independent. Further, it properly evaluates trackers for times that the target is absent by incorporating the true negative rate into the score.
Quantifying Visual Object Tracking Success (Overlap) T
Accuracy
Precision
T
T
+
+ T∩G
+ G
%(
Tracker Ground truth
)
T∩G ____ >ϴ T∪G
G*(φ)
G
%(T -G +
+