Jul 2, 2004 - official inflation rates from Washington are too low. However, trying to educate my mother on this reminds me of Yogi Berra's declaration, ...
Updating Concepts and Methods for Index Numbers, Prices, and Productivity: How Are We Doing?
J. Steven Landefeld Director
SSHRC International Conference on Index Number Theory and the Measurement of Prices and Productivity Vancouver, Canada July 2, 2004
1. Introduction This paper explores how the U.S. and other countries have fared in updating the concepts and methods used in estimating index numbers for output, prices, and productivity. It focuses not only on the successes in updating but the lessons that the United States has learned that may be useful to other countries as they, and the United States, move forward on the difficult next steps in updating price and output measures. In general, while the process has been challenging, there has been significant progress in updating concepts and methods that have greatly improved the accuracy of measures of economic growth, inflation, and productivity. There has also been important progress in building the professional consensus around the concepts, methods, and source data needed to move forward in updating price and output measures in a consistent way around the world. 2. The U.S. Experience In the United States, the introduction of hedonic and other quality-adjusted indexes, along with superlative index methods have produced more accurate and unbiased estimates of inflation, productivity, and growth appropriate to the period of analysis. These improvements have been extremely important to the Federal Reserve Board and other federal, state, and local policy makers; business economists; and academic researchers. These innovations have also eliminated the re-rewriting of economic history that occurred each time fixed-weighted price and output indexes were updated. The use of fixed weights significantly distorted past events since weights that reflect spending and prices during recent periods have differed—sometimes dramatically—from spending patterns and prices in the past. The use of the very high 1992 U.S. prices of defense equipment— including the much publicized $200 Air Force screwdrivers and toilet seats—to value the massive WWII demobilization when prices for military equipment and supplies were so depressed that military goods were being surplused and buried to keep them off the market resulted in a major overstatement of the real decline in government spending and GDP.1 BEA’s switch from fixed 1987 dollar weights to chain indexes (which use the weights of the demobilization period to calculate real growth for that period) reduced the post WWII decline in real GDP from 21 percent to 11 percent. In addition to misstating growth in specific periods in the past, the switch to chain weights eliminated the persistent substitution bias in GDP that resulted in the understatement of growth for periods before the base year (by using the lower, more current base period price weights for goods and services whose relative prices were falling and volumes rising) and an overstatement of growth for periods after the base period (by using the higher past period price weights for goods and services whose relative prices were falling and volumes rising). As was seen in the latest benchmark revision of the NIPAs, the switch to chain indexes has contributed to a significantly smaller revision to economic history by eliminating revisions caused by rebasing. 1
The very large decline in real GDP in the post WWII period was first brought to my attention by the late Senator Moynihan at the time he was pressing for the use of updated price measures. Senator Moynihan observed that the post WWII decline was almost as deep as the “great” depression, although he had no recollection it being that bad, and worse yet, according to BEA, it seemed to be getting worse with the passage of time, as we rewrote history in our benchmark revisions!
(If BEA were still using fixed (1996) dollars, the latest benchmark would have lowered growth over the 1996-2002 period from 3.8 percent to 3.2 percent) Improvements in measuring prices and output have not been limited to hedonic indexes for computers but a significant expansion of hedonic indexes for goods and services with rapidly changing characteristics and prices that are hard to measure efficiently and accurately with conventional matched-model indexes alone. There has also been a major expansion in difficult to measure services prices. The U.S. Bureau of Labor Statistics has expanded its coverage of producer prices for services from less than 10 percent of services prices to over 50 percent, with major improvements in measures ranging from medical care to financial services. The use of chain, or superlative indexes, have become widespread. All of BEA’s national, international, regional, and industry accounts use them as do the Federal Reserve Board’s (FRB) industrial production indexes, the Bureau of the Census’ International Trade in Goods estimates, and the Bureau of Labor Statistics’ (BLS) productivity and various price indexes. The introduction of hedonic and other new price indexes have, along with chain indexes, resulted in a number of analytical insights, including a better understanding of the role of technology in growth, of the contributions of services to growth, and of the rate and contribution of inflation in medical care and other services to overall inflation. The less positive aspects of these changes in the United States were related to the additional computational and analytic complexity of these new measures and the temporary reduction in the comparability of U.S. GDP and other statistics to those of other countries. 3. The International Experience The U.S. experience in improving price and output measures is intertwined with the world experience. Over 50 years ago, for example, voices on both sides of the Atlantic—Sir Richard Stone, Simon Kuznets, and Irving Fisher—pointed to the potential importance of chain or superlative indexes, albeit with cautions about their complexity and the need to balance their use with the practical need for them (which became obvious in the United States through the examples of computer prices in the 1980s and 1990s and the spike in oil prices in the 1970s and agricultural prices in the 1980s). In the 1980s and 1990s, increased attention was paid to price and real output measurement and the importance of these issues was underlined by recommendations in SNA 1993 with respect to superlative price and output indexes and quality-adjusted output indexes. Since then we have increasingly seen the adoption of chain indexes and hedonics and other quality adjustments in countries measures of GDP (see Tables 1 and 2). The increased attention to price and real output measurement, especially in difficult to measure areas, has been reflected in the growing consensus on the source data and methods necessary to improve measurement. Recent manuals such as the OECD manual for ICT, the Eurostat Hedonic study, and the International PPI and CPI manuals lay the framework for future improvements as well as more consistent data across countries.
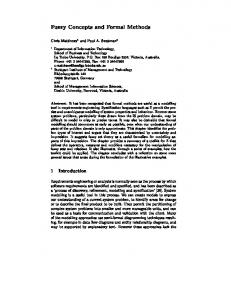
Studies such as the OECD study2 have improved understanding of differences between measured growth in the United States, Europe, and other countries. In general, they have shown that relatively little of the differences in growth between Europe and the United States are due to measurement and that overall growth in Europe is unlikely to be affected by the adoption of hedonics and the use of chain indexes. The use of a hedonic index will result not result in a large impact on overall GDP growth in countries that import a substantial share of their computers. It will—as Australia found—result in an increase in the growth rate for investment and those components of final demand with large computer purchases, but these will be offset by the subtraction of imports in the calculation of GDP. In addition, any net increase in GDP growth in recent periods is likely to be more than offset by the move to chain indexes, which lower growth in recent periods relative to fixed weighted indexes. Most countries—with the exception of Japan—are more likely to see a larger impact on relative growth rates of specific components and from exchange rate, oil, and other price shocks than an overall increase in trend growth from an hedonic adjustment for computers. 4. U.S. Experience: Lessons Learned 4.1. Building Consensus The introduction of hedonics and other quality-adjusted indexes in the United States has been challenging, but we have learned a number of lessons that have proved useful in other areas as we have updated our statistics and will be useful in the future as we make further changes in measurement. One of the first lessons, was the need to vet the proposed methods and data with relevant professionals (including BEA’s own staff) so as to build a professional consensus. BEA did this by a long-series of articles over a number of years by Jack Triplett, Alan Young, Bob Parker, and me in official and outside publications that laid the case for chain indexes and hedonics, along with estimates of the impact of alternative methods (see Tables 3 and 4). Individual and large meetings with leading academic economists and government officials help make the conceptual and empirical case for such change and eventually a near consensus amongst this group on the need for change. This consensus among these measurement “experts” was essential to moving forward to the changes to a broader audience including macroeconomists using the data, the press, members of the Administration and the Congress, and the public. Macroeconomists were extremely reluctant to abandon the additive models and methods that they had used throughout their professional careers, but when confronted with BEA data showing the large biases embodied in fixed weighted indexes and the professional consensus among leading measurement experts, they reluctantly backed the move to the new indexes. This process was helped mainly by working with BEA to develop new analytic devices that would ease the use of the new indexes.
2
Ahmad, Nadim, François Lequiller, Pascal Marianna, Dirk Pilat, Paul Schreyer and Anita Wölfl. “Comparing Labor Productivity Growth in the OECD Area: The Role of Measurement.” Directorate for Science, Technology and Industry. OECD. 2003/14. DSTI/DOC(2003)14.
Building a consensus with experts and users was essential to the successful roll-out of the new indexes to the press and to members of the Administration and Congress. The roll-out to the press involved a series of briefings followed by 6-months worth of GDP press releases showing the old and new indexes side-by-side. Most of the press stories by major newspapers and news magazines, such as the New York Times, the Wall Street Journal, and the Washington Post, were quite positive, in great part because of the positive endorsements they received when they independently interviewed key users of the data and measurement experts. However, some outlets panned the new indexes, particularly those who believed in the “new economy,” thought that the economy growth potential was underestimated, and felt that monetary policy needed to be more accommodative (see Box 1). Box 1: Professional Consensus and Mainly Positive Press, But… “When Two Plus Two Equals Five” Journal of Commerce, July 1995 “A wise man once claimed that the main activity of government was correcting its own mistakes.” “How Not to Measure the U.S. Economy” Business Week, Jan. 1996 “The new GDP benchmark…lowers economic growth rates, moving us further away from the truth instead of closer to it.” “Lies, Damned Lies, and the U.S. Commerce Department’s New Way of Measuring GDP” Financial Times, Jan. 1996 “The main effect of the new measure is to depress estimates of recent economic growth while significantly boosting the economy’s apparent performance in previous decades.” The roll out to members of the Administration was also relatively smooth. Professional economists in appointed positions in the Administration were able to confirm that the change was needed and right by their review of BEA’s own materials and by consulting with the experts and users. This was useful when a slight snag occurred in the roll-out. When President Clinton was presented with the memo from his Council of Economic Advisers outlining the upcoming change in GDP that would lower measured growth during his first term in office, the memo came back to the CEA with a note scrawled on it that appeared to read “this is news!” However, it was determined after more careful inspection to read, “this is nuts!” Assurances from his CEA that it was the right and necessary thing to do and that the timing was part of BEA’s regular benchmark revision schedule quickly allayed Presidential objections. 4.2. The Need for Continuing Education As BEA was to learn, these early successes notwithstanding, the importance of the data will always pull new concepts and methods into public debate and, as a result, there is an ongoing need for education. After a period of relative quiet in the five years following BEA’s introduction of chain indexes in 1995, a new round of debate on the measurement of growth and inflation began in 2000. This round was prompted, in part, by increasing interest in Europe, particularly by the Central Banks in moving toward U.S. measurement practices. This ignited a round of debate on these methods similar to that which occurred earlier in the United States. This debate then spilled over into the United States (see Box 2)
Box 2: Hedonics Round II: Spillover From Europe “America’s Hedonism Leaves Germany Cold” Financial Times, Sept. 2000 “U.S. methods of price indexing, particularly for computer-related products, exaggerate output compared with European rivals.” “The Productivity Mirage” The New Yorker, Nov. 2000 “Are computers really that important?” BEA responded as it has in the past by getting out the facts on hedonics, including data showing that a) while roughly 20 percent of real GDP was estimated using hedonic price measures, with the exception of computers, there was no net effect on overall GDP growth positive or negative relative to using conventional price indexes; b) hedonic estimates for computers were quite robust no matter how they were estimated and by whom (see Table 5) and produced virtually identical estimates as an appropriate IT-weighted conventional index for computers (see Table 6); and c) computers and computer software, while important, did not explain most of the ramp up in U.S. growth. Finally, it was pointed out—and recently confirmed by the aforementioned OECD study—that differences in U.S. versus European markets and the effect of the switch to chain indexes suggested that the switch to hedonics would result in only small changes to overall European growth. In 2002 and 2003, BEA was once again confronted with concerns about overstatements in U.S. growth. This round was prompted in part by revisions to Corporate Profits, the search for culprits in the decline in markets and the economy, and early positioning for the 2004 Presidential election, with the quadrennial question, “Are you better off than you were four years ago?” Box 3: Hedonics Round III: Spillover From Enron “A True and Fair View of Productivity” Financial Times, March 2002 “Alan Greenspan has endorsed an overstatement of U.S. economic performance comparable to Enron’s accounting method.” “Stupid Tech Tricks” San Francisco Chronicle, Nov. 2003 “To confuse matters, the Commerce Department calls the adjusted numbers real and the actual dollars spent nominal.” BEA responded with facts, although this time by providing them to journalists and economists that decided to rebutt the arguments themselves. BEA also decided to change the presentation of its data—which was contributing to confusion over the importance of computers to growth—and by providing additional analytic devices to assist users of the chain indexes.3 4.3. The Need To Proceed with Ambition, but with Care Although much attention was devoted to the roll-out of new data, BEA also learned many other important lessons. On a practical level, we found that the computer requirements of producing chain indexes, updating hedonic indexes, bringing in new price and output indexes, implementing the new NAICS industrial classification system, and other changes are extremely large and complex. These requirements have at times presented consistency and production
3
See Landefeld, Moulton, and Vojtech: “Tips on the Use of Chain Indexes,” Survey of Current Business, November, 2003
problems for our customers. As we move forward we are trying to be sure that we do not underestimate the time and resource requirements for such changes. We originally focused on real GDP, but belatedly realized that the needs of other programs at BEA—concepts, methods, and source data—needed to be considered. Implementing chain indexes, and maintaining consistency throughout BEA national, regional, industry, and international accounts, has been challenging. In some areas, such as the industry accounts, we are still working on better solutions. Although, it is often necessary to move forward without having worked out all the finer details, additional advance planning can be helpful. 5. Next Steps Looking ahead, reveals a daunting set of challenges. Some of the largest remaining measurement gaps are in extremely difficult to measure areas, such as education, where there the stakes are extremely high. The efficiency of public and private expenditures in education are the topic of a continuing national debate, and the need for performance measures is high. Any price and real output measures that national accountants develop will receive a high degree of attention and be buffeted by interest groups on all sides of the issues. The challenges are also daunting because there is so little adequate data. The new measures of education and other services must be robust, but without adequate data for the purpose at hand, the results will vary according to whatever data is roughly related and available and the model used by the researchers constructing the estimates. This is an approach similar to the familiar story of the drunk looking under the light post for his keys; not because he lost them there, but that is where the light is. What will be needed in many areas will be the development of new concepts and source data, both of which take time, and in the case of new data collection, significant resources. And finally, we will always have a need for continuing education on price measures and inflation. Sometimes on complex new measures, but sometimes on the most basic concepts. My mother and most people over a certain age are unable to distinguish lifetime from annual inflation rates, and in comparing the prices of the 1940s to today’s prices, they are sure that the official inflation rates from Washington are too low. However, trying to educate my mother on this reminds me of Yogi Berra’s declaration, “A nickel isn’t worth a dime today.”
Table 1: International Trends—Adoption of Hedonics Consumer Prices Australia Canada Denmark Finland France Germany Japan Korea Norway Sweden U.S.
Producer Prices
computer equipment cars computers, clothing, household appliances, and books computers computers
clothing clothing, computers, rent & new houses
National Accounting U.S. computer indices computers U.S. computer indices computers
technology products technology products computers computers technology products
computers
computers computers, semiconductors, homes, photocopy machines
Source: OECD. 2002. Main Economic Indicators: Comparative Methodological Analysis Consumer and Producer Price Indices. vol. 2002. sup. 2. pp. 51-53, 84. Linz, Stefan and Gudrun Eckert. 2002. "Introducing Hedonic Methods in Price Statistics." DeStatis.
Table 2: International Trends—Adoption of Chain Indexes
Australia Austria Belgium Canada Czech Republic Denmark Finland France Germany Greece Hungary Iceland Ireland Italy Japan Korea Luxembourg Mexico Netherlands New Zealand Norway Poland Portugal Slovak Republic Spain Sweden Switzerland Turkey United Kingdon United States
Producing chained constant prices Yes
Plans to disseminate chained constant prices December 2004 December 2006
Yes Yes July 2005 February 2006 May 20061 May 2005 Yes 2006 No November 2005 Autumn 2005 n.a.
January 2005 No
Yes Yes Yes Yes2 Yes March 2006 May 2005 Yes 2005 End 2004/2005 Yes Yes
Seasonally Seasonally adj. and trading day Plans for estimates only adj. estimates trading day adj. Yes Yes Yes Yes Yes Yes Yes Yes Yes Yes No Yes2 No No No Yes No Yes Yes3 Yes n.a. n.a. No No No Yes Yes No Yes Yes2 Yes Yes2 No Yes Yes2 No4 Yes No No No Yes Yes
Note: Shaded boxes represent countries that force the sum of their trading day adjusted series to the annual gross value. Source: Harary, Micheline. 2004. “The Quarterly National Accounts (QNA) Database. OECD. Prepared for the Working Party on National Accounts held on October 12-15, 2004. 1. Experimental calculations. 2. For a small number of aggregates, not for the whole set of QNA3 Adjusted for leap year, no trading day adjustment found necessary. 3. Adjusted for leap year, no trading day adjustment found necessary. 4. Also adjusted for irregular variations.
Table 3: Introducing Chain Indexes Producers' Durable Equipment (Percent change from preceding period)
14 11.7
12
11.5
10 8.1
8.0 8 6
5.4
4.8
4 2.2 2
2.5 1.4
1.6
0.9
0.0 0 1985
1986 Current dollars
1982 dollars
1987
1988
Chain-type price index
Source: NIPA Table 8.1 in the Survey of Current Business. July 1989.
Table 4: Rates of Change in Real GDP: Comparison of Alternative Measures During Economic Expansions (Percent)
6 5 4 3 2 1 0 1960:IV1969:III
Source: Historical BEA tables.
1970:IV1973:IV
1975:I1980:I Fixed 1987 Weights
1980:II1982:III1981:I 1990:II Chain-type Weights
1991:I1995:II
Table 5: The Need for Robust Results Hedonic Studies of Computer Prices Author 1
Computer type
Chow Triplett Cole et al. Cartwright Gordon Cohen Berndt and Griliches Berndt, Griliches, and Rappaport Nelson, Tanguy, and Patterson Chwelos Berndt and Rappaport 2
Aizcorbe, Corrado, and Doms
BEA price index
Prices: Annual rates of change
mainframe mainframe mainframe mainframe mainframe personal computer personal computer mobile personal computer desktop personal computer desktop personal computer laptop personal computer desktop personal computer personal computer
Time period 1960–65 1953–72 1972–84 1972–84 1951–84 1982–87 1982–89 1989–92 1989–92 1984–91 1990–98 1992–98 1976–83
personal computer personal computer personal computer desktop personal computer notebook personal computer
1983–89 1989–94 1994–99 1994:IV-1998:IV 1994:IV-1998:IV
–18 –32 –39 –31 –26
personal computer, weighted avg. 3 personal computer
1994:IV-1998:IV 1994:IV-1998:IV
–30 –32
–21 –27 –19 –14 –22 –25 to –27 –23 to –25 –23 to –24 –31 to –32 –18 to –25 –40 –32 to –35 –18
Source: Landefeld, J. Steven and Bruce T. Grimm. 2000. “A Note on the Impact of Hedonics and Computers on Real GDP.” Survey of Current Business. vol. 80, no. 12. pp. 17-22. 1. See article for complete citations. 2. Results reported for "all pooled" regression, (Berndt and Rappaport 2000). 3. Weights are 0.75 for desktops, 0.25 for notebooks.
Price Indexes for Computers: Average Annual Rates of Decline, 1994:IV to 1998:IV Percent Traditional
Hedonic
NIPA Private fixed investment: Computers and peripheral equipment ...................
------
–23.7
Personal computers ..............................................
------
–32.5
Aizcorbe et al. : Desktop personal computers ................................ Notebook computers ............................................
–30.6 –24.6
–31.0 –26.3
Weighted average 2 ..............................................
–29.1
–29.8
1
Table 6: The Need for Robust Results Source: Landefeld, J. Steven and Bruce T. Grimm. 2000. “A Note on the Impact of Hedonics and Computers on Real GDP.” Survey of Current Business. vol. 80, no. 12. pp. 17-22. 1. Source: Aizcorbe et al. 2000. 2. Weights are 0.75 for desktops, 0.25 for notebooks.