USE OF RANDOM SAMPLING AND BAYESIAN METHODS IN THE PREDICTION OF CHESTNUT TIMBER BEAMS BENDING STIFFNESS Hélder S. Sousa1, Jorge M. Branco2, Paulo B. Lourenço3 ABSTRACT: The assessment of global bending stiffness of three old timber beams is predicted by use of random sampling and Bayesian Network approaches. The information for the prediction models derive from the visual grading and localized mechanical testing of 20 beams retrieved from the same building, which have been scope of analysis in previous studies. Although the results indicate moderate correlations between predicted and experimental results, significant percentage errors are also found. To minimize the percentage error between experimental and predicted values, coefficients corresponding to the scale effect relation between existing chestnut timber elements with round cross section and sawn beams of smaller dimensions with rectangular cross section were proposed.
KEYWORDS: Bending modulus of elasticity, Random sampling, Bayesian Networks
1 INTRODUCTION 123 Due to timber's inherent variability and susceptibility to decay, the safety evaluation of existing timber structures is a complex task, which requires obtaining information from different sources. Often, characterization of timber elements belonging to existing structures is made by the sum of several contributions including results from geometric characterization, visual inspection, nondestructive tests (NDT), mechanical tests, and others [1, 2]. In the case of the geometrical characterization of old timber elements, large coefficients of variation may be found in the definition of the cross section dimensions, reaching values of 20% for round elements and even up to 40% for decayed elements [3]. Moreover, variability of the mechanical properties of structural size timber elements are dependent on the relation between clear wood sections and sections with defects [4, 5]. Therefore, the mechanical grading of timber using only clear wood specimens has also to be complemented with visual grading [6]. With those results, a structural timber element can be assessed and graded regarding the combination of mechanical tests conducted to clear samples with the characterization and analysis of defects. Thus, it is of utmost importance to define methodologies which allow to incorporate information, given by these different sources,
and to hierarchically classify them in such manner that are prone to be updated with posterior information. Those methodologies have also to take into account the need to preserve the structural and, in many cases, the aesthetic conditions of the timber element. Therefore, the extraction of samples for testing should be avoided, or at least, taken to the minimum number of specimens required for the level of precision needed in the structural analysis. In this scenario the use of probabilistic methods is a feasible approach to take into consideration the mentioned variability in timber’s mechanical properties [7], cross section dimensions [8] and level of decay [9], in a hierarchical framework. Hence, this work presents different probabilistic approaches to infer the global bending modulus of elasticity (Em,g) of three old chestnut (Castanea sativa Mill.) beams, with information of visual grading of structural size elements and information from a previously created database of local bending modulus of elasticity (Em,l) tests on smaller size specimens. In a first approach, and aiming at minimizing the number of specimens, prediction of Em,g is made by simulation of samples through random sampling of local data. After, inference on Em,g is considered by use of a Bayesian Network (BN) regarding information divided by size scale, visual grading and results of local bending tests.
2 BACKGROUND 1
Hélder S. Sousa, ISISE, University of Minho, 4800-058 Guimarães, Portugal. Email:
[email protected] 2 Jorge M. Branco, ISISE, University of Minho, Portugal 3 Paulo B. Lourenço, ISISE, University of Minho, Portugal
In a prior work [10], a multi-scale experimental evaluation of 20 old chestnut (Castanea sativa Mill.) beams was considered, aimed at defining the correlations between
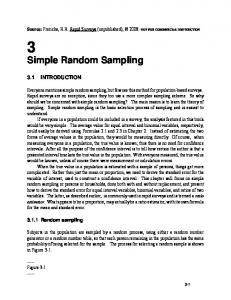
bending modulus of elasticity (MOE) [11] in different scales of timber elements in combination with visual grading [12]. That experimental campaign was composed by three scales (Figure 1), where specimens of smaller dimensions were taken from existing timber elements and tested in 4-point bending tests along its length. Phase: 1
2
3 METHODS 3.1 EXPERIMENTAL CAMPAIGN
300 15 7
3
models for the analysis of existing timber elements with the same conservation conditions observed onsite. Moreover, a BN is proposed also to infer about the Em,g with respect to the same sources of information.
4
top middle bottom
7 10
50
90
130
170
210
250
290
right
left central
[cm]
Figure 1: Definition of specimens for the different testing phases, adapted from [10]
The first phase considered the old beams with their round cross section and in the same state of conservation as they were in the construction site. So the old chestnut beams were visually inspected and graded with respect to Italian standards [12] and complemented with NDTs results. The round cross section elements were then sawn to regular cross section elements in phase 2. Therefore, the second phase corresponds to the removal of the decayed surface and testing of sawn beams with 7×15×300 cm3 regular cross section. The beams were marked on 7 segments of 40 cm and the defects found in each segment were accounted. Then 4-point bending tests [11] were made to each beam, obtaining local (Em,l) and global (Em,g) moduli of elasticity in bending. After the bending tests, in phase 3, the beams were sawn into 3 boards with 7×4×300 cm3 regular cross section. Each board was then visually inspected on each 40 cm segment. To each segment of each board a 4-point bending test in elastic range was made in order to assess the variation of MOE along the element's length and height. Regarding the results of the 4-point bending tests, strong correlations within the same size scale (coefficient of determination r2 from 0.82 to 0.89) and moderate to high correlations for different phases (r2 from 0.68 to 0.71) were found for bending MOE. Following, by use of visual grading combined with bending MOE results in smaller size scale specimens (sawn boards’ segments), models for prediction of Em,g of structural size members were considered (sawn beams) [13]. These models, by use of random sampling selection, predicted the behaviour of full size scale elements accurately, with strong correlations to the experimental results (r2 from 0.70 to 0.79) and a percentage error lower than 20%. In this work, three floor beams, retrieved from the same building as the previous mentioned beams, were tested in bending as to verify the possibility of use of the prediction
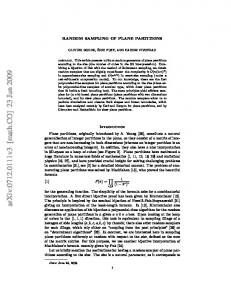
3.1.1 Test samples and testing sequence The tested elements correspond to three old chestnut (Castanea sativa Mill.) beams (Figure 2), designated further on as B1, B2 and B3, retrieved from a construction site located in North Portugal. They served as structural floor beams and were supported, in both endings, by granite masonry walls. The elements are more than a century old and were removed and replaced due to remodelling of the building. Although from the same construction site, the origin of the wood is not known but assumed to be from the same region, since chestnut was commonly found in that place and time.
Figure 2: Tested beams with detail of the traditional indentations for the floor support
In a first phase, the cross sections dimensions of the beams and its wane, were measured at each 40 cm segments. Visual inspection was made to each of the 40 cm segments in order to obtain a described grading of the element along its length as well as an overall grading of the structural element. To those same segments, NDTs were performed in order to assess the depth of decay. Both impact penetration tests and resistance drilling tests were considered for that purpose. Following the initial geometric characterization and nondestructive testing, the beams were tested in 4-point bending tests, according to [11], obtaining both Em,l and Em,g. Since the beams had different lengths, also different locations for the supports and consequently different spans were used for each beam. In the beams with bigger length (B1 and B2), also smaller span tests were performed in different segments of the beams, as to have a comparison basis with the smaller length beam (B3). With that procedure, for the B1 and B2 beams it was also possible to analyze the variation in MOE along their length, and compare it to the visual grading made by segments. Five bending tests were made for beams B1 and B2 each, and one test was made to beam B3, thus a total of eleven bending test results were obtained. Table 1 indicates the span between supports for each of the tests, and the
a)
b)
As no small size specimens were taken, the results obtained in the bending tests of small specimens in [10] were considered as a database of prior empirical data for the probabilistic analysis of this work. 3.1.2 Visual inspection Visual inspection is one of the first and most important steps to be carried out in a structural diagnosis. During the inspection, data is gathered to define the general state of the structure and, thus, different evidences of structural pathologies are documented and classified according to its extent and severity. In existing structural timber elements the most important aspects to be considered are the presence of natural growth defects, such as knots, slope of grain, cracks, moisture and / or water infiltrations and the presence of biological activity leading to decay (Figure 3). The presence of deformations and structural damages are also to be reported. In this work, due to the need to define indicative values for the mechanical properties of existing timber elements through visual grading and also due to the species of timber of the beams, the Italian norm UNI 1119:2004 [12] was considered. This norm establishes objectives, procedures and requirements for the diagnosis of the state of conservation and estimates the mechanical properties (resistance and stiffness) for structural wood elements present in cultural heritage buildings. Its methodological approach consists in the execution of a visual inspection and application of NDT. For strength grading of a single element, this norm considers three classes (I, II and III) regarding onsite diagnosis for a given timber specie (Table 2). The wood element is from a given class if it fulfills all the imposed requirements and considered as nonclassifiable if it does not fit to neither class. In this work for the three beams, 40 cm segments were considered for visual grading and the significant parameters were reported. Single knots were measured considering the ratio A of the minimal diameter d of the
Figure 3: Example of defects found: a) decay and cracks; b) knots and slope of grain
Table 2: Mechanical properties for Chestnut (Castanea sativa Mill.) in a visual strength grading [12]
Mechanical properties (N/mm2) compression Class
MoE in bending
B3
2511 2511 2511 3800 4184 2511 2511 2511 3800 4184 2511
1st support (mm) 328 1164 2001 520 328 338 1174 2011 530 338 129
shear // to grain
B2
Span (mm)
tension // to grain1)
B1
Bending test B1.1a B1.1b B1.1c B1.2 B1.3 B2.1a B2.1b B2.1c B2.2 B2.3 B3.1
static bending
Beam
⊥ to grain
Table 1: Beams’ span for bending tests
knot to the width of the element face, while knot clusters were evaluated through the ratio W of the sum of the minimal diameters t of all knots, in a 150 mm range (or until the fibers have not realigned to their normal direction), to the width of the element face. Wane was measured considering the ratio s of the oblique dimension and the height of the cross-section. Presence of biological attack was also identified and reported.
// to grain
distance from the beginning of the beam. The length of the spans and test setup was defined according to [11] as it will be latter described.
I 11 2.0 12 11 0.8 10000 9000 II 9 2.0 10 9 0.7 III 7 2.0 8 6 0.6 8000 NC2) 1) tension ⊥ to grain is conventionally assumed to be equal to zero 2) NC: non-classifiable 3.1.3 Non-destructive methods In this test campaign two NDTs, namely impact penetration tests and drilling resistance tests, were considered both for increasing the reliability of the visual inspection and to assess the depth of decay along the length of each beam. The equipments used were the impact
hammer Pilodyn 6J and the controlled drilling device Resistograph 3450. The Pilodyn 6J is a device that, through the release of a spring, transforms the elastic potential energy into impact energy. The penetration depth of a metallic needle with 2.5 mm of diameter can be measured and the depth is inversely proportional to the density of wood, which is rather interesting to measure surface fungi deterioration [14]. The Resistograph is a commercial testing equipment based in micro-drilling wood at constant speed, and measuring the energy required for maintaining that speed. It is usually adopted to obtain density profiles and allow to characterize the full size of the specimen [15]. Initially, the impact penetration tests were made to all of the 40 cm segments of the beams and to all four faces, in order to obtain a qualitative comparison between segments and thus define the sections with presence of decay depth. For that purpose, the values of penetration depth made to reference specimens without defects or decay, from a prior database [16], were considered. The penetration impact tests were firstly considered as they are a fast and inexpensive method, providing straightforward results for an initial characterization of the surface layer of timber elements. Then, drilling resistance tests were made on the sections that evidenced higher depths of superficial decay in the impact penetration tests previously made. The value of decay depth for those cross sections was obtained for each surface through the mean value of two measurements regarding the profiles obtained by the drilling resistance equipment (Figure 4). The profiles were analyzed, accounting to each initial measurement (needle entry) and last measurement (needle exiting) in the timber elements, as to minimize the effect of possible lateral friction. Measurements deviating more than 5% of the path length from the expected straight path were not considered, and the measurement was repeated. Measurements were made at a third of the cross section height or base. 4
1
1’
2
2’ 3’
4’
drilling resistance
600
3
450 300 150 0 0
50 100 drilling path (mm)
150 decayed layers
Figure 4: Identification of drilling resistance tests on a cross section and example of a resultant profile
The combination of the above techniques allowed the definition of the decay depth along the length of each beam, and consequently the residual cross section.
3.1.4 Bending tests The timber elements were subjected to bending tests according to the test procedures given in norm EN 408 [11] which specifies laboratory methods for determination of physical and mechanical properties of timber in structural sizes. Although this norm is not intended for grading or quality control, it provides a standardized framework to obtain basic material properties that may be complemented with grade determining features, given for instance by visual inspection, for strength class grading. The bending tests were made according to a 4-point bending configuration. The test specimen length, l, and the distance between the supports and the loading positions are proportional to the depth of the cross section, h. With respect to the properties of timber in bending, this norm suggests the determination of both a local modulus of elasticity, Em,l, and a global modulus of elasticity, Em,g. The difference between these moduli of elasticity depend on the gauge length of the measurement and also the stresses that the element is subjected within that range. The Em,l is measured in a distance of five times the height of the cross section, while the Em,g is measured along the full span of the beam between supports. The elastic moduli are calculated according to Equations (1) and (2): E m, l =
E m,g =
a ⋅ l12 ⋅ (F2 − F1 ) a ⋅ l12 ⋅ ∆F = 16 ⋅ I ⋅ (w2 − w1 ) 16 ⋅ I ⋅ ∆ w
(1)
3 ⋅ a ⋅ l 2 − 4 ⋅ a3 6⋅a ∆w 2 ⋅ b ⋅ h3 ⋅ 2 ⋅ − ∆F 5 ⋅ G ⋅ b ⋅ h
(2)
where b is the width of the cross section (mm), h is the height of the cross section (mm), ∆F is an increment of load (N), ∆w is the increment of deformation (mm) corresponding to ∆F, a is the distance between a loading position and the nearest support (mm), l is the span between supports (mm), l1 is the gauge length (mm) for the determination of Em,l, I is the inertia moment (mm4) and G is the shear modulus (N/mm2). As the shear modulus was not obtained experimentally, its value was assumed to be unknown and taken as infinite as suggested in [11]. The tests were made with displacement control and the displacement rate was calculated such that the applied load necessary for calculation of MOE (40% of the estimated maximum load) was reached at 120 s. Due to the decayed surface and consequent predicted crushing of the timber fibers near the support and loading points, three loading cycles were considered (Figure 5). The first cycle was used for adjustment and calibration of the loading machine to the specimen and to mitigate the effects of the possible crushing made by the loading process. Therefore, the results of the first cycle were disregarded and the final values of Em,l and Em,g were
obtained through the mean value of the results of the second and third loading cycles. F
cycle 1
cycle 2
cycle 3
0.4⋅F
120s
120s
...720s
time
Figure 5: Loading cycles for the 4-point bending tests
For Em,l determination, two LVDTs were placed on each lateral face measuring the deflection at the expected neutral axis position, while Em,g was obtained through the LVDT deflection measurement at middle span between supports. Figure 6 shows an example of one of the 4-point bending tests.
floor beams with lower classes (II, III, and nonclassifiable, NC) based on the results of [13]. The random selection of specimens was repeated until a significant sample was obtained. A significant sample was considered to be reached when the coefficient of variation of the values of predicted Em,g stabilized. Following, the mean value of the sample was correlated to the experimental results. The methodology used for obtaining the value of the predicted Em,g of the structural size beams, by use of random sampling of results from a prior database of small size specimens, and its comparison to the results of existing timber elements, is schematized in Figure 7. Prior database small specimens
Prediction model modelled beam
Existing elements structural beams Visual grading per segment
Visual grading class I segments
Location of segments with I, II, III and NC visual
reduction coefficients Local modulus of elasticity
Random sampling generation
Figure 6: Beam B1 under a 4-point bending test
3.2 RANDOM SAMPLING After obtaining the visual grading per segment of each beam, the results of an existing database regarding small size specimen tests, taken from other beams from the same building, was used for prediction of the Em,g of the structural size beams. The prediction model considers the computation of measurements of small size specimens’ MOE, by modelling a reconstructed beam taking into account the visual grading of each segment. Therefore, for each segment of the reconstructed structural beam, it is attributed the value of MOE corresponding to a result, randomly selected, taken from the database of small specimens with the same visual grade. After, the displacements of each segment’s nodes are calculated by the direct stiffness method and the calculation of Em,g of the reconstructed beam obtained by Equation (2). In this work, only small size specimens with higher visual grading (class I) were considered for random sampling. Reduction coefficients were used for the segments of the
Model: predicted Em,g Experimental: beams’ Em,g
Figure 7: Schematic process for the prediction models using random sampling
3.3 BAYESIAN NETWORKS BNs are used to represent knowledge based on Bayesian regression analysis describing the causal interrelationships and the logical arrangement of the network variables. BNs are represented by directed acyclic graphs (DAG), composed by a set of nodes, representing each system variable, connected by a set of directed edges, linking the variables according to their dependency or cause-effect relationship. Each variable node represents a random variable, either defined as a continuous random variable or as a finite set of mutually exclusive discrete intervals.
The main objective of a BN is to calculate the distribution probabilities regarding a certain target variable, by considering the factorization of the variables' joint distribution based on the conditional relations within the developed generic algorithm. In this light, the DAG is the qualitative part of a BN, whereas the conditional probability functions serve as the quantitative part. In this case, a BN was developed in order to infer the influence of local data (smaller size specimens), both visual inspection and bending tests, on the results of Em,g of structural size elements (Figure 8). scale effect
Visual grade (VIb)
Structural size (S)
Visual grade (VIB)
Em,g
without prior information on small size bending tests. Therefore, probability for the result of Em,g is updated as considered in Equation (3):
(
)
P E m, g , S VIBi =
(
) (
P VIBi E m , g , S ⋅ P E m, g , S
)
(3)
P (VIBi )
where Em,g is the global modulus of elasticity, S is the scale size of the element (imposed in this work as structural size beams), and VIBi is the visual grade of the critical section with i being considered as class I, II, III or NC depending on the prior evidence. Although not having the results of bending tests on small size specimens taken from the three analyzed beams, from the proposed BN and the database from [10], the probability of Em,g can also be updated if new information is after obtained by these tests on small size specimens extracted from the elements. In that case the updated results of Em,g would be given by Equation (4), as:
(
)
P E m, g , S VIbi , E m ,l _ j =
Em,l small size specimens data
=
beam size elements data
Figure 8: Bayesian Network for inference of Em,g
The states in the nodes corresponding to visual inspection (both of smaller scale segments and structural size) are divided by the different visual grades (I, II, III and NC), whereas the states of the node corresponding to the information of bending MOE in small segments are considered by intervals of 2000 N/mm2 up to 19000 N/mm2, with an initial interval of [0,5000[ N/mm2 so as to prevent an interval without any event. The node corresponding to the selection of structural size takes into account the possibility to infer on properties of small size specimens or on structural size elements. In this node of the BN, it is possible to consider modification coefficients to take into account the scale, thus to calibrate the mechanical properties attending to the element’s size. The child node corresponding to the Em,g of the beams is defined by discrete states with intervals of 2000 N/mm2 up to a maximum value of 20000 N/mm2. The conditional probabilities within the parent nodes are based on the database results from [10], and evidence was given regarding the visual grading of the floor beams at the critical sections. Therefore, the updated information considers the visual grading of a specific segment to be comparable to the visual grading of a small size specimen, and information about its localized MOE may be given accordingly to that premise. Taking into account the available results of visual grading, inference on Em,g of structural size beams was made upon information of the visual grading of beams critical section,
(
) (
P VIbi , E m,l _ j E m , g , S ⋅ P E m , g , S
(
P VIbi , E m ,l _ j
)
(4)
)
where VIbi is the visual grade of the small size specimen taken from the structural beam with i being considered as class I, II, III or NC depending on the prior evidence, and Em,l_j is the value of local modulus of elasticity in bending of the small size specimen with j being the interval class for that parent node depending on the prior evidence.
4 RESULTS 4.1 EXPERIMENTAL CAMPAIGN 4.1.1 Geometrical characterization Although obtaining low coefficients of variation (CoV) on the exterior cross section sizes (respectively, 3.5% and 7.3% for height and width), due to wane a significant CoV was found for the cross section area and inertia (respectively, 11.9% and 20.1%), denoting a considerable geometric variation found along the beams’ length. An example of the cross sections measured along the length of the timber elements is presented in Figure 9 for beam B1. 15 cm
55 cm
95 cm
135 cm
175 cm
215 cm
255 cm
295 cm
335 cm
375 cm
415 cm
455 cm
10 cm
Figure 9: Cross section measurements for beam B1
4.1.2 Visual inspection The most common defects found were the existence of knots and misalignment of grain direction. Along the length of the beams several segments presented signs of decay with the ends of the beams being the more affected. Also wane was found, more due to the initial sawing process, as the elements had still their round shape, rather than to loss of cross section integrity during the lifetime of the structure. Therefore, wane was not considered as a limiting parameter for visual grading in this study, but instead only the residual cross section without wane was considered. Furthermore, visual inspection also evidenced a large variation of defect concentration on different segments, being B1 the lower graded beam, while B3 was the higher graded (Figure 10). 9%
18%
36%
27%
17%
15 40
40
40
40
40
40
40
40
40
40
40
29
40
40
31
3630 N/mm² 4120 N/mm² 2800 N/mm² 5200 N/mm² 5220 N/mm²
a) 15 40
40
40
40
40
40
40
40
40
50% 4700 N/mm² 3670 N/mm² 3990 N/mm²
33%
37%
73%
I
a)
II
III
b)
5990 N/mm²
NC
5960 N/mm²
c)
b)
Figure 10: Percentage of segments with a given visual grade in beams: a) B1; b) B2; c) B3
4.1.3 Bending tests The Em,g values obtained in the bending tests were calculated through Equation (2) considering the dimensions of the weakest critical section located within the measurement span. The dimensions of the cross section were decreased considering the mean value of decay depth obtained in the drilling resistance tests. The results of the bending tests are presented in Figure 11, evidencing also the gauge length and visual grading by segments. The influence of the decayed sections and round cross section geometry was found to be more significant in the lower span tests, evidencing lower modulus of elasticity values. Between spans with similar lengths, the values of Em,g was similar between the timber beams. Nevertheless, the values of Em,g also evidenced a decrease for segments with lower visual grading (III and NC) and an increase for segments with higher visual grades (I and II). In the larger span tests, and accounting the information presented in Figure 10, it visible that the beam with higher percentage of class I segments provided a higher Em,g (beam B3), whereas the beam with higher percentage of NC segments provided lower Em,g (beam B1).
15 40
40
40
40
40
40
22
7820 N/mm²
c) label:
class I
class II
class III
class NC
Figure 11: Visual grading by segments (cm) and Em,g (N/mm2) results (with indication of gauge length) for beams: a) B1; b) B2; c) B3
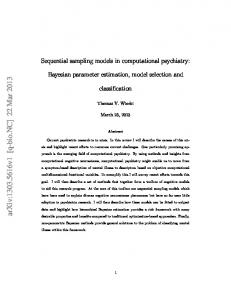
4.2 PREDICTION OF BENDING STIFFNESS The results of the predictive models by random sampling evidenced a r2 of 0.36, being increased to 0.59 when considering only the lower span bending tests (Figure 12). Whereas, the BN obtained a r2 of 0.61, being increased to 0.68 for lower span bending tests (Figure 13). However, in both cases a large mean percentage error was obtained, respectively of 152% and 174% for the random sampling models and the BN, both overestimating Em,g. The mean ratio between predicted and experimental values was similar for both prediction methods, being of 2.5 and 2.7 for random sampling models and for BN, respectively. To attend to this overestimation and to the scale effect, it is possible to consider reduction coefficients in each of the proposed methods. In the case of the random sampling method, the coefficients of reduction could be
17500
Em,g_pred = 0.840⋅ Em,g_exp + 8525 r² = 0.61
15000
Em,g predicted (N/mm 2 )
implemented in the attribution of a reduced local modulus of elasticity, whereas for the BN method the reduction factors could be considered within the structural size node (S). With these coefficients of reduction, the mean percentage error would be minimized, however the r2 would not be altered. In this work, these coefficients of reduction were considered since the prior database corresponded to elements of different scale sizes (sawn beams and sawn boards with rectangular cross section). In Figures 12 and 13, the results from the prediction models with consideration of reduction coefficients are also presented for the smaller span lengths, evidencing that the results have a lower percentage error between experimental and predicted values. A mean percentage error of 21.3% is found for the random sampling model (with reduction coefficient, α = 2.5), similar to the obtained in [13], and a mean percentage error of 19.2% is found for the BN model (α = 2.7).
12500 10000 7500 5000 2500 0 0
Em,g
Em,g_pred = 1.136 ⋅ Em,g_exp + 6183 r² = 0.36
12500 10000 7500 5000
7500
10000
experimental (N/mm 2 )
Em,g_pred = 0.784 ⋅ Em,g_exp + 8857 r² = 0.68
15000
Em,g predicted (N/mm 2 )
Em,g predicted (N/mm 2 )
15000
5000
a) 17500
17500
2500
12500 10000 7500 5000
α = 2.7 2500
Em,g_pred = 0.291 ⋅ Em,g_exp + 3280 r² = 0.68
2500
0 0
0 0
2500
5000
7500
10000
2500
Em,g experimental (N/mm 2 )
Em,g predicted (N/mm 2 )
10000
Figure 13: Correlation of the experimental results with the BN model results: a) all spans; b) smaller spans with reduction coefficient
Em,g_pred = 1.392 ⋅ Em,g_exp + 5847 r² = 0.59
15000
7500
b)
a) 17500
5000
Em,g experimental (N/mm 2 )
5 CONCLUSIONS
12500 10000 7500 5000
α = 2.5 2500
Em,g_pred = 0.557⋅ Em,g_exp + 2339 r² = 0.59
0 0
2500 Em,g
5000
7500
10000
experimental (N/mm 2 )
b) Figure 12: Correlation of the experimental results with the random sampling prediction model results: a) all spans; b) smaller spans with reduction coefficient
Random sampling of data and use of Bayesian Networks were considered, in a probabilistic framework, to predict the global stiffness of three old chestnut beams, using information from visual grading and smaller size specimens taken from similar beams. Although evidencing moderate correlations, also high mean percentage errors overestimating Em,g were found. The significant difference between predicted and experimental values derive, among other, from the large variability of cross section geometry (due to wane), the presence of decay and the increased probability of finding defects for members with higher volumes (scale effect). As the prior database of the prediction models corresponded to different size scales of the elements, also reduction coefficients of approximately 2.5 were considered for the prediction models, resulting in smaller mean percentage
errors between experimental and predicted values. These coefficients correspond to the scale effect relation between existing chestnut timber elements with round cross section and sawn beams of smaller dimensions with rectangular cross section. Finally, for the random sampling model a coefficient of determination of r2 = 0.59 and percentage error of 21.3% were obtained, whereas for the BN model a coefficient of determination of r2 = 0.68 and percentage error of 19.2% were obtained.
ACKNOWLEDGEMENT The financial support of Portuguese Science Foundation (Fundação para a Ciência e a Tecnologia, FCT), through grant SFRH/BD/62326/2009 is gratefully acknowledged. The present work is part of a research project supported by program Quadro de Referência Estratégico Nacional (QREN), project number 21635, from the Agência de Inovação (ADI).
REFERENCES [1] H. Cruz, D. Yeomans, E. Tsakanika, N. Macchioni, A. Jorissen, M. Touza, M. Mannucci and P. B. Lourenço. Guidelines for the on-site assessment of historic timber structures. Int. J. Archit. Herit., doi: 10.1080/15583058.2013.774070, 2013. [2] B. Faggiano, M. R. Grippa, A. Marzo, and F. Mazzolani. Combined non-destructive and destructive tests for the mechanical characterization of old structural timber elements. In: 3rd International Conference on Advances in Experimental Structural Engineering, 2009. [3] P. B. Lourenço, H. S. Sousa, R. D. Brites and L. C. Neves. In situ measured cross section geometry of old timber structures and its influence on structural safety. Mater. Struct., 46(7):193-1208, 2013. [4] G. Fink and J. Köhler. Multiscale variability of stiffness properties of timber boards. In: 11th International Conference on Applications of Statistics and Probability in Civil Engineering, 1369-1376, 2011. [5] J. S. Machado and P. Palma. Non-destructive evaluation of the bending behaviour of in-service pine timber structural elements. Mater. Struct., 44(5):901910, 2011. [6] B. Faggiano, M. R. Grippa, A. Marzo, and F. Mazzolani. Structural grading of old chestnut elements by compression and bending tests. In: 11th World Conference on Timber Engineering, 20-24, 2010. [7] J. Köhler, J. D. Sørensen and M. H. Faber. Probabilistic modelling of timber structures. Struct. Saf., 29(4):255-267, 2007. [8] Joint Committee on Structural Safety. Probabilistic Model Code, Part 1: Basis of Design. Probabilistic Model Code, JCSS, 2000.
[9] C. H. Wang and R. H. Leicester. A probabilistic procedure for design of timber above-ground under attack of decay fungi. In: Australasian Structural Engineering Conference 2008: Engaging with Structural Engineering, 2008. [10] H. S. Sousa, J. M. Branco and P. B. Lourenço. Use of bending tests and visual inspection for multi-scale experimental evaluation of chestnut timber beams stiffness. J. Civ. Eng. Manag., (in press). [11] EN 408:2010 Timber structures - Structural timber and glued laminated timber - Determination of some physical and mechanical properties. CEN, 2010. [12] UNI 11119:2004 Cultural Heritage - Wooden artifacts - Load-bearing structures - On site inspections for the diagnosis of timber members. UNI Milano, 2004. [13] H. S. Sousa, J. M. Branco and P. B. Lourenço. Prediction of global bending stiffness of timber beams by local sampling data and visual inspection. (manuscript submitted). [14] R. Görlacher R. Non destructive testing of wood: an in-situ method for determination of density. Holz as Roh- und Werkstoff, 45:273-278, 1987. [15] F. Rinn and F. Schweingruber. Resistograph and x-ray density charts of wood comparative evaluation of drill resistance profiles and x-ray density charts of different wood species. Int. J. Biol. Chem. Phys. Technol. Wood., 50:303-311, 1996. [16] H. S. Sousa, J. M. Branco and P. B. Lourenço. Characterization of cross-sections from old chestnut beams weakened by decay. Int. J. Archit. Herit., 8:436-451, 2014.