sharing a third generation EDGE (Enhanced Data Rates for GSM Evolution) cellular wireless data channel. The number of interactive data users that can be.
User-Perceived Performance of Web-Browsing and Interactive Data Applications in TDMA Packet Wireless Networks
N. K. Shankaranarayanan, Zhimei Jiang, Partho Mishra∗ AT&T Labs -- Research, New Jersey, USA.
Key words:
Web, interactive data, Equivalent Circuit Rate, TCP, EDGE, shared channel
Abstract:
Using analysis and simulation, we study the performance of Web-browsing and interactive data applications as perceived by the users of a shared packet access network. To characterise the user experience, we use end-to-end page delays and introduce a robust and useful measure called Equivalent Circuit Rate (ECR). The ECR for a user of a shared packet access network is the dedicated access circuit bit rate required to achieve the same user experience. Our analysis uses a simple closed queueing network model and the theoretical results agree well with simulations of TCP-based Web browsing workloads sharing a third generation EDGE (Enhanced Data Rates for GSM Evolution) cellular wireless data channel. The number of interactive data users that can be supported with acceptable performance is about 80% to 90% of the ratio of the shared channel rate to the average user rate. ECR is closely approximated by effective channel rate*(1-utilization).
1.
INTRODUCTION
This paper focuses on the performance of shared cellular packet access networks from a user perspective. This is critical since the user experience does not always correlate in an obvious manner with conventional network metrics for the diverse data applications that are expected. Our work is in the context of a third generation EDGE (Enhanced Data Rates for GSM Evolution) TDMA system [1], but the work is applicable to other packet ∗
Partho Mishra is now with Gigabit Wireless Inc., California, USA.
73 G. Stuber and B. Jabbari (eds.), Multiaccess, Mobility and Teletraffic for Wireless Communications: Volume 5, pp. 73-84. 2000 Kluwer Academic Publishers. Printed in the Netherlands.
74
N. K. Shankaranarayanan, Zhimei Jiang, Partho Mishra
access scenarios. We present a modeling approach that addresses the following questions: (1) How many data users can be supported by a shared access network? (2) How should we characterise the user-perceived performance? (3) How does shared packet access compare to dedicated access? The first question is critical for network dimensioning and planning. The second question has to be addressed to give a meaningful answer to the first one. The third question comes up for a couple of reasons. Consumers as well as network/service planners can readily relate to the user experience for dedicated rates ranging from 14.4 kbps to 56 kbps (telephone modem) to 128 kbps (ISDN) rates. This is of particular relevance to cellular wireless networks since the user experience is expected to often be in this range. A second reason is that there is a range of design choices in wireless networks from fully shared to fully dedicated access links. It is therefore useful to compare the shared and dedicated access situation from a user perspective. The answers to the above questions obviously depend on the nature of the user workload (traffic), and various user performance criteria. Using simulations, we have attempted to provide a quantitative answer to the above questions for TCP-based interactive Web-browsing, which is the dominant application on the Internet [2]. We also have a simple analytical model for a shared packet channel that applies to Web traffic, as well as any other such interactive application that can be modeled as ON/OFF traffic with feedback. For Web browsing, the performance metric directly influencing user perception is the Web page delay, i.e. the time taken to download an entire Web page, as opposed to per-packet delays or the instantaneous throughput. Besides working with delay values in seconds, we introduce a measure for a shared packet access network, termed the Equivalent Circuit Rate (ECR), which specifies the rate of a dedicated connection that is equivalent to the shared system from a user perspective. We will further develop this notion in later sections, and show it is a robust and useful measure. The rest of this paper is organised as follows. In Section 2, we discuss our network and traffic assumptions. Section 3 introduces the analytical model and results, and Section 4 presents the simulation results. Section 5 concludes the paper.
2.
WIRELESS DATA NETWORK MODEL
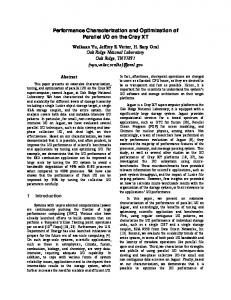
Figure 1 depicts a general wireless data network architecture, where end users connect to servers in the public Internet via base stations and routers. In our work, we focus only on the access network, which is the segment between the mobile station and the access router. We will assume that the user-perceived performance is constrained only by the downlink capacity of the shared access network, and that the server and other (Internet, backbone,
User-Perceived Performance of Web and Interactive Data
75
etc.) network components are ideal except for finite propagation delay. The users in our model are active users who generate bursty traffic according to some statistics. In our work, the number of (active) users is held constant. Therefore, our results should be used for peak usage (busy-hour) planning. It can also be used as a basis for admission control policies. In the real world, typically 5% to 40% of packet wireless subscribers are likely to be simultaneously active. We introduce a new measure, which is defined as follows: The Equivalent Circuit Rate (ECR) for a user of a shared packet access network is the circuit rate required by an identical user with a dedicated connection in order to achieve the same user-perceived performance. Mobile Station BS
Base Station
Shared Access Network Access Router
Access Router
IP Network Router Gateway Router
Mobile Station with dedicated connection in place of shared access network (performance reference)
Internet Backbone Server
Figure 1. General shared packet cellular wireless network. For a performance reference, we also show a user with a dedicated connection replacing the shared network.
A reference user is shown in Figure 1 with a dedicated circuit replacing the shared network under study. The user-perceived performance is characterised by some suitable statistic of a metric (e.g. page delay) that describes user performance. In our analytical work, we consider only the mean page delay. In our simulation work, we study mean and percentile statistics for the page delays, as well as mean page transfer rates. Equivalent Circuit Rate is a measure that characterises the application level user experience such as the end-to-end page delay, rather than a network performance measure. This is in contrast to the notions of equivalent capacity [3] and effective bandwidth [4]; these are measures that characterise a traffic source and refer to “the amount of bandwidth required to achieve a desired grade of service, e.g. buffer overflow probability, given the offered aggregate bit rate” [3]. They are “intimately connected with admission control, and the associated service requirements” [4]. While the notions of equivalent capacity or effective bandwidth can be used for admission control to maintain a target for buffer overflow probability, they do not address the questions in section 1 related to user experience.
76
3.
N. K. Shankaranarayanan, Zhimei Jiang, Partho Mishra
ANALYTICAL MODEL
We have developed a simple queueing network model that applies to any packet access network that is shared by interactive users with ON/OFF traffic (see section 4.2 for details of ON/OFF traffic). We give a brief summary here; the detailed model will be published elsewhere for lack of space. Consider a finite population of M interactive users with ON/OFF traffic, who are sharing an access network queue. Let the OFF times have a distribution whose mean is 1/λ, and let the service times (which is a component of the ON times) have a distribution whose mean is 1/µ, i.e. µ is the service rate of the access router. Let there be a mean latency E[D] (e.g. protocol overhead and backbone propagation delays). The system can be modeled with the closed queueing network model shown in Fig. 2; this is the well-studied “machine repairman” or “mainframe/terminal” model [5],[6] with an extra latency block. Average OFF time = 1/λ λ
M users
. .
λ E[D]
µ
Average service time = 1/µ
Fig. 2. Queueing model for M interactive ON/OFF sources sharing an access network.
We assume a processor-sharing queue, and our results hold for any general service time distribution as long as the think times have an exponential distribution [6],[7]. These results also hold if the think times and service times can be described by rational distributions [5]. Our work is different from related previous work [7],[8] in that we have focused on the user-perceived performance metrics. This has led us to the new measure of Equivalent Circuit Rate, for which we have a closed-form solution. We can describe end-to-end user-perceived performance with simple parameters that depend only on mean statistics. We define an offered load per user, ρ as 1µ (1) ρ= 1 λ + E[ D ] and also define an intended offered load per user, a as a=
1µ ρ = 1 + ρ 1 µ + 1 λ + E[ D ]
(2)
User-Perceived Performance of Web and Interactive Data
77
Both ρ and a describe the intrinsic traffic source characteristics and do not change with network load. The average utilization of the server or network is given by U = 1 − p0 (3) where −1
M M! p0 = ∑ ρ n (4) n = 0 ( M − n)! For a single user (M = 1), U = a. Thus, we can get the intended offered load per user simply by measuring the utilization for a single-user case. The average response time (page delay) is given by E[ R ] =
M 1 1M 1 − = E[ D] + − µU λ µU ρ
(5)
For a given offered load, as the number of users M increases, the response time starts increasing rapidly beyond a threshold. This threshold, called the “saturation point” in [5] is given by M* =
1 µ = a µa
(6)
M* is also the ratio of the network rate to the intended average user rate. The average response time E[R] increases if the number of users increases or if the service rate decreases. As discussed earlier, we use the average delay to define ECR since it is a suitable measure that relates directly to the user experience. The Equivalent Circuit Rate can be written as M 1 (7) ECR = µ ECR = µ − U ρ The “rated” number of users that can be supported is about 70% to 100% of M* depending on a. This range corresponds to a downlink channel utilization of 70% to 85%, and the ECR is 15% to 30% of the channel rate. The normalized ECR µ ECR / µ is closely approximated by 1-U for small values of ρ. This means that, for a finite source population we can find a tight lower bound for the Equivalent Circuit Rate by just looking at the utilization level. Thus, if a 3 Mbps or a 300 kbps packet wireless channel were being utilised at 67%, the users would feel as if they had a 1 Mbps or 100 kbps dedicated channel respectively. This result is very general, and independent of the statistics of the Web pages or the number of users, for a processor-sharing system with exponential OFF times.
78
N. K. Shankaranarayanan, Zhimei Jiang, Partho Mishra
4.
SIMULATION
4.1
Shared Packet Wireless Channel
In our simulation, we used a wireless channel model mimicking the EDGE/GPRS (Enhanced Data Rates for GSM Evolution/General Packet Radio System) standard, which is a third-generation cellular TDMA system with a packet network based on IP [1]. IP packets are divided into smaller radio-level blocks, and each block is transmitted using time slots in a 20 ms frame. There is a link-level ARQ mechanism to retransmit errored blocks. EDGE uses a 9-mode adaptive modulation scheme to combat the variations in radio channel conditions. The bit rates vary from 8.5 kbps per slot (68 kbps aggregate for 8 slots) to 59.2 kbps per slot (473.6 kbps agg.) In our work, we will study bit rates from 22 kbps per slot (176 kbps agg.) to 55 kbps per slot (440 kbps agg.). SERVER
TCP/IP packets
Mobile Stations
User queues
1
1 Link Level 8 slots in 20 ms frame
2 . . . N
. . .
. .
2 . . . N
BASE STATION
Figure 3. Simulation model of TCP-based Web browsing application over EDGE.
Our simulation model is shown in Figure 3. The simulation program was written using Maisie/Parsec and C. The TCP programs used in the simulator were ported directly from FreeBSD v2.8, which uses a v4.4 BSD implementation. Mechanisms such as TCP slow start, congestion control, and retransmissions were included. Web pages are segmented by TCP and sent as IP packets to be buffered in a router with per-user queueing. The queue is assumed to have sufficiently large buffers to accommodate the sum of the TCP window sizes for the active flows. Consequently, there are no packet losses due to congestion in our simulations, but there can be linklevel transmission losses. Time slots are assigned to different queues according to a round-robin serving policy. Each user queue can use multiple slots if available. In every time slot, a certain amount of bytes are removed from the corresponding packet and transmitted, and the number of bytes depends on the transmission mode being used. In general, the transmission mode can vary across slots and users in EDGE. In this work, however, we fix the transmission mode for a user during a simulation. If there is a
User-Perceived Performance of Web and Interactive Data
79
transmission error (based on an error-rate parameter), we assume that the bytes were lost and retransmit those bytes. Although not entirely accurate, this model is reasonable for determining the total page delay in a system with selective link-level retransmission of errored blocks. If there are too many retransmissions, TCP-level retransmissions are triggered. We do include a fixed backbone propagation delay (latency) that contributes to the round-trip time, thus affecting TCP congestion control and TCP-level retransmission in the simulation. Simulation parameters are listed in Table I. Table I. Simulation parameters for network and traffic model.
Access network bit rate
176 to 440 kbps
Backbone propagation delay (rtt)
2 to 400 ms
TCP window size / MSS
64 KB / 512 B
Web page size distribution
Trun. log-normal in bytes (µ=9.5, σ=1.8)
f ( x) = Median/Mean Web page size OFF time distribution
1
xσ 2π
e− (ln x − µ )
2
/ 2σ 2
100 B min, 100 kB max 10 kB / 20 kB Trun. Pareto (k=2s, α=1)
f ( x) = α k α / xα +1 , x ≥ k Median/ Mean OFF time Avg. workload for single user
4.2
2 s min, 10 min max 4 s / 12 s 9 to 13 kbps
Web Workload Simulation Model
The users in our simulation use Web-based applications. The user traffic can be modeled as an ON/OFF process in which a user alternates between ON (busy) and OFF (idle) states [9]. This is depicted in Fig. 4. A user enters the ON state when he/she clicks on a URL. The duration of the ON period depends on Web page size, network conditions and protocol interactions. In our network model, the Web server and backbone network are ideal except for a propagation delay. After all the files have been fetched, the user goes into the OFF state. We assume the use of HTTP v1.1 where one TCP connection is used for all the HTTP requests for a page. From a modeling perspective, all the files in a page can be lumped into one composite file, which is transferred from the server to the client. Our workload model is based on [9]. We numerically generated deviates and observed that a lognormal distribution is a good descriptor for the page sizes, although
80
N. K. Shankaranarayanan, Zhimei Jiang, Partho Mishra
individual file sizes require two distributions to cover the wide range. We adjusted the think-time parameters slightly to match empirical/measured estimates of user workload for high-speed as well as moderate-speed access rates (see Table I). This model results in a per-user average workload ranging from 9 to 13 kbps depending on transmission mode and propagation delay. This represents a Web user with a laptop & wireless modem. Other applications such as stock quotes and e-mail on a PDA or smartphone are expected to generate lower average user rates, around 4 kbps. ON
ON
OFF
ON
OFF
ON
OFF
time
= HTTP request and TCP connection establishment = HTTP request for additional files from same server
Fig. 4. ON/OFF model for Web user workload assuming HTTP v1.1
4.3
Simulation Results
Deterministic TCP/HTTP transfer delays for a dedicated link can be easily computed. Thus, with the Web page statistics, we could compute a priori statistics for a single-user with no queueing delay. (Multiple users would of course require a simulation). This agreed very well with simulation results. The average service time 1/µ is simply the mean page delay for a single-user case for zero latency. Thus, the per-user intended offered load a can be calculated a priori; alternately, a more general and powerful method of determining a in a real or simulated system is to measure the utilization for a single-user scenario. For finite propagation delays, latency is estimated by subtracting the mean service time from the mean page delay. Some examples of a priori values are listed in Table II. Figure 5a shows the complementary CDF of simulated Web page delays for various number of users for 440 kbps aggregate channel rate (55 kbps per slot) and 200 ms backbone round trip (rtt) propagation delay. The delay values span a wide range even for a single user since the Web pages span a wide range. The web page sizes have a truncated heavy-tailed distribution and the web page delays depict a similar behaviour. The curve marked 1c is a CDF of a set of a priori computed delays, and these are only slightly smaller than the simulation results. This is due to quantization effects of the TDMA slot structure, which was not used in the a priori computation. As the number of users increases, the delays increase due to sharing. One can compare the high delays from large pages with those due to resource sharing. Figure 5b shows the increase in various page delay statistics as a function of the number of users. The mean is higher than the median, which is typical of heavy-tailed distributions.
User-Perceived Performance of Web and Interactive Data
81
Table II. A priori computation of mean page delay and latency for Web traffic model.
Channel rate Round-trip Mean page Estimate of (all 8 slots) prop. delay delay (s) latency E[D] 440 kbps 0 ms 0 0.389 s (=1/µ) 440 kbps 200 ms 1.075 s 0.686 s 176 kbps 0 ms 0 0.92 s (=1/µ) 176 kbps 200 ms 1.556 s 0.636 s
a 0.0314 0.0297 0.0712 0.0678
0
10
20
mean
18
90th percentile median
Web page delay (s)
16 −1
Complementary CDF
10
48
36 −2
10
24
1 (c)
1
12 10 8 6 4 2
12
0
−3
10
10th percentile
14
−1
10
0
1
10
10 Page Delay (sec)
2
10
1
4
8 12 16 20 24 28 32 36 40 44 48 Number of active Web users
Figure 5. (a) Complementary CDF of Web page delays for simulation with 1, 12, 24, 36, and 48 users. Curve 1c is a computed result based on a priori parameters. (b) Web page delay statistics v. no. of users. Channel rate is 440 kbps. Backbone rtt propagation delay is 200 ms.
We consider two channel rates, 176 kbps and 440 kbps. They have different values of per-user intended offered load. Figure 6 shows simulation and theory results as a function of the number of active Web users for 200 ms latency. Figure 6a shows mean page delay, which increases faster beyond the saturation points of 14 and 33 for 176 kbps and 440 kbps respectively. Agreement with theory is excellent. (This is true for other latency values too.) Far beyond the saturation point, the mean delay increases by one service time unit if one user is added to the system. Well below saturation, the user experience is stable and changes minimally as additional users are added. Thus, to provide a good user experience, we would want to operate the network at or below saturation, before the delay curve starts rising rapidly. To compute the ECR, we ran separate single-user simulations for a wide range of bit rates. From this, we got a table of mean delay etc. v. bit rate. Using a table lookup, the delay (or other) experience in the shared system was matched to an ECR value. Unless specified otherwise, we used the mean delay characteristic to compute ECR.
82
N. K. Shankaranarayanan, Zhimei Jiang, Partho Mishra 16
500
440 kbps
ECR theory - mean delay
ECR & transfer rate (kbps)
Mean page delay (s)
theory 176 kbps
12
theory
8
4
ECR - mean delay
400
ECR - 90%tile delay ECR 440 kbps
300
200
Average page transfer rate 176 kbps 440 kbps
ECR 176 kbps
100
0
0 0
10
20
30
40
Number of active Web users
50
0
10
20
30
40
Number of active Web users
50
Figure 6. Simulation and theory results for 440 kbps and 176 kbps channel rates for 200 ms rtt. a) Mean page delay v. users. (b) Various ECR measures (based on matching mean page delay and based on matching 90th percentile page delays) and mean page transfer rate v. users.
Figure 6b shows ECR v. users. There are three ECR curves for each rate: ECR based on matching mean page delay - simulation as well as theory and ECR based on matching 90th percentile page delays. There is almost no difference in the ECR result calculated from the two different measures. (We also found that the ECR curves have minimal changes for different latency values.) Thus, ECR is a robust measure that captures the delay experience in an interactive data session. Agreement with theory is also good. As the number of users increases, the ECR drops linearly for lower loads and then asymptotically approaches a value of 1/M beyond saturation. ECR represents the dynamic capacity available to a connection. With a fair queueing policy, each user is assured 1/Mth of the channel capacity, and this is the ECR at very high loads. For lower levels of utilization, the normalized ECR is much higher than 1/M, representing the multiplexing gain for bursty users. ECR is something that network planners and users can relate to since it translates a statistical problem to the familiar concept of a modem rate. Figure 6b also shows the average page transfer rate, which is a mean of all the individual page transfer rates (ratios of page size to page transfer delay). This is much lower than ECR due to the latency overhead from TCP. Typically, many of the pages are too small for the TCP window size to grow to take advantage of the available capacity during the Slow Start phase. Although the page transfer rate is an end-to-end measure, it changes as the backbone latency changes1. In addition, when we computed ECR by matching the mean and percentile page transfer rates, we got different answers, unlike the case above using page delays. Thus, it is preferable to use the ECR measure based on page delays. 1
The ratio of the mean page size to the mean page delay (“average throughput”) also varies with latency. Interestingly, a suitably-modified variation of this measure, the ratio of mean(page size + byte overhead) to mean(page delay - latency) is the same as ECR.
User-Perceived Performance of Web and Interactive Data
83
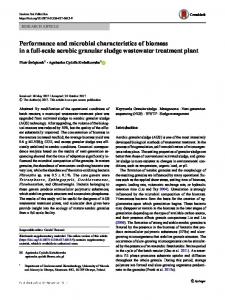
We picked five representative EDGE modes with different transmission rates and estimated block error rates (BLER): 176 kbps (0% and 40% BLER), 352 kbps (0% BLER), and 440 kbps (0% and 20% BLER). Figure 7 shows the ECR v. users and utilization for the five cases. The ECR v. utilization curves illustrate that ECR ~ effective rate*(1- utilization). ECR starts at the (effective) channel rate, and decreases almost linearly with utilization. Since the link-level errors are handled promptly by link ARQ, their effect is to simply decrease the aggregate capacity. We can conclude that at one of the high modes (55 kbps per slot, 20% BLER), the EDGE system can support 24 Web users with an average workload of about 12 kbps/user, and give them an equivalent circuit rate of about 100 kbps. This suggests that the performance compares well with the ISDN experience. Note that our user workload rate of 12 kbps may be somewhat high for wireless scenarios, e.g. the user model in [1] has a 3.3 kbps user rate. Thus, it is likely that more users can be supported if the user rates are indeed lower. On the other hand, the number of users will be lower due to channel effects such as interference and fading, which we have not considered. 500
500 440 kbps
440 kbps
440 kbps, 20% BLER
400
440 kbps, 20% BLER
400
352 kbps
352 kbps
300
ECR (kbps)
ECR (kbps)
176 kbps 176 kbps, 40% BLER
200
100
176 kbps
300
176 kbps, 40% BLER
200
100
0
0 0
10
20
30
40
Number of active Web users
50
0
20
40
60
80
100
Average channel utilization (%)
Figure 7. Equivalent circuit rate v. (a) users and (b) utilization, for various EDGE modes.
5.
CONCLUSION
In this paper, we have studied the user-perceived performance of a TDMA packet access network for Web-browsing and interactive data applications. We have proposed a simple analytical model based on a closed queueing network with a finite population of interactive data users whose traffic can be modeled as ON/OFF traffic with feedback. The theoretical results are consistent with TCP-based Web traffic simulations for an EDGE system using realistic workload models. The shared network is well characterised by simple parameters that only depend on mean statistics for a broad range of scenarios. The number of users that can be supported is about
84
N. K. Shankaranarayanan, Zhimei Jiang, Partho Mishra
80% to 90% of the ratio of the network rate to the intended (single-userscenario) average user rate. We have proposed a new measure for a shared channel, the Equivalent Circuit Rate (ECR), which is defined as the circuit rate required by a user with a dedicated connection in order to achieve an equivalent user experience. An interesting and useful result is that ECR is well approximated by channel rate*(1-utilization). The ECR measure is robust; it has minimal changes whether one considers mean page delays or 90th percentile page delays, or if there are variations in backbone propagation delay. In addition, service planners and users can easily relate to ECR.
ACKNOWLEDGEMENT This work has benefited greatly from valuable discussions with Paul Henry, Chuck Kalmanek, and Kin Leung.
REFERENCES [1]
[2] [3]
[4]
[5] [6] [7]
[8]
[9]
A. Furuskar, S. Amzur, F. Muller, and H. Olofsson, “EDGE, Enhanced Data Rates for GSM and TDMA/136 Evolution,” IEEE Personal Communications, vol 6, no 3, June 1999, pp 56-66. K. Claffy, et al, “The nature of the beast: recent traffic measurement from an Internet backbone,” Inet ’98. (http://www.caida.org/Papers/Inet98/index.html ) R. Guerin, H. Ahmadi, and M. Naghshineh, “Equivalent capacity and its application to bandwidth allocation in high-speed networks,” IEEE J. on Selected Areas in Communincations, vol. 9, no. 7, pp. 968-981, 1991. A. I. Elwalid and D. Mitra, “Effective bandwidth of general Markovian traffic sources and admission control of high speed networks,” IEEE/ACM Transactions on Networking, vol. 1, no. 3, 1993. L. Kleinrock, “Queueing Systems,” John Wiley & Sons, vol. 2. 1975. K. Trivedi, “Probability and Statistics with Reliability, Queueing, and Computer Science Applications,” Prentice Hall, 1988. H-P Schwefel and L. Lipsky, “Analytic models of traffic in telecommunication systems, based on multiple ON-OFF sources with self-similar behavior II. N-burst models and their performance,” Proc. of 16th Intl. Teletraffic Congress, ITC-16, Edinburgh, UK, June 1999. D. P. Heyman, T. V. Lakshman, and A. L. Neidhardt, “A new Method for Analyzing feedback-based protocols with applications to engineering web traffic over the Internet,” Proc. 1997 ACM SIGMETRICS Intl. Conf. On Measurement and Modeling of Computer Systems, pp. 24-38, 1997. P. Barford and M. Crovella, “Generating representative web workloads for network and server performance evaluation,” Proc. 1998 ACM SIGMETRICS Intl. Conf. On Measurement and Modeling of Computer Systems, pp. 151-160, July 1998. See also: “A performance evaluation of hyper text transfer protocols,” Boston University Technical Report BU-TR-98-016, Oct 27, 1998. ( http://www.cs.bu.edu/techreports )