Using Ambiguity Measure Feature Selection Algorithm for Support Vector Machine Classifier Saket S.R. Mengle
Nazli Goharian
Information Retrieval Lab Computer Science Department Illinois Institute of Technology Chicago, Illinois, U.S.A
Information Retrieval Lab Computer Science Department Illinois Institute of Technology Chicago, Illinois, U.S.A
[email protected]
[email protected]
ABSTRACT With the ever-increasing number of documents on the web, digital libraries, news sources, etc., the need of a text classifier that can classify massive amount of data is becoming more critical and difficult. The major problem in text classification is the high dimensionality of feature space. The Support Vector Machine (SVM) classifier is shown to perform consistently better than other text classification algorithms. However, the time taken for training a SVM model is more than other algorithms. We explore the use of the Ambiguity Measure (AM) feature selection method that uses only the most unambiguous keywords to predict the category of a document. Our analysis shows that AM reduces the training time by more than 50% than the scenario when no feature selection is used, while maintaining the accuracy of the text classifier equivalent to or better than using the whole feature set. We empirically show the effectiveness of our approach in outperforming seven different feature selection methods using two standard benchmark datasets.
Categories and Subject Descriptors H.3.3 [Information Systems and Retrieval]: Information filtering, Information Search and Retrieval-search process
General Terms Algorithms, Performance, Experimentation
Keywords Feature selection, Text classification, SVM
1. INTRODUCTION Text classification involves scanning through the text documents, and assigning categories to documents to reflect their content. A supervised learning algorithm induces decision rules that are used to categorize documents to different categories by learning from a set of training examples. One of the problems in text classification is high dimensionality of the feature space. Some features are
Permission to make digital or hard copies of all or part of this work for personal or classroom use is granted without fee provided that copies are not made or distributed for profit or commercial advantage and that copies bear this notice and the full citation on the first page. To copy otherwise, or republish, to post on servers or to redistribute to lists, requires prior specific permission and/or a fee. SAC’08, March 16-20, 2008, Fortaleza, Ceará, Brazil. Copyright 2008 ACM 978-1-59593-753-7/08/0003…$5.00.
commonly used terms, not specific to any category. These features may hurt the accuracy of the classifier. Moreover, the time required for induction increases as the number of features increases. That is, irrelevant features lead to an increase in training time. Feature selection methods are used to achieve two objectives: to reduce the size of the feature set to optimize the classification efficiency; and to reduce noise found in the data to optimize the classification effectiveness [11]. Feature selection methods are used as a preprocessing step in the learning process. The selected features from the training set are then used to classify new incoming documents. Among the well-known feature selection methods are information gain, expected cross entropy, the weight of evidence of text, odds ratio, term frequency, mutual information and CHI. The Ambiguity Measure (AM) feature selection method is shown to perform better than the state of art feature selection algorithms on statistical classifiers [9]. The Ambiguity measure algorithm selects the most unambiguous features, where unambiguous features are those features whose presence in a document indicate a high degree of confidence that the document belongs to one specific category. One of the widely used text classification algorithms is Support Vector Machines (SVM) [3][4][5][16]. Prior work [5] indicates that SVM performs consistently better than Naïve Bayes, kNN, C4.5 and Rocchio text classifiers. However, one of the limitations of SVM is its time complexity. [16] shows that SVM has a higher time complexity for training a model than other text classification algorithms. To overcome this limitation of SVM, feature selection methods are used as a preprocessing step before training SVM [12][13][14]. Many well-known feature selection algorithms are used on SVM to improve the accuracy and efficiency of SVM. We explore the effects of the AM feature selection method when applied on SVM and evaluate its performance in comparison to the published state of the art feature selection algorithms on SVM. We use the AM feature selection method as a pre-processing step for the Support Vector Machine classifier. The features whose AM are below a given threshold, i.e., more ambiguous terms, are purged while the features whose AM values are above a given threshold are used for the SVM learning phase. We compare AM with the other feature selection algorithms on two different standard benchmark datasets and show that AM performs statistically significantly better than seven published state of the art feature selection methods, reported in [13][14], with 99% confidence. We also empherically show that we can reduce the
training time by more than 50% than the scenario when no feature selection is used, while maintaining the accuracy of the classifier.
2. PRIOR WORK To show the effectiveness of our feature selection algorithm, we compare our approach with the existing feature selection methods listed in Table 1. The description of these feature selection methods is given in [2][13][15][17], thus we forgo their mathematical justification and provide a brief explanation on the differences. The feature selection methods like odds ratio, information gain and CHI use the knowledge about the presence of the terms in the relevant categories ( ci ) as well as in the non-relevant categories ( ci ). In our approach, AM feature selection method only uses the knowledge about the presence of the terms in the relevant categories to calculate how confidently a keyword points to a given category. Our objective is to choose only the features that confidently point to only one category. In the Improved Gini Index and cross entropy methods, the probabilities of a term with respect to all categories are considered. Thus, if the term tk appears many times in the documents of category ci, or if tk appears in every document of category ci, tk is assigned a higher weight. In a situation where tk appears in both the categories c1 and c2 an equal number of times, and moreover, it appears in every document of the both categories, then tk is assigned a lower weight. In this case tk is ambiguous, as it does not point to a single category. Our proposed AM feature selection avoids such situation and assigns a lower weight to such features. For tfidf method, tf refers to term frequency with respect to a given category and idf indicates the ratio of documents in the collection that have a given term. In the tficf method, icf indicates the ratio of categories that have a given term. Some terms may appear only in one category for a small number of times. Although these terms appear in only a single category or document, they are purged during the feature selection process if Table 1. Different feature selection algorithms
Method
Formula
Odds Ratio
OR(t k ci )
Tficf
tficf (t k , ci ) TF (t k , ci ) * log
Tfidf
tfidf (t k , d i ) TF(t k , d i ) * log
Improved Gini Index
Gini(t k )
Info. Gain
Ref. P(t k | ci ).[1 P(t k | ci )] [1 P(t k | ci )].P(t k | ci )
|C| cf (t k ) | D| df (t k )
P(t k | Ci ) 2 .P(Ci | t k ) 2
IG(t k , ci ) c {ci ,ci } t
Cross Entropy (CE)
CE(tk ) P(tk )
CHI
CHI(tk , ci )
P(t, c) P(t, c) log 2 P (t )P(c) {tk ,tk }
m
P(Ci | tk ) log2 i
P(Ci | tk ) P(Ci )
N[P(tk , ci ).P(tk , ci ) P(tk , ci ).P(tk , ci ) P(tk ).P(tk ).P(ci ).P(ci )
[17]
[2]
they have a low term frequency. Furthermore, some terms frequently appear in a few categories or documents (i.e., a high icf or idf) with a similar distribution of occurrence in all categories. Such terms are ambiguous, as they do not point strongly to only a single category. However, as the term frequency of such terms is high, these terms may be selected as good features. The AM feature selection method avoids such situations by only considering the ratio between the numbers of occurrences of a term in a given category to the total number of occurrences of the term in training set. Thus, both these situations are avoided.
3. METHODOLOGY Initially, we describe the intuitive motivation behind our approach and then provide a formal definition of our method. We consider the human perception of identifying the topic of a document by a glance at the document and capturing the keywords. Normally one bases his/her decision about the topic of a document based on the most unambiguous words that the eye captures. We explain this using a hypothetical example. Consider the short paragraph (below) that is extracted from www.wikipedia.com [6]. “Metallica is a Grammy Award-winning American heavy metal/thrash metal band formed in 1981 and has become one of the most commercially successful musical acts of recent decades. They are considered one of the "Big Four" pioneers of thrash metal, along with Anthrax, Slayer, and Mega-death. Metallica has sold more than 90 million records worldwide, including 57 million albums in the United States alone.” The paragraph seems to be about “Music”. Our human perception is based on our knowledge of the domain or what we hear daily on various subjects. Thus, if one is familiar with the famous rock metal band “Metallica”, then without reading the text, one can confidently claim that the text belongs to Music rather than Medicine or Sports. Thus, if a feature points to only one category, then we assign a higher ambiguity measure to such a feature and if a feature is vague and does not point to any given category in particular, then we assign a lower ambiguity measure to such a feature. Formally, Ambiguity measure (AM) is defined as the probability that a term falls into a particular category and is calculated using the following formula. The closer the AM value is to 1 then the term is considered less ambiguous. Conversely, if AM is closer to 0, the term is considered more ambiguous with respect to a given category. The formula for calculating AM is given as follows. AM (t k , Ci )
tf (t k , ci ) tf (t k )
AM (tk ) max(AM (tk , Ci )) [2]
Where tf(t,c) is the term frequency of a term t in category c and tf(t) is the term frequency of a term t in the entire collection.
[13]
The result of the calculation of Ambiguity measure (AM) for the feature “Metallica” is given in Table 2, indicating Music category for the term. The AM value for the feature “Metallica” is 0.99, which indicates that the feature “Metallica” is an unambiguous feature and should be kept and not filtered. The feature “Anthrax” is related to the Medicine category with an AM value of 0.80. “Anthrax” is also the name of a famous music band in 1980s. Hence, it also appears in the category Music. Thus, the ambiguity measure of “Anthrax” is less than “Metallica”. In some cases the
[15] [13] [15]
ambiguity measure of some features is low as they appear consistently in different categories. Example of such is the term “Records”, which may appear in all different categories. Thus, the AM value of such term is low (0.33) and it is desirable to filter out such features. This reduction in dimensionality of the feature set increases the accuracy by avoiding the terms that have lower AM values. We empirically determine a threshold and filter out all the features whose AM measure is below that given threshold.
to compare the accuracy of the classification results. The top 10 categories of Reuters 21578 are “earn”, “acq”, “money-fx”, “grain”, “trade”, “crude”, “interest”, “wheat”, “corn” and “ship”. We use Mod-Apte train-test split for Reuters 21578 dataset. There are 7,053 documents in training set and 2,726 documents in testing set. The total number of unique features in Reuters 21578 dataset is 19,249.
Table 2. Ambiguity Measure (AM) example
4.2 Evaluation Measures
Term
Metallica
Category
Count
AM
Anthrax Count
AM
Records Count
AM
Medicine
0
0
800
0.80
150
0.15
Music
990
0.99
150
0.15
240
0.24
Sports
10
0.01
00
0.00
330
0.33
Politics
0
0
50
0.05
280
0.28
To evaluate the accuracy of our approach and compare AM to the results of the state of the art feature selection methods we use micro-F1 measure. F1 measure is a common measure in text classification that combines recall and precision into a single score with equal importance according to the formula:
F1measure=
2. P . R (P R)
where P is precision and R is recall. Furthermore, we also use AM value of a feature as its weight. In the SVM classifier, a weight of importance is assigned to each feature. Thus, if the AM value of a feature is higher, then the feature has more weight and if the AM value is lower, that feature has less weight.
4. EXPERIMENTAL SETUP In all our experiments, we use a single computer, with AMD Athlon 2.16Ghz processor and 1 GB of RAM. We use the linear SVM kernel in our experiments, as the non-linear versions gain very little in terms of performance [11]. For training and testing the SVM model, we use LibSVM 2.84 [1], a software that is commonly used for classifying the documents into binary or multi-labeled categories.
4.1 Datasets To demonstrate the effectiveness of AM feature selection algorithm, we perform experiments on two standard benchmark datasets: 20 Newsgroup and Reuters 21578. 20 News Group 20 Newsgroup (20NG) [7] consists of a total of 19,997 documents that are categorized into twenty different news groups. Each category contains one thousand documents. Some of the categories are very closely related to each other (e.g. comp.sys.ibm.pc.hardware and comp.sys.mac.hardware), while others are highly unrelated (e.g. misc.forsale and soc.religion.christian). This characteristic contributes to the difficulty of categorization of documents that belong to very similar categories. We use a 9-1 train-test split for 20 Newsgroup dataset. Thus we have 18,000 documents for training and 1,997 documents for testing. The total number of unique features in 20 Newsgroup dataset is 62,061. Reuters 21578 The Reuters 21578 corpus [8] contains Reuters news articles from 1987. The documents range from being multi-labeled, single labeled, or not labeled. Reuters dataset consists of a total number of 135 categories (labels). However, ten of these categories have significantly more documents than the rest of the categories. Thus, commonly the top 10 categories are used for experimentations and
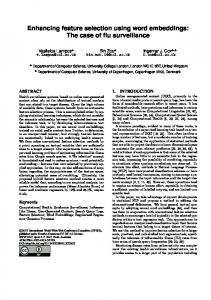
5. RESULTS & ANALYSIS We organize the results into two subsections. In section 5.1, the effectiveness of our approach on two standard benchmark datasets is presented. We compare our results with the published state of the art results and show that AM performs statistically significantly better than the seven existing feature selection algorithms that are summarized and published in [13][14]. To our knowledge, the classification results for SVM algorithm using odds ratio, tfidf and tficf are not reported in any prior works on Reuters 21578 and 20 Newsgroups datasets, thus, we implemented these feature selection methods on SVM and report the results in Figure 1 and Figure 2. In section 5.2, we demonstrate how AM feature selection reduces the training time while optimizing the F1 measure. We also explain the effects of the threshold value on the classification results.
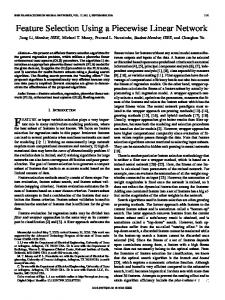
5.1 Accuracy Comparison The comparison of classification performance of AM feature selection method with various feature selection methods that are reported in [13] on Reuters 21578 dataset is summarized in Figure 1. [13] proposed an improved version of gini index that performs better than the other reported feature selection algorithms. Our proposed AM feature selection method statistically significantly outperforms the Improved Gini index and other feature selection methods depicted in figure 1 with a confidence level of 99% on Reuters 21578 using a two-tailed paired t-test. Similarly, the classification performance on 20 Newsgroups dataset is summarized in Figure 2. We compare our results to orthogonal centroid feature selection (OCFS) method reported in [14]. To keep our results presentation consistent with that reported in [14], we too, report the micro F1 measures of OCFS by applying ceiling function to the results and rounding to the next highest integer. As shown, AM feature selection method clearly outperforms OCFS method on 20 Newsgroups dataset with a significant improvement. Moreover, AM also statistically significantly outperforms the accuracy of information gain, CHI, odds ratio, tfidf and tficf feature selection methods. As depicted in Figure 1 and Figure 2 the F1 measure on Reuters dataset (89.14%) is significantly higher than F1 measure on 20 Newsgroups dataset (78.74%). The difference between the F1
Figure 1: Comparison of AM with other feature selection methods in terms of F1 measure on Reuters 21578 dataset
Figure 2: Comparison of AM with other feature selection methods in terms of F1 measure on 20 Newsgroup dataset
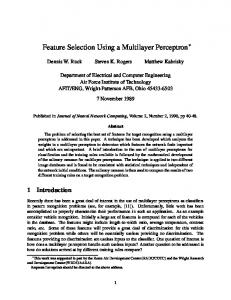
Figure 3: Correlation between AM thresholds and training/testing time; and between the AM threshold and Micro-F1, using SVM classifier on Reuters 21578 dataset
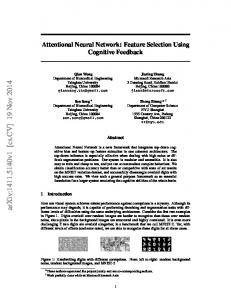
Figure 4: Correlation between AM thresholds and training/testing time; and between the AM threshold and Micro-F1, using SVM classifier on 20 Newsgroup dataset
results of Reuters 21578 and 20NG datasets is due to the percentage of positive and negative examples in the training sets of each. That is, we only consider the top 10 categories for Reuters 21578 dataset. The training set consists of 10% of every category on average. As SVM is a binary classifier and we use one-against-rest approach for multi-labelled datasets, the number of positive examples (actual category) in training set is 10% and number of negative examples is 90%. In the 20NG dataset, we have 20 categories with 5% of documents of each category in the training set. Thus, during classification, we have 5% positive examples and 95% negative examples. Hence, there are less positive examples to learn from in 20NG dataset as compared to the Reuters dataset, resulting to a better accuracy for Reuters 21578 dataset.
value indicates that all the features whose weights are above that value are selected and the remaining features are filtered. The % of keywords value (figures 3 & 4) indicates the corresponding percentage of keywords selected when the threshold was set to a given value. As shown in Figure 3, when we apply AM feature selection method, micro-F1 measure increases as we filter out the features with lower AM value. We obtain the best micro-F1 value when the threshold is set to 0.3. Only 70.16% of the features are retained when the threshold is 0.3. As the threshold is increased, the micro-F1 measure starts dropping. This indicates that when the threshold is less than 0.3, most of the features that are filtered are ambiguous and lead to a higher accuracy of the classifier. When the threshold is above 0.3, most of the features that are filtered contain information relevant to text classification. Thus, when these features are filtered, the accuracy of the classifier decreases.
5.2 Tradeoff of accuracy and time with respect to threshold values In this section, we report the effects of the AM thresholds in the process of feature selection on the values of F1 measure and the corresponding time taken to train the model and classify the documents using SVM classifier. Figure 3 and figure 4 show the results for Reuters 21578 and 20 Newsgroups datasets, respectively. The x-axis represents different threshold values and the y-axis represents micro-F1 measure and time. The threshold
The training time includes the feature selection time and the time taken to train the SVM model using LibSVM. The testing time is the time taken by LibSVM to classify the testing data. Figure 3 demonstrates that when no feature selection is applied, i.e. when threshold is equal to zero, time taken for training is 33 seconds. When we reduce the dimensionality of feature set by setting the threshold to 0.3, the training time also reduces to 21 seconds. This demonstrates the effect of feature selection in reducing the training time for SVM while optimizing the results.
As shown in Figure 4, the behavior of micro-F1 measure on 20 Newsgroups dataset is similar to the results on Reuters dataset. The results consistently improve when the threshold is below 0.2. Only 41% of features are retained when the threshold is set to 0.2. As the threshold increases, more features are filtered and thus, from a certain point the accuracy of the classifier consistently degrades as the threshold further increases.
7. REFERENCES
When no feature selection is applied, time taken for training is 387 seconds. However, when we reduce the dimensionality of feature set by setting the threshold to 0.2, the training time also reduces to 185 seconds. We also get the best F1 measure value when the threshold is set to 0.2. This shows that even though the learning time is reduced by more than 50%, we still obtain comparable or better results than when we do not apply any feature selection. 20 Newsgroups dataset has more training documents (18,000) than Reuters 21578 dataset (7,053). Also the number of features (62,061) and the average document length (78) for 20 Newsgroups dataset is more than Reuters 21578 dataset (No. of features: 19,248, Avg. document length: 53). Thus, the training time taken for 20 Newsgroups is more than the training time taken for Reuters 21578 dataset.
[3]
[1] [2]
[4]
[5]
[6] [7] [8]
One of the limitations of using feature selection algorithms is to find a proper threshold for a given dataset. We found the threshold for Reuters 21578 dataset as 0.2 and for 20 Newsgroups dataset as 0.3. Additionally, we experimented using stratified 10fold cross validation and confirmed the same thresholds as we reported for Reuters Mod-Apte split and 20 News Groups 9-1 split. To further investigate this problem, we further experimented on two additional standard datasets from statlog collection [10] called DNA dataset (3 categories; 2,000 training documents; 1,186 testing documents) and Vehicle dataset (4 categories; 761 training documents; 85 testing documents). We found that the threshold for both DNA dataset (Micro F1: 93.17%) and Vehicle dataset (Micro F1: 82.29%) is also 0.3. Thus, the observation indicates that the threshold between 0.2 to 0.3 yields the best results on the four datasets we used for our experimentations.
6. CONCLUSION We explored an effective feature selection algorithm, Ambiguity Measure (AM); and we applied AM on SVM text classification. With an ever-increasing number of digital documents, many traditional text classification techniques fail to handle the scale of this data due to their time complexity and space requirements. In this paper, we have shown that AM feature selection method can reduce the computation time of the SVM text classifier to an extent without hurting the effectiveness of the classifier. We performed experiments on two standard benchmark datasets, Reuters 21578 and 20 Newsgroups. We showed that AM performs statistically significantly better than the current published state of the art feature selection algorithms on SVM. Furthermore, we provided analysis of how the micro-F1 is affected as we set more stringent thresholds for feature selection. We demonstrated that as the threshold for selecting the features is increased, the micro-F1 measure improves until up to a specific threshold. The time taken for training a classifier is much lower than the scenario when no feature selection is used. By increasing the threshold beyond a point, the effectiveness of the text classifier decreases.
[9]
Chang C.C., Lin C.J., LIBSVM: a library for support vector machines, 2001. Chih H.B., Kulathuramaiyer N., An Empirical Study of Feature Selection for Text Categorization based on Term Weightage. IEEE/WIC/ACM International Conference on Web Intelligence, 2004. pg: 599-602. Cortes C., Vapnik V., Support-vector networks. Machine Learning, Volume 20, Number 3, September 1995. pg. 273297. Joachims T., Making Large-scale support vector machine learning practical. In B. Schölkopf et al. (Eds.), Advances in kernel methods: Support vector learning. MIT Press, 1999, pg. 169–184. Joachims T., Text Categorization with Support Vector Machines: Learning with many relevant features. 10th European Conference on Machine Learning, 1998, pg. 137142. http://en.wikipedia.org/wiki/Metallica. Lang K., Original 20 Newsgroups Dataset. http:// people.csai.mit.edu/jrennie/20Newsgroups. Lewis D., Reuters-21578, http://www.daviddlewis.com/ resources/testcollections/reuters21578. Mengle S., Goharian N., Platt Alana., FACT: Fast Algorithm for Categorizing Text. IEEE 5th International Conference on Intelligence and Security Informatics, 2007. pg 308 – 315.
[10] Michie D., Spiegelhalter D., Taylor C., Machine Learning,
Neural and Statistical Classification. Prentice Hall, 1994. [11] Mladenić D., Brank J, Grobelnik M., Milic-Frayling N.,
Feature Selection using Linear Classifier Weights: Interaction with Classification Models. 27th ACM SIGIR Conference on Research and Development in Information Retrieval, 2004. pg 234-241. [12] Novovicova J., Malik A., Information-theoretic feature
[13]
[14]
[15]
[16]
[17]
selection algorithms for text classification. IEEE International Joint Conference on Neural Networks, IJCNN 2005. Volume: 5, pg 3272- 3277. Wenqian S., Houkuan H., Haibin Z., Yongmin L., Youli Q., Zhihai W., A novel feature selection algorithm for text classification. Expert Systems with Applications: An International Journal Volume 33, Issue 1, 2007 pg 1-5. Yan J., Liu N., Zhang B., Yan S., Chen Z., Cheng Q., Fan Q., Ma W. OCFS: optimal orthogonal centroid feature selection for text categorization. Proceedings of the 28th annual international ACM SIGIR conference on Research and development in Information Retrieval, 2005. pg 122129. Yang Y., Pedersen J.. A comparative study on feature set selection in text categorization. 14th International Conference on Machine Learning, 1997. pg: 412-420. Yang Y., Zhang J., Kisiel B, A scalability analysis of classifiers in text categorization. 26th ACM SIGIR Conference on Research and Development in Information Retrieval, 2003. pg: 96-103. Zheng Z., Srihari R., Optimally Combining Positive and Negative Features for Text Categorization. In Proceedings of the ICML, Workshop on Learning from Imbalanced Datasets II, Washington DC, 2003.