Using Control Charts to Monitor Process and Product Quality Profiles WILLIAM H. WOODALL and DAN J. SPITZNER Virginia Tech, Blacksburg, VA 24061-0439
DOUGLAS C. MONTGOMERY and SHILPA GUPTA Arizona State University, Tempe, AZ 85287-5906 In most statistical process control (SPC) applications, it is assumed that the quality of a process or product can be adequately represented by the distribution of a univariate quality characteristic or by the general multivariate distribution of a vector consisting of several correlated quality characteristics. In many practical situations, however, the quality of a process or product is better characterized and summarized by a relationship between a response variable and one or more explanatory variables. Thus, at each sampling stage, one observes a collection of data points that can be represented by a curve (or profile). In some calibration applications, the profile can be represented adequately by a simple straight-line model, while in other applications, more complicated models are needed. In this expository paper, we discuss some of the general issues involved in using control charts to monitor such process- and product-quality profiles and review the SPC literature on the topic. We relate this application to functional data analysis and review applications involving linear profiles, nonlinear profiles, and the use of splines and wavelets. We strongly encourage research in profile monitoring and provide some research ideas. KEY WORDS: Calibration; Linear Regression; Multivariate Quality Control; Nonlinear Regression; Splines; Statistical Process Control; Wavelets.
Introduction
common in practical applications. For each profile, we assume that n (n > 1) values of the response variable (Y ) are measured along with the corresponding values of one or more explanatory variables (the Xs), the latter of which often include variables that reflect the location of the measurement on a manufactured item.
the use of control charts for cases W in which the quality of a process or product is better characterized by a relationship between a E CONSIDER
response variable and one or more explanatory variables than by the standard use of the distribution of a single quality characteristic or a general multivariate quality vector. These cases appear to be increasingly
Jin and Shi (2001) used the term waveform signals to refer to what we call profiles. These signals are often collected by sensors during manufacturing processes. Their examples included tonnage stamping in stamping, torque signals in tapping, and force signals in welding. Gardner et al. (1997) used the term signature in place of our use of profile.
Dr. Woodall is a Professor in the Department of Statistics. He is a Fellow of ASQ. His e-mail address is
[email protected]. Dr. Spitzner is an Assistant Professor in the Department of Statistics. His e-mail address is
[email protected]. Dr. Montgomery is a Professor in the Department of Industrial Engineering. He is a fellow of ASQ. His e-mail address is
[email protected].
Kang and Albin (2000) presented two examples of situations for which product profiles are of interest. One example was a semiconductor manufacturing application involving calibration, where the performance of a mass flow controller was characterized by a linear function. Calibration processes are
Ms. Gupta is a graduate student in the Department of Industrial Engineering. Her e-mail address is shilpa.gupta@ asu.edu.
Vol. 36, No. 3, July 2004
309
www.asq.org
310
W. H. WOODALL, D. J. SPITZNER, D. C. MONTGOMERY, AND S. GUPTA
(1998) can be applied, but we believe it may often be more efficient to summarize the in-control performance with a linear regression or other parametric model and monitor for shifts in the parameters of this model. For nonparametric models, one can alternatively monitor metrics that reflect the discrepancies between observed profiles and a baseline profile established using historical data.
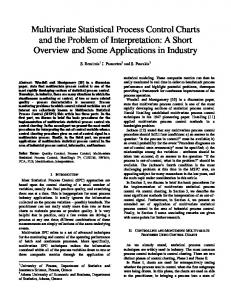
FIGURE 1. A Location Chart from Boeing (1998, p. 91).
often characterized by linear functions, as discussed by Mestek et al. (1994), for example. Hemsch et al. (2000) gave an interesting application of profile data arising from the quality monitoring of the accuracy of wind tunnel results. In this application, Y is the axial force coefficient and X is the angle of attack. The profile framework also includes applications in which numerous measurements of the same variable, e.g., a dimension such as thickness, are made at several locations on each manufactured part. Boeing (1998, pp. 89–92) proposed a location control chart approach for this situation, but the control limits used for each location depend only on the responses at that location. Thus, the method does not make full use of the data because their multivariate structure is ignored. An illustration of a location chart from Boeing (1998) is shown in Figure 1, where the response is the upper flange angle measured at n = 15 locations for 13 parts. The LSL and USL are the lower and upper specification limits, respectively. The LNTL and UNTL are the natural tolerance limits that are three standard deviations from the sample mean at each location. The profile application is very similar in some respects to the monitoring of multiple stream processes, e.g., multihead filling operations, as discussed by Runger, Alt, and Montgomery (1996) and Mortell and Runger (1995), but the nature of the effects of assignable causes of variation are likely to be different. Most often with multiple stream processes, it is assumed that there is only a shift in the mean response corresponding to one stream or that the mean responses for all streams shift to a common level. If assignable causes affect the patterns of measurements in known ways, the approaches of Barton and Gonzalez-Barreto (1996–1997) or Runger and Fowler
Journal of Quality Technology
The use of linear and other types of functions as responses in designed experiments has been studied. For recent work, see Miller (2002) and Nair et al. (2002). Also, profile data are frequently used in classification, pattern recognition, and signal discrimination. See, for example, Hall, Poskitt, and Presnell (2001). We do not consider these types of applications in our paper. We consider some general issues and recommendations for using control charts to monitor profiles in the next section. We then consider the simplest case, where the profile can be represented by a straight line. In the following section, we discuss process monitoring topics involving more complicated models. We review statistical process control (SPC) applications involving the use of nonlinear regression models, splines, and wavelets. Relationships to other SPC methods are then discussed. We give our concluding discussion and some ideas for further research in the last section.
Some General Issues In this section, we discuss some of the issues to be addressed when monitoring profiles. Phase I vs. Phase II Applications In many applications of control charting, it is useful to distinguish between Phase I and Phase II methods and applications. See ANSI/ASQC (1996) and Woodall (2000), for example. In Phase I, one analyzes an historical set of process data. The goals in Phase I are to understand the variation in a process over time, to evaluate the process stability, and to model the in-control process performance. This latter step is usually accomplished by the estimation of the parameters of a parametric model. Assignable causes of variation are considered to correspond to unusual and preventable events that disrupt the process and could, for example, cause a change in the parameters of the underlying model of the profile. Samples associated with assignable causes are removed from the data if the sources of the assignable causes can be determined and they can be prevented in the future.
Vol. 36, No. 3, July 2004
USING CONTROL CHARTS TO MONITOR PROCESS AND PRODUCT QUALITY PROFILES
311
In Phase II, one is concerned with process monitoring using on-line data to quickly detect shifts in the process from the baseline established in Phase I. Different types of statistical methods are appropriate for the two phases, with each type requiring different measures of statistical performance. Under the SPC framework, one compares Phase I methods by assessing the probability of deciding that the process is out of control, i.e., unstable. In Phase II, the emphasis is on detecting process trends or shifts as quickly as possible. The latter is usually measured by parameters of the run-length distribution, where the run length is the number of samples taken before an out-of-control signal is given. The average run length (ARL) is often used to compare the performance of competing control chart methods in Phase II, usually under the assumption of trends or sustained step shifts in the parameters of the model estimated from Phase I. Under the SPC framework, the emphasis is on controlling the false-alarm rate in Phase I and the in-control ARL in Phase II and using methods that have been demonstrated through the use of statistical performance measures to be effective in detecting specified trends or shifts in the distribution of the quality variable over time. With profile data collected for Phase I, one should examine the fit of the hypothesized model for each profile. One should check, for example, for outliers. In some cases, it may be more appropriate to delete specific points within a profile dataset rather than to discard the entire profile sample. In this case, some of the formulas corresponding to the proposed profile methods require modifications to account for the changes in the sample size and the values of the explanatory variable(s). Principal-Components and Functional Data Analysis The principal-component analysis, as described by Jones and Rice (1992), can be very useful in summarizing and interpreting a set of Phase I profile data with identical, equally spaced values of a dependent variable X for each profile. If the X-values are not naturally equally spaced, one can smooth the data and use interpolation to obtain fitted response values for a set of equally spaced values. With this approach, one treats each profile as a multivariate vector of n response Y -values and identifies a few mutually orthogonal linear combinations of the Y variables that explain as much variation in the profiles as possible. If these principal components are
Vol. 36, No. 3, July 2004
FIGURE 2. Vertical Density Profile Data from Walker and Wright (2002).
interpretable, this approach can be very effective in understanding process performance. Jones and Rice (1992) recommended plotting the average profile and the profiles with the largest and smallest principalcomponent scores for aiding in the interpretation of the principal components. We strongly recommend the use of these plots in Phase I. As an illustration, consider the data used by Walker and Wright (2002) shown in Figure 2. For several engineered wood boards, each vertical-density profile consists of n = 314 measurements taken 0.002 inches apart. These data are available at http://bus. utk.edu/stat/walker/VDP/Allstack.TXT. The profiles corresponding to the largest and smallest principal component scores for the first two principal components are shown in Figures 3 and 4, respectively. The first two principal components account for 84.0% and 10.7% of the variation in the profiles, respectively. Principal components are often difficult or impossible to interpret, but in this example, it is clear that the first principal component corresponds to shifts in the profiles along the vertical direction and the second to the flatness of the profile. The profile-monitoring application can be viewed as falling into the general area of functional data analysis. See Ramsey and Silverman (2002). The principal-component approach of Jones and Rice (1992) is a standard technique of functional data analysis. Most of the current work on the topic of profile monitoring, however, still relies fundamentally on standard ideas from classical regression and multivariate analysis.
www.asq.org
312
W. H. WOODALL, D. J. SPITZNER, D. C. MONTGOMERY, AND S. GUPTA
FIGURE 3. Vertical Density Profiles with Largest (+ + + + +) and Smallest (− − − − −) First Principal-
FIGURE 4. Vertical Density Profiles with Largest (+ + + + +) and Smallest (− − − − −) Second Principal-
Component Scores. (Solid line represents average profile.)
Component Scores. (Solid line represents average profile.)
Model Selection Any model selected for a particular application should be as simple as required to adequately model the profile data. Thus, standard recommendations regarding model selection apply. The sample size required for each profile will depend on the model used. Also, advantages and disadvantages of various models in the single-sample case carry over to our multiple sample application. With any model, however, it must be determined how to design a monitoring procedure to detect profile changes over time most effectively, preferably in a way that allows for the interpretation of out-of-control signals. Profile-to-Profile Common-Cause Variation It is critically important to assess variation between profiles in Phase I as well as variation within profiles. Common-cause variation is that variation considered to be characteristic of the process and that cannot be reduced substantially without fundamental process changes. It must be determined how much of the profile-to-profile variation is commoncause variation and should be incorporated into the determination of the control chart limits to be used in Phase II. If a parametric model is used, we refer here to variation in the values of the parameters but not variation in the form of the model itself. There is common-cause variation between profiles if it is not reasonable to expect each set of observed profile data to be adequately represented using the same set
Journal of Quality Technology
of parameters for the assumed model. Woodall and Thomas (1995), for example, discussed this issue of determining the most relevant variance estimates in the standard case of monitoring the mean of a univariate quality characteristic when there is said to be legitimate batch-to-batch variation. Process knowledge is always required in the decision whether or not to include profile-to-profile variation as commoncause variation. From our experience, it is often unrealistic to expect that process improvement can be used to remove all profile-to-profile variation. The Control Chart Statistic(s) In Phase II, it is often recommended to monitor the profiles using a separate control chart for each parameter of a parametric model, provided the estimators of the parameters at each sampling stage are independent. The interpretation of out-of-control signals would be enhanced, however, if assignable causes tended to affect the parameters individually. If the estimators of the parameters of the model for the profile are dependent, as is more often the case, one can use a T 2 -chart based on the successive vectors of estimators obtained at the sampling stages. As discussed by Sullivan and Woodall (1996) and Vargas (2003), however, it is important to use an appropriate estimator of the variance–covariance estimator in Phase I in order to account for common-cause variation. In particular, if the vectors of estimators are pooled in order to estimate the variance–covariance matrix, then the resulting T 2 chart will tend to be
Vol. 36, No. 3, July 2004
USING CONTROL CHARTS TO MONITOR PROCESS AND PRODUCT QUALITY PROFILES
quite ineffective in detecting outlying profiles or sustained shifts in the profiles over time. The method of estimating the variance–covariance matrix based on the differences of successive vectors, proposed by Hawkins and Merriam (1974) and later by Holmes and Mergen (1993), is usually preferred. This recommendation is analogous to the standard use of the average moving range in Phase I to estimate the standard deviation when applying an individuals Xchart to monitor the mean in the univariate case, as opposed to pooling all of the data and using the pooled standard deviation as the estimator. Vargas (2003) studied the performance of other estimators of the variance–covariance matrix that are also more robust to shifts in the mean vector. If the approach used is nonparametric, then a reasonable approach is to base control charts on metrics that measure the departures of observed process profiles from a baseline profile model developed in Phase I. One such metric is the average deviation of the observed profile from the baseline profile calculated over a grid of X-values. Gardner et al. (1997) recommended this approach. From a statistical process control point of view, however, it is important to develop control chart limits for the charts based on these metrics such that the overall false-alarm rate is controlled. One should make sure that the choice of statistics to monitor does not result in methods that are unable to detect certain types of profile shifts. For example, if one chooses to monitor only a subset of the principal components or a subset of the wavelet coefficients that were determined using only in-control data, then certain types of out-of-control profile shifts may be undetectable. In both of these cases, the statistics monitored are linear combinations of the response variables for each profile. Unless a full set of n mutually orthogonal linear combinations of the data is monitored, one loses the ability to detect some types of profile shifts. If one monitors only a few of the linear combinations, then a chart such as the SPE-chart discussed by MacGregor (1997) can be used to check for shifts in other directions. In some cases, however, it may be possible to target control charts to detect specified types of process faults. This can be done by inducing the process faults and observing the effect on several profiles. The control chart statistic can then be determined, perhaps using discriminant analysis, to be most effective in detecting a specific fault. Gardner et al. (1997), for example, use this type of approach. This strat-
Vol. 36, No. 3, July 2004
313
egy reduces the dimensionality of the problem and increases the power of the charts, but one must be careful not to overlook important types of process faults.
Analysis of Linear Profiles In this section, we review the work done on the simplest case, the one in which the profile is adequately represented by a straight line. Although the profile may be curved, a linear approximation may be accurate for a restricted region of the X-variable. Phase II Methods Several researchers have studied Phase II control charting methods for monitoring a process for which the in-control quality of a product is characterized by a simple linear regression relationship with assumed known values of the Y -intercept, slope, and variance parameters. The data were assumed to consist of successive samples of size n, although the methods could be generalized to handle unequal sample sizes. One approach of Kang and Albin (2000) involves a multivariate T 2 -chart based on the successive vectors of the least squares estimators of the Y -intercept and slope. Their second method uses statistics based on the successive samples of n deviations from the incontrol line. They recommended the combination of an exponentially weighted moving average (EWMA) chart to monitor the average deviation and a range (R-) chart to monitor the variation of the deviations. It is well known that the EWMA chart, which combines information from the samples over time, can be used to detect more quickly small- and moderatesized sustained process changes than a Shewharttype decision rule that is based on only the information in the current sample. Kim, Mahmoud, and Woodall (2003) proposed alternative control charts for monitoring in Phase II. They used the estimated regression coefficients, i.e., the estimates of the Y -intercept and slope of the linear function, from each sample to construct two separate EWMA charts. Because they recommended coding the X-values so that the estimators of the Y -intercept and slope are independent, they monitored each of the two regression coefficients using a separate chart. Also, they proposed replacing the Rchart of Kang and Albin (2000) by one of two EWMA charts for monitoring a process standard deviation, including one developed by Crowder and Hamilton (1992). The ARL performance of the combined use of these three EWMA charts to monitor separately
www.asq.org
314
W. H. WOODALL, D. J. SPITZNER, D. C. MONTGOMERY, AND S. GUPTA
the Y -intercept, the slope, and the variation about the regression line was shown to be superior to that of the Phase II methods of Kang and Albin (2000) for sustained shifts in the regression parameters. Their method is also much more interpretable because each parameter in the model is monitored with a separate control chart. These methods are now being applied in semiconductor manufacturing at Intel Corporation, as discussed by Ajmani (2003). Phase I Methods Kang and Albin (2000) recommended that their Phase II methods be used in Phase I with estimates substituted for the values of the unknown parameters. Their EWMA chart approach, however, is not appropriate in Phase I. The advantages of the EWMA chart regarding its statistical performance in Phase II to detect sustained shifts in a parameter do not apply in Phase I in which other types of shifts are often of interest. Also, quick detection is not an issue in Phase I because one is working with a fixed set of baseline data, all of which should be used in the analysis. Mestek et al. (1994) and Stover and Brill (1998) also considered the Phase I problem. Stover and Brill (1998) proposed two methods in Phase I for which k samples of bivariate historical data are available. One is a Hotelling’s T 2 approach based on vectors containing estimates of the Y -intercept and slope. This method is similar to the Phase I T 2 method of Kang and Albin (2000), although the given marginal distribution of the control statistic is different due to the use of a different estimator for the variance– covariance matrix. Kang and Albin (2000) made the implicit assumption that there is no common-cause variation between profiles. Their assumption is that there is only random variation about a fixed line for in-control profiles. Stover and Brill (1998) pooled the Phase I vectors of estimated regression coefficients in estimating the variance–covariance matrix. Thus, they implicitly assumed that all variation between profiles is part of the common-cause variation and that no assignable causes of variation were present in Phase I. Neither set of authors acknowledged, however, the fact that successive values of their Phase I T 2 values are dependent because each is based on the same estimator of the vector of incontrol model parameters and the same estimator of the variance–covariance matrix. Thus, the overall probability of a signal by these methods cannot be determined exactly using the marginal distributions of their T 2 statistics. This dependence between the
Journal of Quality Technology
plotted statistics grows weaker with an increasing number of profiles, however, and close approximations to the overall false-alarm probability can be obtained as shown by Mahmoud and Woodall (2004a). Another Phase I method, proposed by Stover and Brill (1998), was a univariate chart based on the first principal component corresponding to the vectors containing the Y -intercept and slope estimators. We agree with the advice of Kim et al. (2003), however, against using this principal-component chart because, with it, one will not be able to detect combinations of shifts in the Y -intercept and the slope in the direction perpendicular to the major axis corresponding to the first principal component. Kim et al. (2003) recommended the use of the Shewhart type T 2 -chart for the Y -intercept and slope but also recommended a Shewhart chart to monitor the error variance. If one codes the X-values as they recommend, so that the average X-value is zero, then it seems reasonable to use separate Shewhart-type charts for monitoring the Y -intercept and slope because the estimators of the Y -intercept and slope are independent for each sample. The interpretation of signals from this approach is much more straightforward than using a T 2 -based method. Mahmoud and Woodall (2004a) proposed a Phase I method based on the standard approach of testing collinearity using indicator variables for each profile in a multiple regression model. The performance of several competing methods was compared for different numbers of shifts of a specified size in the regression parameters. The authors showed that Phase I methods proposed by Brill (2001) and Mestek et al. (1994) are ineffective in detecting shifts in the process parameters due to the ways in which the vectors of estimators were pooled to estimate the variance– covariance matrix. Mahmoud and Woodall (2004a) illustrated several of the Phase I methods using a calibration dataset given by Mestek et al. (1994). Linear Calibration Applications Although Rosenblatt and Spiegelman (1981) pointed out the potential usefulness of control chart procedures to decide if recalibration is needed, relatively little work seems to have been done on this topic. Ciminera and Tukey (1989) proposed a control chart method based on successive differences when a fixed standard is measured periodically. Other similar control charting methods were given in ISO 57256 (1994). These methods are based on deviations of measurements from a single fixed standard and do
Vol. 36, No. 3, July 2004
USING CONTROL CHARTS TO MONITOR PROCESS AND PRODUCT QUALITY PROFILES
not rely on the simultaneous evaluation of several standards. Thus, there seems to be an implicit assumption that any assignable cause would affect only the Y -intercept of a linear calibration curve and not the slope. As discussed by Kim et al. (2003), once the parameters are established in a baseline linear calibration study, one would want to detect any change in the Y -intercept or slope and any increase in the variation about the regression line because such shifts could correspond to greater inaccuracies in the measurement process. A change in the Y -intercept could indicate the introduction of bias, and a change in the slope indicates a dilation or contraction of the measurement scale. A decrease in the variation about the line would correspond to an improvement in the measurement process, as long as the other parameters do not change. An increase in this variation could indicate more variation in the measurements or an introduction of nonlinearity into the measurement process. One could easily test for nonlinearity, if this was considered to be a potential problem. The effect of assignable causes in general, however, will vary from application to application. Sometimes, for example, one may wish to detect isolated outliers. Croarkin and Varner (1982) proposed a method for monitoring a linear calibration curve based on the measurement of three standards at each time period. These are at low, medium, and high values, respectively. The three deviations of the measured values from these standards are plotted simultaneously for each sample on a Shewhart-type control chart. Although performance comparisons have not been completed, we expect that the use of control charts based on the estimated regression parameters will be more effective. This latter approach would certainly be much more interpretable, particularly as the number of standards measured at each time period increases. The NIST/SEMATECH e-Handbook of Statistical Methods, which is available online at http:// www.itl.nist.gov/div898/handbook/, contains a discussion of the methods proposed by Croarkin and Varner (1982). Other Linear Profile Approaches Change point methods can also be very useful in Phase I if one suspects that instability can be modeled adequately by step shifts in the underlying parameter(s). Andrews et al. (1996) and many others have discussed change point methods for linear regression models. Mahmoud and Woodall (2004b)
Vol. 36, No. 3, July 2004
315
generalized these methods to reflect our assumed sampling scheme and to allow for shifts in the error variance. As a natural extension of the simple linear regression model used as a profile, one can consider using control charts to monitor profiles that can be represented by a polynomial regression model or some other multiple linear regression relationship. Jensen, Hui, and Ghare (1984) considered Phase II methods for this situation and Gardner et al. (1997) mentioned this approach in passing as an option. Box and Draper (1969, p. 171) showed a plot of quadratic response surface curves that changed over time due to the effect of a decaying catalyst, but with an emphasis on process adjustment, not process monitoring.
Other Profile Models and Approaches The modeling of process or product profiles has been approached with other methods. For example, Walker and Wright (2002) used additive models to represent the curves of interest in the monitoring of vertical density profiles of particleboard, although they do not consider the time order of the data. In this section, we cover the use of nonlinear models, wavelets, and splines to represent profiles. Nonlinear Profiles In some cases, a nonlinear regression model is useful for modeling a profile. The form of the model may follow from scientific principles underlying the process of interest. Brill (2001) mentioned, as one option in an example involving chemical processing, using a T 2 monitoring approach based on the estimated regression coefficients in the nonlinear regression model. His example was based on an unnamed chemical property referred to as “umph.” Williams, Woodall, and Birch (2003) studied the use of T 2 control charts to monitor the coefficients of the nonlinear regression fits to the successive sets of profile data. They gave several general approaches to the formulation of the T 2 statistics and the determination of the associated upper control limits in Phase I applications. The choice of method primarily depends on the extent to which common-cause variation includes variation between profiles. The various approaches were illustrated using the vertical board density profile data provided by Walker and Wright (2002). Young et al. (1999) also considered a vertical density profile application. In their approach, however, the data for each profile were summarized into a top-face, bottom-face, and core average den-
www.asq.org
316
W. H. WOODALL, D. J. SPITZNER, D. C. MONTGOMERY, AND S. GUPTA
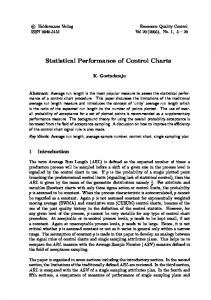
sity. Then a T 2 approach was used for the resulting three-dimensional quality vectors. We prefer the nonlinear modeling approach to their averaging approach in this application because much more information is retained about the shape of each profile. In general, however, it may be useful to break the range of the X-variable into intervals and to model the profile within each interval. Each subprofile could be monitored separately or a T 2 method could be used. This approach seems most promising when assignable causes tend to affect the profile only within certain intervals. It is related to the use of nonparametric methods based on the Haar wavelet system. Methods Based on Wavelets Jin and Shi (2001) used wavelets to monitor waveform signals for diagnosis of process faults. They recommended using T 2 -charts in Phase I and Phase II, where the T 2 statistics are based on the ndimensional response vectors. Brill (2001) noted that this type of approach is inefficient. Treated as a multivariate normal vector, the response variables are very highly correlated and thus the approach leads to overparameterization. This approach also requires much more data because a large variance– covariance matrix must be estimated. Jin and Shi (2001) also used the pooled variance–covariance estimator, which was shown by Sullivan and Woodall (1996) and Vargas (2003) to be ineffective at detecting shifts in the mean vector. As stated earlier, using the successive differences in vectors to estimate the variance–covariance matrix or another robust method is often much more effective. Jin and Shi (1999) used wavelets to model stamping tonnage signals. An example of this type of profile is shown in Figure 5. They recommended Shewhart charts to monitor changes in wavelet coefficients. A general framework for monitoring wavelet coefficients is yet to be developed, although some additional work was reported by Lada, Lu, and Wilson (2002), and Sun, Zhou, and Shi (2003, unpublished manuscript). Lada et al. (2002) proposed Phase II methods for a selected set of wavelet coefficients, with control limits based on a resampling approach under the assumption that the Phase I data were in control. The statistical performance of their proposed methods was not studied. Methods Involving Nonparametric Regression Nonparametric methods do not require a specified functional form for the profile. In nonparametric re-
Journal of Quality Technology
FIGURE 5. Example of a Stamping Force Profile Given by Jin and Shi (1999).
gression methods, one obtains a smoothed curve that can be expressed as a weighted average of the observed responses. Winistorfer et al. (1996) used this approach to model vertical density profile data for pressed wood panels. In a semiconductor application, Gardner et al. (1997) modeled the spatial signatures (i.e., profiles) of wafers using splines and then used various metrics to compare the profiles of new wafers to an established baseline surface. In these applications, the response was oxide thickness, and two X-variables indicated the location of the measurements on a twodimensional grid. The metrics used were designed to detect specific equipment faults. In one of their two applications, there were only four profiles used to establish the baseline, and common-cause variation between profiles was not addressed. The in-control distributions of the proposed metrics were evaluated using bootstrapping, based on within-profile variation, in order to determine the control limits. The statistical performance of this procedure, however, was not evaluated. The performance of the bootstrap method is somewhat suspect, given the relatively poor performance of bootstrapping methods for determining control limits in the standard univariate case reported by Jones and Woodall (1998). Spitzner and Woodall (2003) compared classical multivariate tests with the adaptive Neyman test of Fan and Lin (1998) applied to a Fourier-transformed version of the profile data of Gardner et al. (1997). They recommended further investigation into the use of the modern techniques of high-dimensional adaptive testing. Boeing (1998, pp. 140–144) also proposed Phase
Vol. 36, No. 3, July 2004
USING CONTROL CHARTS TO MONITOR PROCESS AND PRODUCT QUALITY PROFILES
II control charting methods using spline fitting. In this application, there are multiple gap measurements made at several locations on a manufactured part. Splines are fit to the responses for each part. The average spline value for the first k splines observed or nominal values are used as the baseline. Then some aspect, i.e., metric, is calculated for each spline relative to the baseline. The metric could be, for example, either the maximum difference or the average absolute difference. Individual X-charts and moving range charts are then based on the values of the metrics. The statistical performance of this method, however, was not evaluated. We would expect the skewness and other properties of the distributions of the metrics to result in statistical performance of the control charts that deviates considerably from what one would expect under the assumption of normality.
Relationships with Other SPC Methods Kim et al. (2003) pointed out that the monitoring of linear profiles is closely related to the control charting of regression-adjusted variables, as considered by Zhang (1992), Hawkins (1991, 1993), Wade and Woodall (1993), Hauck et al. (1999), and others. In these approaches, a regression model is often used to account for the effect of an input-quality variable X on the output-quality variable Y when monitoring a particular stage of a manufacturing process. The use of regression adjustment of a single quality variable based on a simple linear regression model is very similar to the linear profile situation. The Phase I regression-adjusted data, however, usually consist of a single sample of n bivariate data points, not multiple such samples. Also, in Phase II of regressionadjusted applications, one typically observes a sequence of individual deviations from the predicted values of Y based on the fitted Phase I regression model. Thus, one usually has considerably more data in monitoring profiles. In the regression-adjusted applications, the values of the variable result from the output of the previous stage of the manufacturing process. It is thus usually considered to be a random variable, not taking fixed values as is often assumed in the linear profile-monitoring applications, particularly calibration applications. The profile-monitoring application is only indirectly related to the use of control charts for monitoring a process to detect linear trends in the underlying mean of a univariate quality variable, as discussed,
Vol. 36, No. 3, July 2004
317
for example, by Davis and Woodall (1988). One can view this application in the linear profile context only if one considers the use of individual observations that are grouped, perhaps artificially, into samples of n consecutive and nonoverlapping values, with time used as the independent variable. Viewing each entire sample successively, one would be interested in a shift in the slope of the observations as a function of time from zero to some nonzero value and a change in the Y -intercept. One should note that any sustained trend in the mean would likely occur within one of the samples of size n, resulting in an initial out-ofcontrol profile pattern not considered in the linear profile case. We do not recommend this approach in practical applications, however, because it requires the artificial grouping of data over time. Krieger et al. (2003) considered an application that could be viewed as a case of simple linear regression profile monitoring, but with n = 1 and where X corresponds to time. As observations are collected over time, their goal was to detect a change in the slope of the regression line. This problem is quite similar to the one studied by Brown et al. (1975). In fact, there has been quite a bit of research on this general topic of detecting changes in regression models over time, but the assumptions regarding the data available are quite different than in our profile applications. Grimshaw and Alt (1997) proposed a method for detecting a change in the shape of the probability distribution of a univariate quality characteristic using quantile (or inverse cumulative distribution) functions. In this application, the quantile function can be viewed as a profile that reflects the shape of the univariate distribution. Profile-monitoring methods are used in chemometrics. In the use of partial least squares, for example, models are fit relating process X-variables to quality Y -variables. See, for example, Kresta et al. (1991) and Kourti and MacGregor (1996). Profilemonitoring methods such as the ones we consider, however, are not typically used. According to MacGregor (2003, personal communication), one reason for this is that the measured quality Y -values are not generally available all of the time, and usually are available only well after the process X-variables are available. Bharati and MacGregor (1998) proposed methods for the analysis of image data, where the images can be considered to be profiles, although considerably more complicated profiles than those reviewed in our paper.
www.asq.org
318
W. H. WOODALL, D. J. SPITZNER, D. C. MONTGOMERY, AND S. GUPTA
Finally, the profile-monitoring application is somewhat related to standard multivariate profile analysis. See, for example, Seber (1984, pp. 117– 124 and pp. 424–425). In the profile analysis approach, however, the data are not observed sequentially. In addition, each of the profiles in profile analysis consists of a set of sample means, not individual data values, as is most often the case in our profilemonitoring applications.
Conclusions We view the monitoring of process and product profiles as the most promising area of research in statistical process control. It expands the area to include a much broader array of statistical methods and models and to include a much wider class of applications. Most of the work we have reviewed has appeared in the past few years. The topic of profile monitoring was omitted by Woodall and Montgomery (1999) and Stoumbos et al. (2000), for example, even as a research area in SPC. Very little research has been done on the statistical monitoring of process or product profiles with control charts. Only the simple linear regression profile case has been studied in any detail. There are many topics that deserve attention by researchers. Basic issues, such as the appropriate number of profiles to include in Phase I and the use of subgroups of size greater than one, i.e., multiple profiles in each sample instead of just one, have not been studied. In some cases, existing methods can be improved. Clearly, for example, the multivariate EWMA chart of Lowry et al. (1992) could be used in Phase II as a substitute for, or in addition to, the T 2 -charts in order to detect smaller sustained shifts in profiles more quickly. As pointed out by a reviewer of our paper, it is not particularly important that the monitoring algorithms be simple, as long as the final output is easy to understand. In any future research and in applications, it is important to address the issue of common-cause profile-to-profile variation and to assess its effects. If T 2 -charts are used, we recommend the method of Holmes and Mergen (1993) or Vargas (2003) to estimate the variance–covariance matrix. These approaches may result in the incorporation of some profile-to-profile variation into the common-cause variation, but they allow the detection of assignable causes in Phase I. As illustrated by Sullivan and Woodall (1996), Vargas (2003), and Mahmoud and Woodall (2004a), the often-recommended method
Journal of Quality Technology
of pooling all of the Phase I data to estimate the variance–covariance matrix results in inflated variance estimates if assignable causes of variation are present in Phase I, which in turn may mask the effect of the assignable cause(s). Also, if one monitors only a few of the principal components or a few of the wavelet coefficients obtained from Phase I data, one should ensure there is not a profile shift in Phase II in some otherwise undetectable direction. In other words, the statistics used in the control charts must span the subspace defining the out-of-control states. Current topics under our study include further comparisons of the monitoring methods for linear calibration relationships, change-point methods for simple linear regression profile data, the performance of nonparametric regression methods in conjunction with metric-based control charts, and the use of generalized linear models to represent profiles. Other promising research topics include the effect of estimation error and/or measurement error on chart performance, the use of other charts such as the cumulative sum (CUSUM) chart, the incorporation of multiple response variables, comparisons of competing methods, the consideration of autocorrelated profile data, and the development of regression-adjusted profilemonitoring methods, just to name a few.
Acknowledgments The authors are grateful to the referees and the editor for helpful comments that led to substantial improvements in the paper.
References Ajmani, V. B. (2003). “Using EWMA Control Charts to Monitor Linear Relationships in Semiconductor Manufacturing”. Paper presented at the Joint Statistical Meetings, San Francisco, CA, and at the 47th Annual Fall Technical Conference of ASA and ASQ, El Paso, Texas. Andrews, D. W. K.; Lee, I.; and Ploberger, W. (1996). “Optimal Changepoint Tests for Normal Linear Regression”. Journal of Econometrics 70, pp. 9–38. ANSI/ASQC. (1996). B1-1996 Guide for Quality Control Charts, B2-1996 Control Chart Method of Analyzing Data, B3-1996 Control Chart Method of Controlling Quality During Production. American Society for Quality, Milwaukee, WI. Barton, R. R. and Gonzalez-Barreto, D. R. (1996–97). “Process-Oriented Basis Representations for Multivariate Process Diagnostics”. Quality Engineering 9, pp. 107–118. Bharati, M. H. and MacGregor, J. F. (1998). “Multivariate Image Analysis for Real-Time Process Monitoring and Control”. Industrial & Engineering Chemical Research 37, pp. 4715–4724.
Vol. 36, No. 3, July 2004
USING CONTROL CHARTS TO MONITOR PROCESS AND PRODUCT QUALITY PROFILES Boeing Commercial Airplane Group, Materiel Division, Procurement Quality Assurance Department. (1998). Advanced Quality System Tools, AQS D1-9000-1. The Boeing Company, Seattle, WA. Box, G. E. P. and Draper, N. R. (1969). Evolutionary Operation: A Statistical Method for Process Improvement. John Wiley & Sons, Inc., New York, NY. Brill, R. V. (2001). “A Case Study for Control Charting a Product Quality Measure That Is a Continuous Function Over Time”. Presentation at the 45th Annual Fall Technical Conference, Toronto, Ontario. Brown, R. L.; Durbin, J.; and Evans, J. M. (1975). “Techniques for Testing the Constancy of Regression Relationships Over Time” (with discussion). Journal of the Royal Statistical Society, Series B 37, pp. 149–192. Ciminera, J. L. and Tukey, J. W. (1989). “Control-Charting Automated Laboratory Instruments When Many Successive Differences May Be Zero”. Journal of Quality Technology 21, pp. 7–15. Croarkin, C. and Varner, R. (1982). “Measurement Assurance for Dimensional Measurements on Integrated-Circuit Photomasks”. NBS Technical Note 1164, U.S. Department of Commerce, Washington, DC. Crowder, S. V. and Hamilton, M. D. (1992). “An EWMA for Monitoring a Process Standard Deviation”. Journal of Quality Technology 24, pp. 12–21. Davis, R. B. and Woodall, W. H. (1988). “Performance of the Control Chart Trend Rule Under Linear Shift”. Journal of Quality Technology 20, 260–262. Fan, J. and Lin S.-K. (1998). “Test of Significance When Data Are Curves”. Journal of the American Statistical Association 93, pp. 1007–1021. Gardner, M. M.; Lu, J. -C.; Gyurcsik, R. S.; Wortman, J. J.; Hornung, B. E.; Heinisch, H. H.; Rying, E. A.; Rao, S.; Davis, J. C.; and Mozumder, P. K. (1997). “Equipment Fault Detection Using Spatial Signatures”. IEEE Transactions on Components, Packaging, and Manufacturing Technology—Part C 20, 295–304. Grimshaw, S. D. and Alt, F. B. (1997). “Control Charts for Quantile Function Values”. Journal of Quality Technology 29, pp. 1–7. Hall, P.; Poskitt, D.; and Presnell, B. (2001). “A Functional Data-Analytic Approach to Signal Discrimination”. Technometrics 43, pp. 1–24. Hauck, D. J.; Runger, G. C.; and Montgomery, D. C. (1999). “Multivariate Statistical Process Monitoring and Diagnosis with Grouped Regression-Adjusted Variables”. Communications in Statistics—Simulation and Computation 28, pp. 309–328. Hawkins, D. M. (1991). “Multivariate Quality Control Based on Regression-Adjusted Variables”. Technometrics 33, pp. 61–75. Hawkins, D. M. (1993). “Regression Adjustment for Variables in Multivariate Quality Control”. Journal of Quality Technology 25, pp. 170–182. Hawkins, D. M. and Merriam, D. F. (1974). “Zonation of Multivariate Sequences of Digitized Geologic Data”. Mathematical Geology 6, pp. 263–269. Hemsch, M.; Grubb, J.; Krieger, W.; and Cler, D. (2000). “Langley Tunnel Data Quality Assurance—Check Standards
Vol. 36, No. 3, July 2004
319
Results”. AIAA 2000–2201, 21st AIAA Advanced Measurement Technology and Ground Testing Conference, June 19– 22, Denver, CO. Holmes, D. S. and Mergen, A. E. (1993). “Improving the Performance of the T 2 Control Chart”. Quality Engineering 5, pp. 619–625. ISO 5725-6. (1994). Accuracy (Trueness and Precision) of Measurement Methods and Results—Part 6. International Organization for Standardization, Geneva, Switzerland. Jensen, D. R.; Hui, Y. V.; and Ghare, P. M. (1984). “Monitoring an Input-Output Model for Production. I: The Control Charts”. Management Science 30, pp. 1197–1206. Jin, J. and Shi, J. (1999). “Feature-Preserving Data Compression of Stamping Tonnage Information Using Wavelets”. Technometrics 41, pp. 327–339. Jin, J. and Shi, J. (2001). “Automatic Feature Extraction of Waveform Signals for In-Process Diagnostic Performance Improvement”. Journal of Intelligent Manufacturing 12, pp. 257–268. Jones, L. A. and Woodall, W. H. (1998). “The Performance of Bootstrap Control Charts”. Journal of Quality Technology 30, pp. 362–375. Jones, M. C. and Rice, J. A. (1992). “Displaying the Important Features of Large Collections of Similar Curves”. American Statistician 46, pp. 140–145. Kang, L. and Albin, S. L. (2000). “On-Line Monitoring When the Process Yields a Linear Profile”. Journal of Quality Technology 32, pp. 418–426. Kim, K.; Mahmoud, M. A.; and Woodall, W. H. (2003). “On the Monitoring of Linear Profiles”. Journal of Quality Technology 35, pp. 317–328. Kourti, T. and MacGregor, J. F. (1996). “Multivariate SPC Methods for Process and Product Monitoring”. Journal of Quality Technology 28, pp. 409–428. Kresta, J. V.; MacGregor, J. F.; and Marlin, T. E. (1991). “Multivariate Statistical Monitoring of Process Operating Performance”. The Canadian Journal of Chemical Engineering 69, pp. 35–47. Krieger, A. M.; Pollak, M.; and Yakir, B. (2003). “Surveillance of a Simple Linear Regression”. Journal of the American Statistical Association 98, pp. 456–469. Lada, E. K.; Lu, J. -C.; and Wilson, J. R (2002). “A Wavelet-Based Procedure for Process Fault Detection”. IEEE Transactions on Semiconductor Manufacturing 15, pp. 79–90. Lowry, C. A.; Woodall, W. H.; Champ, C. W.; and Rigdon, S. E. (1992). “A Multivariate Exponentially Weighted Moving Average Control Chart”. Technometrics 34, pp. 46– 53. MacGregor, J. F (1997). “Using On-Line Process Data to Improve Quality: Challenges for Statisticians”. International Statistical Review 65, pp. 309–323. Mahmoud, M. A. and Woodall, W. H. (2004a). “Phase I Analysis of Linear Profiles with Calibration Applications”. To appear in Technometrics. Mahmoud, M. A. and Woodall, W. H. (2004b). “A Change Point Method for Linear Profile Data”. Submitted for publication. ´nek, M. (1994). “MulMestek, O.; Pavlik, J.; and Sucha tivariate Control Charts: Control Charts for Calibration
www.asq.org
320
W. H. WOODALL, D. J. SPITZNER, D. C. MONTGOMERY, AND S. GUPTA
Curves”. Fresenius’ Journal of Analytical Chemistry 350, pp. 344–351. Miller, A. (2002). “Analysis of Parameter Design Experiments for Signal-Response Systems”. Journal of Quality Technology 34, pp. 139–151. Mortell, R. R. and Runger, G. C. (1995). “Statistical Process Control of Multiple Stream Processes”. Journal of Quality Technology 27, pp. 1–12. Nair, V. N.; Taam, W.; and Ye, K. Q. (2002). “Analysis of Functional Responses from Robust Design Studies”. Journal of Quality Technology 34, pp. 355–370. Ramsay, J. O. and Silverman, B. W. (2002). Applied Functional Data Analysis: Methods and Case Studies. Springer, New York, NY. Rosenblatt, J. R. and Spiegelman, C. H. (1981). Discussion of “A Bayesian Analysis of the Linear Calibration Problem” by W. G. Hunter and W. F. Lamboy. Technometrics 23, pp. 329–333. Runger, G. C.; Alt, F. B.; and Montgomery, D. C. (1996). “Controlling Multiple Stream Processes with Principal Components”. International Journal of Production Research 34, pp. 2991–2999. Runger, G. C. and Fowler, J. W. (1998). “Run-to-Run Control Charts with Contrasts”. Quality & Reliability Engineering International 14, pp. 261–272. Seber, G. A. F. (1984). Multivariate Observations. John Wiley & Sons, New York, NY. Spitzner, D. J. and Woodall, W. H. (2003). “Highdimensional Directed Testing for Monitoring Functional Profiles”. Proceedings of the American Statistical Association, pp. 225–236. Stoumbos, Z. G.; Reynolds, M. R., Jr.; Ryan, T. P.; and Woodall, W. H. (2000). “The State of Statistical Process Control as We Proceed into the 21st Century”. Journal of the American Statistical Association 95, pp. 992–998. Stover, F. S. and Brill, R. V. (1998). “Statistical Quality Control Applied to Ion Chromatography Calibrations”. Journal of Chromatography A 804, pp. 37–43.
Sullivan, J. H. and Woodall, W. H. (1996). “A Comparison of Multivariate Quality Control Charts for Individual Observations”. Journal of Quality Technology 28, pp. 398–408. Vargas, J. A. (2003). “Robust Estimation in Multivariate Control Charts for Individual Observations”. Journal of Quality Technology 35, pp. 367–376. Wade, M. R. and Woodall, W. H. (1993). “A Review and Analysis of Cause-Selecting Control Charts”. Journal of Quality Technology 25, pp. 161–169. Walker, E. and Wright, S. P. (2002). “Comparing Curves Using Additive Models”. Journal of Quality Technology 34, pp. 118–129. Williams, J. D.; Woodall, W. H.; and Birch, J. B. (2003). “Phase I Monitoring of Nonlinear Profiles”. Presented at the 2003 Quality and Productivity Research Conference, Yorktown Heights, New York. Winistorfer, P. M.; Young, T. M.; and Walker, E. (1996). “Modeling and Comparing Vertical Density Profiles”. Wood and Fiber Science 28, pp. 133–141. Woodall, W. H. (2000). “Controversies and Contradictions in Statistical Process Control” (with discussion). Journal of Quality Technology 32, pp. 341–378. Woodall, W. H. and Montgomery, D. C. (1999), “Research Issues and Ideas in Statistical Process Control”. Journal of Quality Technology 31, pp. 376–386. Woodall, W. H. and Thomas, E. V. (1995). “Statistical Process Control with Several Components of Common Cause Variability”. IIE Transactions 27, pp. 757–764. Young, T. M.; Winistorfer, P. M.; and Wang, S. (1999). “Multivariate Control Charts of MDF and OSB Vertical Density Profile Attributes”. Forest Products Journal 49, pp. 79–86. Zhang, G. X. (1992). Cause-Selecting Control Chart and Diagnosis, Theory and Practice. Aarhus School of Business, Department of Total Quality Management, Aarhus, Denmark.
∼
Journal of Quality Technology
Vol. 36, No. 3, July 2004