Using Flowchart-based Programming Environments for Simplifying Programming and Software Engineering Processes Stelios Xinogalos Department of Technology Management University of Macedonia Naoussa, Greece
[email protected]
Abstract—Programming environments based on an iconic, flowchart-based notation have been widely used in the context of introducing novices to programming. These tools were initially heavily based on the technology of structure editing, with the aim of alleviating the burden of focusing on the syntactic details of programming languages and giving the chance to focus on acquiring problem solving skills. The technology of program animation was also utilized, in order to allow for a better comprehension of programming structures and flow of control. Furthermore, the ability of generating syntactically correct source code from the flowchart was integrated into these tools. Recently, several advanced features were added in flowchartbased programming environments, such as support for collaborative activities and distributed pair programming and usage in mobile devices. In this paper, a thorough review of programming environments based on an iconic notation is carried out with a focus on the support provided for introducing novices to programming, as well as other important software engineering issues in a simplified and straightforward manner. Proposals for research on this field and opportunities for a better teaching and learning of software engineering are presented. Keywords-Programming; Object oriented programming; Programming environments; Educational technology
I.
INTRODUCTION
Visual formalisms have attracted great interest and have been heavily used in Computer Science and related fields. A characteristic example is Harel’s statecharts that resulted from an effort to define diagrams that describe the behavior of reactive systems [1]. Statecharts were initially devised for avionics, but are now used in telecommunications, hardware design, control systems and other areas, while a variant of them has become part of UML. Flowcharts are another type of charts that have been heavily utilized in the past in the context of introductory Computer Science courses, as a means of introducing novices to algorithms and programming. As stated in the literature, studies have shown that flowcharts can be very effective for visual learners both for writing and comprehending algorithms [2]. However, there are also studies that do not support this statement. For example, the highly referenced experiments
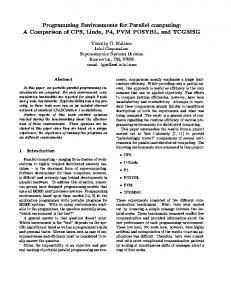
carried out by Shneiderman, Mayer, McKay and Heller (1977) with the aim of studying the usefulness of detailed flowcharts as tools for composition, comprehension, debugging and modification of programs showed that there is no statistical semantic difference in students’ performance that use flowcharts and students that use code for the aforementioned activities [3]. After several years of utilizing flowcharts as a means of learning algorithms and programming, they were gradually abandoned. The main reason for this was the fact that designing and especially modifying flowcharts using paper and pencil is an impractical, time-consuming and tedious process for novices [2]. Moreover, flowcharts in paper format are static and do not provide any help for comprehending neither the dynamic nature of program execution nor the control structures [4]. In the context of searching for more effective teaching approaches several types of programming environments were developed based on one or more of the following approaches/technologies [4]: (1) programming microworlds – mini-languages; (2) improving the diagnosing capabilities of compilers; (3) structure editors – iconic programming languages; (4) program animation systems (software visualization); (5) applying algorithm animation techniques; (6) program auralization. Each one of these approaches aimed at dealing with one or more of the most common difficulties faced by novice programmers, as depicted in Figure 1. These difficulties result in students’ distraction from the basic goal of acquiring problem solving skills and comprehending programming constructs and concepts. In this paper, a thorough review of the environments falling into the category of iconic programming languages, or else flowchart-based environments, is presented. Contemporary environments of this kind offer program animation features. Users do not just develop static charts, but have the ability to execute them in a step by step manner with automatic update of variables. Two important advantages of this feature are: (1) ability to comprehend the dynamics of a program; (2) ability to run the program with different data sets and comprehend both the role and modification of variables depicted in the chart, a
Please cite this paper as: Xinogalos, S. (2013). Using Flowchart-based Programming Environments for Simplifying Programming and Software Engineering Processes. In Proceedings of 4th IEEE EDUCON Conference, Berlin, Germany, 13-15 March 2013, IEEE Press, pp. 1313-1322.
Figure 1. Alternative teaching approaches and types of programming environments for dealing with novices’ difficulties.
notion related to the proposed control-data-predicate model which defines each operator in a program in terms of modifications in three connected graphs (predicates, control and data) [5]. Such environments can be utilized for introducing novices to programming, but also for a brief and simplified introduction to other fundamental fields, concepts and models of software engineering, such as software design and testing, programming paradigms (procedural and objectoriented) and UML. In this paper the most important features of iconic, flowchart-based programming environments are comparatively analyzed with a focus on recent advances that have led to some really powerful tools, as well as their potential uses in introductory programming and software engineering courses. The paper is organized as follows. In section II the most fundamental technologies used in iconic, flowchart-based programming environments are presented together with their main goals. In section III, eleven environments are reviewed, while in section IV a comparative analysis of these environments is carried out. Finally, in section IV conclusions are drawn regarding the recent advances in iconic, flowchartbased programming environments. Emphasis is given on research opportunities in this area, with a special focus on exploitation of one of the tools presented, namely RAPTOR, for familiarizing students with other software engineering issues in addition to programming. II.
FUNDAMENTAL TECHNOLOGIES USED IN ICONICBASED PROGRAMMING ENVIRONMENTS
Programming environments based on an iconic notation use some kind of graphical/symbolic representation for data types, variables and control structures. In these environments coding is accomplished with a syntax-directed editor [6] that provides
templates and menus with syntactically correct choices for every incomplete part of a program. Such templates can be based either on textual representations or on some kind of graphical/symbolic representation. The type of templates used distinguishes syntax-directed editors in structure editors [7] and iconic programming languages [8] respectively, with the latter being the focus of this article. The main goal of syntax editors is to use a programming language to implement an algorithm for solving a problem without having to be concerned about syntactic details [6]. This fact has a positive impact on dealing with the problem of focusing on low level details, such as learning how to format programs so that they are readable, learning how to use clumsy text editors and learning how to manage the software life cycle [9]. Moreover, it gives the chance to focus attention on issues of structure and design. Relieved from the problem of focusing on low level details students can be assigned more demanding assignments that stress structure and design issues. Especially in the case of iconic programming languages that are used for developing programs with the form - usually - of a flowchart, attention is focused on developing problem solving skills ([10], [11], [12]). Besides the technology of syntax-directed editing, programming environments based on an iconic notation utilize the technology of software visualization [13] as well, with the aim of supporting the comprehension of algorithmic and programming concepts. The technology of software visualization appeared in 1981 in the 30 minute film Sorting Out Sorting by Ron Baecker [14]. This film has been extensively used for teaching the 9 sorting algorithms that it contains and it played an important role in the history of software visualization. Generally, the term software visualization refers to the use of typography, graphics design,
animation and cinematography techniques, as well as modern technologies from the area of HCI and computer graphics with the aim of supporting the comprehension of concepts and the effective use of computer software [14]. In the case of programming environments with an iconic notation, software visualization refers to the use of a graphical representation of programs, the visualization of data structures and variables. Moreover, program animation [15] is used in order to provide a detailed, highly visual view of the source code of a program in execution, giving students the opportunity to study programs and program constructs, functions, procedures, recursion, variables, parameter passing mechanisms, data structures and flow of control. Program visualization can be either static (i.e. presentation of a linked list with a diagram) or dynamic. The simplest example of dynamic visualization of source code is highlighting the line of the code that is executed by changing the color of its background and showing simultaneously its result. It is obvious that in programming environments based on an iconic notation there is no source code, although their creators refer to the flowcharts developed as programs. No matter how we call it, a flowchart consists of distinct steps that can be highlighted and executed one at a time with simultaneous update of variables. Program animation and software visualization in general, draw students’ attention and offer many opportunities to novice programmers [16], such as: (1) studying programs and complex program concepts through the use of pictures; (2) comprehending theoretical concepts through practice, i.e. experimenting with different data sets and investigating various aspects of a problem, concept or algorithm with the desired pace; and (3) easier debugging of programs. III.
REVIEW OF ICONIC-BASED PROGRAMMING ENVIRONMENTS
In this section flowchart-based programming environments that were developed for academic and not commercial purposes are reviewed. For each environment important data are presented regarding program development and execution, automatic source code generation, evaluation and availability. A. BACCII and BACCII++ BACCII [8] and BACCII++ [10] were developed in Texas Tech University with the aim of supporting the teaching of procedural and object-oriented programming concepts and languages respectively. Program development. Students develop programs through a syntax directed interface with a palette containing icons for the available statements. The syntax directed interface allows declaring variables of all the basic data types, making assignment, selection and repetition, declaring and calling subprograms, using files for reading/writing data and data input from keyboard. All the statement icons have the shape of a square with a representative image revealing the corresponding statement, and not the common symbols used in flowcharts. The interface allows the insertion of just correct statements in the flowchart being developed, while it makes all the necessary connections and repaints the flowchart automatically.
Automatic source code generation. The programs cannot be executed, but after a program has been completed the system can automatically generate syntactically correct source code in Pascal, C, Fortan, Basic and C++. Evaluation. BACCII was used in the context of an “Introductory Programming” (CS1) course based on the imperative programming paradigm and Pascal, while BACCII++ was used in the context of a “Data Structures” (CS2) course based on the object-oriented programming paradigm and C++. The statistically significant results and implications of the experiments can be summarized as follows. Firstly, students using BACCII and BACCII++ achieved higher scores on their assignments and final syntax specific exams ([8], [10]). Secondly, the use of BACCII++ in the CS1 and CS2 courses at Texas Tech University showed that the environment had a greater impact on the second - based on the object-oriented programming paradigm - course. Calloni and Bagert implied that “the iconic representations play more to the strengths of the object-oriented paradigm than to the imperative design issues…”. Furthermore, the BACCII++ object-oriented based course groups showed a more uniform learning, as they had less variance from the average scores in all categories [10]. The most unexpected result was that BACCII and BACCII++ students showed higher comprehension of the Pascal and C++ syntax respectively than their classmates that did not use the environments ([8], [10]). Calloni and Bagert assumed that students were learning by example, as they were continually viewing correct syntax. B. FLINT FLINT ([11], [12]), the Flowchart Interpreter, was developed at Western Kentucky University with the aim of supporting the CS1 course. Program development. Initially, students are forced to apply stepwise refinement on their plan for solving a problem. This plan has the form of a top-down structured flowchart. When the student starts developing the first algorithm for one of the sub-problems defined in the plan, the system automatically saves it for evaluation from the instructor. FLINT supports the development of structured and syntactically correct flowcharts through the use of a syntax directed point-and-click flowchart builder interface. FLINT supports the sequential, selection and repetition structures. Program execution. FLINT incorporates a flowchart interpreter-debugger, which means that students can execute their algorithms in a step-by-step manner. The “statement” being executed is highlighted, along with the variables associated with it. In order to check the correctness of a flowchart the instructor defines the number of trial executions. Prior each trial execution the system asks students for the input and the expected output and saves this information for usage by the instructor. After each trial execution students are asked to check if the output is the expected one, in order to find out if there are any errors. Evaluation. The creators of FLINT carried out an experiment for comparing structured flowcharts with programs in Qbasic as algorithm comprehension aids [11]. The results
can be summarized as follows: (1) students needed less time to comprehend structured flowcharts; (2) students made fewer errors, had greater confidence, viewed the algorithm fewer times and needed less time to answer questions using flowcharts; (3) flowcharts are more effective as complexity increases. These results are in conformance with the results of Scanlan’s experimental comparison of structured flowcharts and pseudocode as algorithm comprehension aids [17], which is one of the most referenced experiments by the proponents of environments based on flowcharts. However, we must point out that none of these experiments addresses the use of structured flowcharts in the algorithm’s design phase. FLINT is not available and according to Carlisle et al. [18] it was followed-up by Visual Logic [19] that was designed for the beginning of a CS1 course prior to learning Visual Basic. In Visual Logic the waterfall model of programming was abandoned [18] and additional features are supported, such as arrays, multimedia support and turtle graphics that allow the development of interesting programs and simple games. However, Visual Logic is a commercial product. C. SFC Editor SFC Editor (Structured Flow Chart Editor) [20] is an environment for developing algorithms that is suitable both for novice and experienced programmers. Program development. In the main window of SFC Editor the users are presented with the flowchart being developed and the corresponding pseudo code that is automatically generated. Users double click on insertion points in the flowchart, select the structure they want, give the necessary information (such as conditions in selection structures), and make choices regarding the appearance of the flowchart through dialog boxes. The environment supports the three basic algorithmic structures: sequential (process, input/output, subprogram call); selection (single and double decision, multiple selection); and repetition (test at top and test at bottom loop, counting loop, user controlled exit loop). Moreover, users can edit or cut and paste parts of the flowchart (structures, subprograms) in the same or another flowchart. Automatic source code generation. As already mentioned, pseudo code in a C++ or a general Pascal-like format is automatically generated and presented while the flowchart is being developed. The pseudo code can be exported in a text file, modified and compiled in an appropriate programming environment. Tool availability. The SFC Editor for Windows, along with a detailed users’ manual are available through the following URL: http://watts.cs.sonoma.edu/SFC/index.html Evaluation. Tia Watts, developer of SFC Editor and Professor at Sonoma State University, reports on some classroom experiences from using SFC both in beginning and advanced CS courses. However, it was not possible to track down any formal study of SFC. D. RAPTOR RAPTOR ([18], [21], [22], [23]) is a visual programming environment that supports both the imperative and object-
oriented programming technique, and aims at supporting students in constructing visual representations of their algorithms. Program development. Program development in RAPTOR is accomplished by selecting the appropriate symbol from a palette in the main window and clicking on the desired part of the flowchart being developed. The environment supports: input and output; assignment; comments; selection; pre-test, mid-test and post-test loops; procedures; one and two dimensional arrays; files; strings; and a graphics library for an enhanced user interaction. Moreover, the environment has several built-in functions and procedures for generating random numbers, performing trigonometric computations, manipulating time functions, drawing graphics, as well as to interface with pointing devices. The environment has an autocompletion feature for supporting users in making procedure calls, while instructors have the ability to develop additional functions/procedures that students can call in exactly the same way as the built-in functions/procedures (http://raptor.martincarlisle.com/ creating_plugins.htm). The programs developed are kept structured and syntactically correct, since errors are reported during program development and the system demands having them fixed right away. RAPTOR, as mentioned, has an object-oriented mode as well. When selecting the object-oriented mode, users develop their class hierarchy as a UML class diagram, and afterwards they develop each class’s methods in the form of a flowchart, in the same way as in the imperative mode. Each class’s tab pane is separated in a number of inner tab panes – one for each method. The UML designer is based on the open source tool NClass [24] and supports: classes (abstract, sealed, static), interfaces and enumeration types; private, public, protected access modifiers or default; inheritance and polymorphism, as well as class nesting, association, composition, aggregation and dependency. Program execution. RAPTOR supports running flowcharts in a step by step manner, or tracing through them with a speed selected by users. The statement being executed is highlighted with simultaneous update of variable values. Automatic source code generation. RAPTOR generates automatically source code in Ada, C#, C++ and Java from an existing flowchart. Moreover, it is possible to develop a generator of source code for other languages by developing a C# class (http://raptor.martincarlisle.com/code_generator.htm). Tool availability. RAPTOR is freely available through the following URL, along with handouts for several relevant issues, such as an introduction in algorithmic thinking, using control structures, arrays and programming graphics in RAPTOR, decomposing a problem in subprograms and so on: http://raptor.martincarlisle.com/. Evaluation. RAPTOR is currently used for CS education in 17 countries around the world, according to its developers. However, it was not possible to track down any independent study based on RAPTOR. Next, the results of the studies carried out by the team of RAPTOR are briefly presented. RAPTOR was used for three consecutive semesters during the academic years 2003-2004 in the context of an
“Introduction to Computing” course at the department of Computer Science, US Air Force Academy ([18], [21]). The comparative results of teaching the course for three consecutive semesters showed that RAPTOR helps more in developing problem solving capabilities and understanding flow of control in comparison with non-visual languages. The only exception is the usage of arrays. Specifically, in the first offering of the course with RAPTOR (autumn 2003) students’ performance was worst in an exam item that needed the use of arrays. Finally, in the first semester that students had the chance to choose between flowcharts, Ada or MATLAB in the exams, 95% of them used flowcharts. In 2005, RAPTOR was used in the U.S Military Academy in the context of an IT course focusing on designing algorithms and implementing them afterwards in Java [23]. Fifty-four students used RAPTOR and eighteen students used a commercial tool for designing flowcharts. Students that used RAPTOR had a better performance in the final exams, although their number was not enough for achieving statistical semantic results. The RAPTOR group preferred RAPTOR rather than the commercial tool, while they stated that RAPTOR helped them in developing programs in Java. E. SICAS SICAS [25] is a learning tool that was specifically designed for supporting students in acquiring basic algorithmic and programming skills. SICAS (a Portuguese acronym for Interactive System for Algorithm Development and Simulation) intends to support problem solving activities based on constructivist theories [26]. Program development. Flowcharts are developed by selecting symbols from the toolbar and pointing in the desired point on the design area, while the minimum possible information is entered through dialog boxes. Lines connecting the various components of the flowchart are automatically inserted. SICAS supports ([25], [26]): numeric and alphanumeric variables and arrays; assignment; input and output; selection; repetition; and functions, including recursive ones. Program execution. SICAS allows step by step execution with highlighting of the current component with automatic update of variables. Moreover, it allows stepping backward during execution [25]. Students can also validate their program, if the teacher has provided a set for input/output data for testing students’ solution. This feature, provided in the teacher mode of the tool, is considered important since students usually test their programs for the most common and obvious cases and not for any case. Automatic source code generation. Algorithms developed in SICAS can be automatically translated in pseudo code, C or Java. In the case of the authors’ institutions, the Java code generated from SICAS flowcharts is then used when students start expressing problem solutions in Java in the context of COLLEGE, a Real-Time Collaborative Programming system [27]. Evaluation. SICAS was evaluated positively both by teachers and students at the University of Coimbra [25].
F. SICAS-COL SICAL-COL [26] was a follow-up project based on SICAS, aiming at supporting remote collaborative learning activities. SICAS-COL provides three workspaces for [26]: individual work; group discussion; and sharing results. This tool, as is the case for SICAS as well, could not be tracked down. G. H-SICAS H-SICAS [28] is the handheld version of the desktop SICAS for usage on mobile devices. H-SICAS aims at motivating students through the use of mobile devices that nowadays are so widespread and of great appeal to them [26]. H-SICAS offers the same functionality with its desktop version, although some adaptations mainly in the GUI were necessary for using it on mobile devices. H. ProGuide ProGuide ([29], [30], [31]) was developed by the same team that developed the SICAS family of tools. Its main aim is to guide students in solving programming problems, and more specifically in getting started even with a flawed design that can be corrected through the interaction with the system. Program development. The main window of ProGuide is divided into three sections: the problem statement; the editor/simulator for designing and simulating algorithms with the form of flowcharts; and the text-based communication section. The representation of algorithms is similar to the one used in SICAS, while only the basic constructs are supported [30]: input/output; assignment; condition and repetition structures. The difference with SICAS, is the use of a tutoring system model [26], which starts a communication with students when an exercise included in the system is selected. This communication can stop when the student decides so. As long as this communication continues, the dialog based system guides students through questions and presents them with warnings, hints and examples when a wrong design is detected. The dialogue is based on a subset of Portuguese and it has to be rather simple. As stated in [31] the incorporation of new problems in ProGuide is not easy since all the information needed for guiding students has to be created from scratch for each problem in XML. Although the development of a userfriendly tool for this purpose was planned [31], no such reference could be located, as well as the tool. Program execution. Algorithms can be executed in a step by step manner or traced through the end with simultaneous observation of output and variable values. I.
B# B# [32] was designed at Nelson Mandela Metropolitan University with the aim of supporting the initial stages of a CS1 course. B# incorporates an iconic language and an integrated programming environment.
Program development. Flowcharts are designed using icons, similar to the ones used in BACCII/BACCII++, that are different to the common symbols used in flowcharts. B# supports variables and the three fundamental algorithmic constructs of sequence, selection and iteration.
Program execution. B# allows tracing through the execution of the flowchart and the program automatically generated. Automatic source code generation. Syntactically correct source code in Borland Pascal is generated and presented during the development of a flowchart. Evaluation. An empirical study with 59 first year students from the Department of Computer Science and Information Systems Nelson Mandela Metropolitan University in South Africa was carried out during 2003 [32]. The students formed two groups: the control group that used exclusively the Delphi Enterprise IDE based on a textual programming notation (PASCAL) and the treatment group that used both B# and the Delphi Enterprise IDE. The study covered 9 weeks (60%) of the course. The study showed that students’ performance in a CS1 course is significantly improved with the inclusion of iconic technological support in the teaching approach in comparison to just conventional textual technological support. J.
Iconic Programmer The Iconic Programmer [33] allows the interactive development of programs with the form of flowcharts. Program development. Users are initially presented with a flowchart consisting just of the “start” and “end” symbols connected with a line and a small yellow square. When the user clicks on such a yellow square a frame appears for selecting the type of statement that will be inserted in this point of the flowchart. The constructs supported are sequence, selection and repetition. More specifically the following statements are supported: declaration of integer variables, assignment of a random value, or the result of a mathematical expression or user input, selection and repetition. The symbols used in the flowchart are icons and not the common symbols used in structured flowcharts. Moreover, these icons have just a label with the type of the statement and not the specific statement (i.e. “Declare” without the name of the variable being declared). Program execution. Users can run, trace or execute in a step by step manner their programs. When users trace or execute in a step by step manner their programs, each component in the flowchart is highlighted, while the changes of variables’ values and an explanation in natural language for the statement being executed are presented in a Run Panel. This ability of presenting explanatory messages in natural language, known as explanatory visualization [34], has been proven valuable for students in the programming microworld objectKarel [35]. Automatic source code generation. The system can automatically generate pseudocode in English, as well as syntactically correct source code in Java, Turing and C/C++. However, the user has to copy and paste the source code in another environment of his/her choice in order to run the program. Tool availability. The tool along with the examples described in [33] for a three-week lesson plan can be freely downloaded, or launched as an applet from the following URL: http://www.edutoolresearch.com/
K. Progranimate Progranimate ([36], [37]) is a web integrated e-learning environment for designing and executing flowcharts. Its main window is separated in three main areas: the flowchart, the automatically generated code and the variable inspector. Program development. In Progranimate flowcharts are developed by interacting either with the flowchart or the selected code view. Specifically, the user selects the desired structure from a palette in the right of the main window and clicks on the location of the flowchart or source code where this structure should be inserted. The users define the appropriate information, such as the condition in an “if” structure, through dialog boxes that appear when needed. Progranimate supports the following structures: variables (integer, double, char, string, boolean); input; output; assignment; selection (if, if/else); repetition (while, for); and arrays. Common flowchart symbols are used, while color is also used in order to avoid confusion. For example, the conditional expressions of an “if” and a “while” structure are presented with different color. Finally, a special symbol for denoting the end of control structures (such as if, while etc) is used for the same reason, which is avoiding confusion about the scope of such structures. Program execution. Progranimate allows running, tracing or executing in a step by step manner a flowchart with simultaneous data visualization. Its special characteristic is the synchronized execution of both the flowchart and the source code that is automatically generated. As the authors state, this feature allows for the “direct correlation between a flowchart and the code-based structure that it represents” (in [37], pp. 3). Automatically generated source code. The environment presents users with Java-like pseudo code or code in Java, VisualBasic.NET, VisualBasic 6.0, Pascal or JavaScript in parallel with the flowchart. Tool availability. Progranimate can be launched on any computer with the Java Runtime environment, while it can also be integrated into a web page. Progranimate and associated material, such as examples, programming problems and documentation are available in the dedicated web site: http://www.progranimate.com/launch/launchMain.html Evaluation. Initial studies with students ranging from high school students to university undergraduate students have shown positive results ([36], [37]). Evaluation materials and links both for students and experts are available in the web site dedicated to the tool. IV. COMPARATIVE ANALYSIS AND DISCUSSION In this section, the most important features of the environments reviewed are comparatively analyzed and discussed. These features are summarized in Table I. A. Availability Several programming environments based on an iconic, flowchart-based notation have been developed, starting back from 1994 with BACCII [8]. This kind of programming environments has attracted so much interest that even
nowadays the development of new environments is announced. For example, Emanuel de Jesus in 2011 announced his intention to build a web-based application that will allow students to write a program in a structured language and get automatically the flowchart, or vice versa [38]. This environment will take advantage of the advances offered by HTML5 [39] and JavaScript, so as to run on any modern browser independently of the operating system and hardware and be easily integrated into a Learning Management System. Another open-source project is Portugol IDE v3.x [40], which is based on Portugol IDE that was developed in the Polytechnic of Tomar in 2005 by Computer Engineering students. In this review, eleven environments that appear mostly in the relevant literature were analyzed, with four of them being freely available: SFC Editor, RAPTOR, Iconic Programmer and Progranimate. A few more environments exist and are freely available, but these environments were not analyzed since their GUI and notation is based on a national language: Portugol IDE [41] in Portuguese, Visual Flowchart [42] and Flowchart [43] in Greek. B. Notation In all the environments programs are developed with the form of a flowchart. However, in some cases, the symbols used are not the common symbols used in structured flowcharts. Specifically, symbols that have the same shape and a characteristic icon are used. In this case, the creators of the corresponding environments (i.e. BACCII/BACCII++, B#) refer to the notation used with the term iconic programming language ([8], [32]). Iconic programming languages, usually, have an extended instruction set, supporting the declaration of variables, manipulation of text files and generally constructs that are not commonly depicted in flowcharts. Some environments use a hybrid approach. For example, in Iconic Programmer same shaped icons are used for input, output and expressions that have just a label with the type of the statement and not the specific statement (i.e. “Declare” without the name of the variable being declared). This visualization of the flowchart, however, is not considered as helpful as the one used in Progranimate where common flowchart symbols are used having as a label both the type of the statement and the statement itself. Moreover, in Progranimate, color is used for distinguishing between same shaped symbols for different structures, such as the ones used for “if” and “while”. The flowcharts developed in Iconic Programmer make more sense during execution that utilizes explanatory visualization for presenting users with the information not visible in the flowchart itself. In one of the environments, namely RAPTOR, UML class diagrams are also supported when the user selects the object-oriented mode. C. Programming paradigm/technique Flowcharts were traditionally used as a medium of expressing structured algorithms representing imperativeprocedural programs. Since flowcharts are used for introducing novices to algorithms and programming, the vast majority of flowchart-based programming environments that were developed support the imperative-procedural programming paradigm. As Scott Watkins and McPhee state the learning
curve of an objects first approach adds difficulties in the imperative approach and consequently it is much steeper [44]. However, two of the environments analyzed support both the procedural and the object-oriented programming paradigm. These environments are BACCII++ and RAPTOR. In BACCI++ it is not clear how object-orientation is supported, since the environment is not freely available. In RAPTOR users can design a UML class diagram using direct manipulation techniques and interaction. Inheritance and polymorphism, as well as class nesting, association, composition, aggregation and dependency can be depicted in the user’s UML class diagram. In this object-oriented mode of RAPTOR, structured flowcharts are used for implementing the body of each method declared in a class, helping novices realize more easily and clearly how the imperative programming paradigm is used in the context of the objectoriented programming paradigm. D. Execution All the tools, with the exception of BACII/BACII++ and SFC Editor, offer the ability of executing flowcharts, or to be more precise the ability of program animation with automatic update of variables. Especially in the case of SICAS even backward step by step execution is possible, according to its developers [25]. Moreover, in the case of B# users can execute the Borland Pascal source code automatically generated from the flowchart [32], while in ProgrAnimate [37] a synchronized step by step execution of both the flowchart and the code automatically generated in the selected language is offered. In Iconic Programmer explanatory visualization is used for presenting explanatory messages in natural language. This feature is partly supported in Progranimate as well by presenting information about the component of the flowchart being executed, such as the type of a control structure and the condition, at the bottom of the main window. All the aforementioned features are extremely important for novice programmers, since they provide great support in comprehending the semantics of programming structures and flow of control, as well as locating and correcting logic errors. E. Automatic generation of source code Several iconic-based programming environments have the ability of automatic source code generation based on the flowchart. In some cases, such as in SFC Editor, some kind of pseudo code closely related to a production language is generated, which needs extended modifications in order to compile and execute it in an appropriate IDE. In other cases, such as in BACCII/BACCII++, RAPTOR, SICAS and its predecessors, B#, Iconic Programmer and Progranimate, syntactically correct source code is generated that can be executed without modification. B# supports the execution of the source code within the environment, while Progranimate supports the synchronized execution of the flowchart and the source code. Most of the environments that support automatic source code generation offer more than one target language choices, with more common Pascal and Java. In addition, RAPTOR offers the ability of developing a generator of source code for other languages than Ada, C#, C++ and Java that are already supported, by developing a C# class.
TABLE I.
Environment
Availability (free)
BACCII/ BACII++ FLINT SFC Editor
√
COMPARATIVE ANALYSIS OF FLOWCHART-BASED PROGRAMMING ENVIRONMENTS
Programming paradigm/technique Imperativeprocedural
ObjectOriented
√
√
Notation: flowchart with common symbols
same shaped icons
Execution:
√
√
√
Evaluation
Pascal, C, Fortran, Basic, C++
√
√
√ Pseudo code in C++ or Pascal
√
√
√
√
Ada, C#, C++, Java
√
√
SICAS
√
√
√
Pseudo code, C, Java
SICAS-COL
√
√
√
≠
H-SICAS
√
√
√
≠
ProGuide
√
√
√
B#
Iconic Programmer
√
√
Notation: UML class diagram Source code generation: allows development of generators for other languages Execution: Stepping backward Supports collaborative activities Adaptation of SICAS for usage on mobile devices Uses a tutoring system model Both the flowchart and the generated program can be executed
√
√
√
Borland Pascal
√
using text
√
Pseudo code, Java, Turing, C/C++
Execution: Explanatory visualization
√
Java-like pseudo code, Java, VisualBasic.NET, VisualBasic 6.0, Pascal, JavaScript
Deployment: easily integrated into a web page Execution: Synchronized execution of flowchart & source code
Progranimate √
Imposes the waterfall programming model
√
RAPTOR √
Special feature
Program animation
√
√
Automatic source code generator
√
√
Automatic generation of syntactically correct source code can support novices in comprehending the relation between algorithms that they have described in a visual manner with a flowchart and its implementation in a programming language. Novices have the ability to study and run the program that corresponds to their algorithm, without having to be concentrated from the very beginning to the difficult, timeconsuming and sometimes frustrating process of debugging. Finally, the ability of generating source code in various languages presents in a clear manner the fact that a welldesigned algorithm can be easily translated to various programming languages. The most important factor in designing an algorithm is conceiving it and not thinking of it in the context of the programming language used for implementing it. F. Evaluation Evaluation results are available for several of the environments reviewed. However, all these studies were carried out by, or with the participation of, the teams that developed them. Unfortunately, we could not locate independent studies not even for RAPTOR that according to its developers is used in seventeen countries around the world. Such evaluation seems to be more easily carried out for
√
Progranimate, since evaluation materials and links both for students and experts are available in the web site of the tool. CONCLUSION V. Programming environments based on an iconic, flowchartbased notation have been widely used in the context of introducing novices to programming. The first tools developed were heavily based on the technology of structure editing, with the aim of alleviating the burden of focusing on the syntactic details of programming languages and giving the chance to focus on acquiring problem solving skills and an algorithmic way of thinking. Early enough the technology of program animation, in addition to the visualization of flowcharts, was utilized in order to allow step by step execution of flowcharts with simultaneous inspection of variables. Such tools were enhanced with the ability of generating syntactically correct source code from the flowchart. Recently, several advanced features were incorporated in this kind of tools with the aim of constituting them even more effective for novice programmers. The most important advances in programming environments based on an iconic notation are the following: • The object-oriented programming technique is supported through the design of UML class diagrams for representing solutions to problems. For the
implementation of methods imperative-style flowcharts are still used. [RAPTOR] •
The environment integrates the ability of running through the program automatically generated from the flowchart, and not just the flowchart. [B#]
•
A variation of the above feature is the ability of synchronized execution of a flowchart and the corresponding source code. [Progranimate]
•
Explanatory visualization is used for enhancing novices’ comprehension of the semantics of programming structures and flow of control, through the presentation of explanatory messages in natural language for the structure being executed. [Iconic Programmer, partially in Progranimate]
•
The environment is developed as a web-based application, allowing for integration into a Learning Management System, or utilizing it for developing an enhanced e-learning system. Furthermore, this gives the chance of utilizing it in any environment, such as operating system and hardware. [Progranimate]
•
Support for collaborative activities is added, which could potentially lead to the advantages of distributed pair programming. [SICAS-COL]
•
Adaptation of the environment for usage in mobile devices, with the aim of motivating more students in using the environment. [H-SICAS]
•
Integrating a tutoring system model, for guiding novices through problem solving and mainly in getting unstuck and starting devising a solution for a given problem. [ProGuide]
It is clear that several advances have emerged in the area of programming environments based on an iconic, flowchartbased notation. These advances are based on technologies that have generally proven useful in the area of programming, but have not adequately been evaluated in the context of the specific kind of programming environments. Research on this area is required in order to shed light on the true didactic and pedagogical value of flowchart-based programming environments in introducing novices to programming. Furthermore, it would be interesting to devise an environment that integrates the advanced features that appear in different environments in a way that the environment does not lose its simplicity. Such an environment should definitely support the procedural and object-oriented programming paradigms, allow for step by step execution and automatic generation of syntactically correct source code in various modern production programming languages, as is the case in RAPTOR. Moreover, it could incorporate the ability for collaborative activities and distributed pair programming and ideally run on the web and why not on mobile devices that are currently part of students’ everyday life. Moreover, it would be interesting to investigate at what degree the environments presented could be used for introducing novices to other fields, concepts and models of software engineering in addition to programming. RAPTOR,
which is the most complete environment of this kind, could be used for devising special hands-on activities for familiarizing students with various software engineering topics in a simplified manner. For example, an activity for presenting the importance of software design could be devised. In introductory programming courses, due to the various difficulties confronted by students and time restrictions, it is a usual phenomenon to assign programming activities that focus on implementation issues, rather than on a rigorous and careful design of the solution. Students tend to start writing code as long as they get an assignment, without thinking much about it – a process that usually leads to poorly designed code even for simple problems and poor programming practices in the long term. Assigning a problem that is appropriately complex and demands designing its solution is extremely important. Students must understand that when they have come up with a good design, coding is much simpler. This is perfectly shown in RAPTOR where a well-designed flowchart is automatically translated to various programming languages – the most important factor in designing a solution to a problem is conceiving it and not thinking of it in the context of the programming language used for implementing it. As for the problems that can be assigned for this purpose the possibilities are numerous. For example, a game that would probably attract students’ attention could be assigned, such as tic-tac-toe or pacman included in compiled versions in RAPTOR. Other activities could focus on the following issues: • Necessity for software testing: taking into advantage the program animation and automatic variables update features of RAPTOR. •
Utilization of UML diagrams: for presenting in a concise and clear manner the overall design of a multiple-class solution to a problem using the objectoriented design paradigm, as well as for providing the skeleton for moving to coding afterwards.
•
Synergy of programming paradigms: taking into advantage the ability of RAPTOR to design an objectoriented solution to a problem using a UML class diagram and afterwards the imperative paradigm for defining each method.
Currently, RAPTOR has been utilized for designing flowcharts for a web site used for providing supplementary material for standalone study by students attending an Introductory Programming course at the Department of Technology Management, University of Macedonia, Greece [45]. The material contains a set of exemplary solved exercises using multiple representations – pseudo-code, flowchart, program in C – along with methodology for solving similar problems. Our goals for further research include both evaluating the didactic value of the material already prepared and devising activities like the ones briefly described for presenting students with other software engineering topics as well in a simplified and straightforward manner. REFERENCES [1]
D. Harel, “Statecharts in the making: a personal account”, Commun. ACM , vol. 52(3), pp. 67-75, March 2009.
[2] [3]
[4]
[5]
[6]
[7]
[8]
[9]
[10]
[11] [12]
[13]
[14]
[15]
[16]
[17]
[18]
[19] [20] [21]
[22]
M. S. Hall, “Raptor: nifty tools”, J. Comput. Sci. Coll., vol. 23(1) pp. 110-111, Oct. 2007. B. Shneiderman et al., “Experimental Investigations of The Utility of Detailed Flowcharts in Programming”, Communications of the ACM, Vol. 20, No. 6, pp. 373-381, 1977. S. Xinogalos and M. Satratzemi, “Introducing Novices to Programming: a review of Teaching Approaches and Educational Tools.”, Proc.2nd Int. Conf. Education and Information Systems, Technologies and Applications, Orlando, Florida, USA, Vol. 2, 2004, pp. 60-65. I. Schagaev, T. Kaegi and J. Gutknecht, "ERA: Evolving Reconfigurable Architecture," Proc. 11th ACIS Int. Conf. Software Engineering, Artificial Intelligence, Networking and Parallel/Distributed Computing, 2010, pp. 215-220. A. A. Khwaja and J. E Urban, “Syntax-directed Editing Environments: Issues and Features”, Proc. 1993 ACM SIGGAP symposium on Applied Computing, 1993, pp.230-237. P. Miller et al., “Evolution of Novice Programming Environments: the Structure Editors of Carnegie Mellon University”, Interactive Learning Environments, vol. 4, no 2., pp.140-158, 1994. B. Calloni. and D. Bagert, “Iconic Programming in BACCII vs. Textual Programming: which is a better learning environment?”, ACM, SIGSCE ’94 3/94, Phoenix AZ, 1994, pp. 188-192. D. R. Goldenson, “The Impact of Structure Editing on Introductory Computer Science Education: The Results So Far”, SIGCSE Bulletin, Vol. 21, No. 3, pp. 26-29, Sept. 1989. B. Calloni and D. Bagert, “Iconic Programming Proves Effective for Teaching the First Year Programming Sequence”, ACM SIGSCE ’97 CA, USA, 1997, pp. 262-266. T. Crews and U. Ziegler, “The Flowchart Interpreter for Introductory Programming Courses.”. Proc. FIE ’98 Conference, 1998, pp. 307-312. U. Ziegler and T. Crews, “An Integrated Program Development Tool for Teaching and Learning How to Program”, ACM, SIGSCE ’99 3/99 New Orleans, LA, USA, 1999, pp. 276-280. B. Price, R. Baecker & I. Small, “An Introduction to Software Visualization”, In Software Visualization: Programming as a multimedia Experience, Stasko, J., Domingue, J., Brown, M. and Price, B., Eds. MIT Press, Cambridge, 1997, pp. 3-28. R. Baecker, “Sorting Out Sorting: A Case Study of Software Visualization for Teaching Computer Science”, In Software Visualization: Programming as a multimedia Experience, J. Stasko, J. Domingue, M. Brown & B. Price (Eds), MIT Press, Cambridge, 1997, pp. 369-381. M. Birch et al., “DYNALAB: A Dynamic Computer Science Laboratory Infrastructure Featuring Program Animation”, ACM SIGSCE Bulletin, Vol. 27, No. 1, pp. 29-33, 1995. J. Bergin et al., “An overview of visualization: its use and design Report of the Working Group on Visualization”, ACM SIGCSE Bulletin, Vol. 28, Issue SI, pp. 192-200, 1996. D. Scanlan, “Structured flowcharts outperform pseudocode: an experimental comparison”, IEEE Software, Vol 6, No 5, pp. 28-36, Sept. 1989. M. Carlisle et al., “RAPTOR: A Visual Programming Environment for Teaching Algorithmic Problem Solving”, ACM SIGCSE ’05, 2005, pp. 176-180. Visual Logic 2.2.4. [Online]. Available: http://www.visuallogic.org T. Watts, “The SFC Editor a graphical tool for algorithm development”, J. Computing Sciences in Colleges, vol. 20, Issue 2, pp. 74-85, 2004. M. Carlisle et al., “RAPTOR: Introducing programming to non-majors with flowcharts”, J. Computing Sciences in Colleges, Vol. 19, Issue 4, pp. 52-60, 2004. M. Carlisle, “Raptor: a visual programming environment for teaching object-oriented programming”, J. Comput. Small Coll., vol. 24, 4, pp. 275-281, April 2009.
[23] J. Giordano and M. Carlisle, “Toward a more effective visualization tool to teach novice programmers”, Proc. 7th Conf. Information Technology Education, 2006, pp. 115-122. [24] NClass. [Online]. Available: http://nclass.sourceforge.net [25] M. Marcelino et al., “Using a computer-based interactive system for the development of basic algorithmic and programming skills”, Proc. 5th Int. Conf. Computer Systems and Technologies. ACM, New York, NY, USA, 2004, pp. 1-6. [26] Á. Santos et al., “Integrating New Technologies and Existing Tools to Promote Programming Learning”, Algorithms, 3(2), pp.183-196, 2010. [27] António José Mendes et al., “Using simulation and collaboration in CS1 and CS2”, ACM SIGCSE Bull,. 37, 3, pp. 193-197, 2005. [28] M. Marcelino et al., “H-SICAS, a handheld algorithm animation and simulation tool to support initial programming learning”, 38th Annual Frontiers in Education Conf., 2008, pp. T4A-7 - T4A-12. [29] A. Mendes and M. Marcelino, “Tools to support initial programming learning”, Int. Conf. Computer Systems and Technologies, 2006, pp. IV.16-1 –I.V.16-6. [30] C. Areias and A. Mendes, “A tool to help students to develop programming skills”, Proc. 2007 Int. Conf. Computer systems and technologies, ACM, New York, NY, USA, 2007, Article 89, 7 pages. [31] C. M. Areias et al., “Learning to program with ProGuide”, Proc. Int. Conf. Engineering Education , Coimbra, Portugal, 2007. [32] A. Cilliers et al., “The effect of integrating an Iconic Programming Notation into CS1”, Proc. ACM ITiCSE 2005, 2005, pp. 108-112. [33] S. Chen and S. Morris, “Iconic programming for flowcharts, java, turing, etc.”, Proc. 10th SIGCSE Conf. Innovation and technology in computer science education , ACM, New York, NY, USA, 2005, pp. 104-107. [34] P. Brusilovsky, “Program Visualization as a Debugging Tool for Novices”, Proc. ACM INTERACT ’93 and CHI ’93 Conf. companion on Human factors in computing systems, 1993, pp.29-30. [35] S. Xinogalos et al., “An Introduction to object-oriented programming with a didactic microworld: objectKarel”, Computers & Education, Volume 47, Issue 2, Elsevier Publishers, pp. 148-171, Sept. 2006. [36] A. Scott et al., “Progranimate - A Web Enabled Problem Solving Application”, CSREA EEE 2008, 2008, pp. 498-508 [37] A. Scott et al., “E-Learning For Novice Programmers - A Dynamic Visualisation and Problem Solving Tool”, 3rd Int. Conf. Information and Communication Technologies: From Theory to Applications, ICTTA 2008, 7- 11 April, Damascus – Syria, pp. 1-6. [38] Emanuel de Jesus. 2011, “Teaching computer programming with structured programming language and flowcharts”, Proc. 2011 Workshop Open Source and Design of Communication, ACM, New York, NY, USA, 2011, pp.45-48. [39] S. Xinogalos et al., “Recent advances delivered by HTML 5 in mobile cloud computing applications: a survey”, Proc. 5th Balkan Conf. Informatics (BCI '12), ACM, New York, NY, USA, 2012, pp. 199-204. [40] A. Manso et al., “Portugol IDE v3.x- A new environment to teach and learn computer programming’, Proc. IEEE Engineering Education 2010, Madrid, Spain, 14-16 April 2010, pp. 1007-1010. [41] Portugol IDE. [Online]. Available: http://www.dei.estt.ipt.pt/portugol [42] Visual Flowchart. [Online]. Available: http://www.ecedu.upatras.gr/flowchart [43] Flowchart. [Online]. Available: http://users.sch.gr/vraa8/index.php?option=c%20om_content%20&view =article&id=2&Itemid=4 [44] A. Scott et al., “A Step Back From Coding- An Online Environment and Pedagogy for Novice Programmers”, Proc. 11th Java in the Internet Curriculum Conf., The Higher Education Academy, London Metropolitan University - UK, 2007, pp. 35-41. [45] S. Xinogalos, “Programming Techniques and Environments in a Technology Management Department”, Proc. 5th Balkan Conf. Informatics (BCI 2012), 16-20 September, Novi Sad, Serbia, ACM, New York, NY, USA, 2012, pp. 136-141.