GRA and profitability theory for better prioritization of the service failures by ...
cost as an important issue and using the profitability theory in a way that the ...
________________________________ Using Fuzzy Cost-Based FMEA, GRA and Profitability Theory for Minimizing Failures at a Healthcare Diagnosis Service Samira Abbasgholizadeh Rahimi Afshin Jamshidi Daoud Ait-Kadi Angel Ruiz
October 2013
CIRRELT-2013-61
Document de travail également publié par la Faculté des sciences de l’administration de l’Université Laval, sous le numéro FSA-2013-011.
Bureaux de Montréal :
Bureaux de Québec :
Université de Montréal C.P. 6128, succ. Centre-ville Montréal (Québec) Canada H3C 3J7 Téléphone : 514 343-7575 Télécopie : 514 343-7121
Université Laval 2325, de la Terrasse, bureau 2642 Québec (Québec) Canada G1V G1V0A6 0A6 Téléphone : 418 656-2073 Télécopie : 418 656-2624
www.cirrelt.ca
Using Fuzzy Cost-Based FMEA, GRA and Profitability Theory for Minimizing Failures at a Healthcare Diagnosis Service Samira Abbasgholizadeh Rahimi1,2, Afshin Jamshidi1,2, Daoud Ait-Kadi1,2, Angel Ruiz1,3,* 1
Interuniversity Research Centre on Enterprise Networks, Logistics and Transportation (CIRRELT)
2
Department of Mechanical Engineering, 1065, avenue de la Médecine, Université Laval, Québec, Canada G1V 0A6
3
Department of Operations and Decision Systems, 2325, de la Terrasse, Université Laval, Québec, Canada G1V 0A6
Abstract. This paper proposes an integrated approach to identify, evaluate, and improve the potential failures in a service setting. This integrated approach combines FCS-FMEA, GRA and profitability theory for better prioritization of the service failures by considering cost as an important issue and using the profitability theory in a way that the corrective actions costs are taken into account. Considering profitability with FCS-FMEA and GRA reduces the losses caused by failure occurrence. Besides, a maximization linear mathematical problem is used to select the best mix of failures to be repaired. We apply our approach to an academic example concerning the potential failures diagnosis of the Internal Medicine service of a hospital located in Seoul, Korea. We applied our approach and solved the associated maximization problem by a commercial solver, producing an optimal solution which indicates the most convenient mix of failures to be repaired by considering available budget. Keywords. Service failures, FMEA (Failure Modes and Effects Analysis), GRA (Grey Relational Analysis), PC-FMEA (Priority Cost-Failure Modes and Effects Analysis). Acknowledgements. This research was partially financed by grants OPG 0293307 and OPG 0118062 from the Natural Sciences and Engineering Research Council of Canada (NSERC). This support is gratefully acknowledged. Results and views expressed in this publication are the sole responsibility of the authors and do not necessarily reflect those of CIRRELT. Les résultats et opinions contenus dans cette publication ne reflètent pas nécessairement la position du CIRRELT et n'engagent pas sa responsabilité.
_____________________________ * Corresponding author:
[email protected] Dépôt légal – Bibliothèque et Archives nationales du Québec Bibliothèque et Archives Canada, 2013 © Copyright Rahimi, Jamshidi, Ait-Kadi, Ruiz and CIRRELT, 2013
Using Fuzzy Cost-Based FMEA, GRA and Profitability Theory for Minimizing Failures at a Healthcare Diagnosis Service
1. Introduction Failure analysis (FA) is the process of collecting and analyzing data to determine the cause of a failure. The major concern of FA is to emphasize the prevention of problems linked to the proactive treatment of the system rather than finding a solution after the failure occurs 1. FA is particularly interesting in service systems, because failures are directly linked to loyalty destruction 2, customer dissatisfaction and negative word of mouth 3,4,5, or customer defection 6,7. The most popular methodology dealing with this FA is FMEA, the Failure Modes and Effects Analysis 8. FMEA is an inductive failure analysis for analysis and classification of potential failure modes (FM) based on the severity and likelihood of the failures. It provides therefore a systematic approach for identifying potential failures before they occur 9. FMEA has been widely used in various manufacturing areas as a solution to many reliability problems
10,11,12
. However,
the main literature regarding FMEA is still devoted to manufacturing applications, neglecting the increasing importance of service areas 8. Nonetheless, several applications of FMEA in the service context have been proposed in the last years, proposing some generic guidelines to apply FMEA to service applications 1, applying FMEA to the service context
13
and applying a
systematic approach to manage the service failures using a service-specific FMEA (S-FMEA) and Grey Relational Analysis, GRA 8. GRA is a method for decision making, which is suitable for solving problems with complicated interrelationships between multiple factors and variables 14
. It is a simple and data-driven method useful for making decisions by analyzing various
relationships 15. Despite these attempts, traditional FMEA still shows some drawbacks. In particular, no attention is paid to the economic aspects of service failures. Also, it is not possible to consider various experts’ ideas. Even S-FMEA, that seems to be more realistic in identifying service failures, doesn’t cover these disadvantages appropriately. In this context, this paper proposes a Fuzzy cost-based service-specific FMEA (FCS-FMEA) which uses GRA and Profitability theory for diagnosing service failures. To overcome some shortcomings of cost associated with service failures, in this paper at the first step, the estimated cost of faults based on each expert’s idea is employed to evaluate each factor of Risk Priority Number (RPN). The RPN is the product of S (severity), O (occurrence) and D (detection) and is often used to determine the relative risk of a FMEA.
CIRRELT-2013-61
1
Using Fuzzy Cost-Based FMEA, GRA and Profitability Theory for Minimizing Failures at a Healthcare Diagnosis Service
In addition, different weights are assigned to each expert’s idea based on their experience and knowledge. Also, weights are assigned to RPN factors to consider cost and time criteria. Then, following the S-FMEA methodology, the risk priorities of each FM are evaluated using GRA to highlight the multilateral perspective of S-FMEA. Finally, by using profitability theory, taking into consideration the corrective action cost and using the simplex algorithm, we have found an optimal mix of faults to be repaired. To summarize, the proposed approach suggests how to adapt FC-FMEA to incorporate the service characteristics, together with how to prioritize the FMs in a service setting using profitability evaluation. To illustrate the application procedure and effectiveness of our integrated approach, a numerical example is illustrated based on case study in Geum et al. 8. This paper concludes with a discussion on the major contribution and limitations of this work, as well as recommendations for future studies.
2. Service failure A service failure is defined as service performance that falls below a customer’s expectations
16
.
Because of the many uncontrollable factors surrounding a service delivery, service failures appear to be inevitable 3. It is very important for the service designer to identify the potential service failures and take the required actions in advance to prevent the failure from occurring. Meanwhile, and because of the limited resources, the service designer should prioritize the potential service FMs in order to take the preventive actions before the service is delivered 13. Service failure generally encompasses any problematic situation during service while service is delivered to a customer, causing significant damage to customer satisfaction
6,17,18
. Whether
customers are satisfied or not depends on their perception of the service provided in comparison with their expectations. It is assumed that service failures lead to dissatisfaction. While some failures do not impact the customer's well-being and do not result in financial loss, others may have severe consequences. The acceptability of service failure is influenced by the criticality of the service provided and by the magnitude of the failure. Satisfaction with the service will be lower if the acceptability of the failure is lower 3. Service failures may vary considerably across the dimensions of timing, severity, and frequency19. They can occur anytime during the customer’s relationship with a service provider. Since service failure is closely related to the customers, its significance can vary between customers. The perceived significance of service failure is also different depending on the
2
CIRRELT-2013-61
Using Fuzzy Cost-Based FMEA, GRA and Profitability Theory for Minimizing Failures at a Healthcare Diagnosis Service
circumstances. Some service failures are more serious than others, for example, serving the wrong soft drink is trivial in comparison to administering the wrong medication, showing high severity in the hospital service 8. Also, a service failure can be treated differently depending on the industry. For example, in healthcare services, inaccurate appointment is negligible in comparison to inaccurate medication. Therefore, managers who are in charge of failure management or service quality management should measure the severity of service, providing different actions to service failures. Nevertheless, the occurrence or frequency of failure should be measured to provide different actions to each failure, since it is also linked with the triviality of service failures 8. Preventing service failure from happening, or in other words, identifying service failure in advance, is a very important job in the service sector despite being difficult to achieve 8. The greatest barrier to identifying service failure is the fact that only 5% to 10% of unsatisfied customers choose to complain following a service failure. Instead, most of them silently switch providers or attempt to get even with the firm by making negative comments to others
20
. As a
result, identifying failures in a service setting should be thoughtfully investigated prior to its emergence. The methodology dealing with this problem is FMEA. The next section explains the principles of FMEA.
3. Failure Mode and Effects Analysis FMEA is a reliability analysis tool widely used in the manufacturing sectors, such as automotive, aerospace, and electronics industries, to identify, prioritize, and eliminate known potential failures, problems, and errors from systems
13
. The goal of FMEA is to predict how and where
systems that were designed to detect errors and alert staff might fail
21
. The FMEA process is
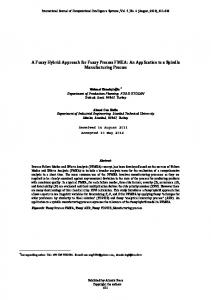
depicted in Figure 1. FMEA procedure starts with determining all potential FMs of the system. Following determination, all possible effects, causes, and current control process are identified. In order to quantify this procedure, RPN is used, which is the multiplication of severity of failure S, their probability of occurrence O, and possibility of detection D. The RPN number is used to determine the risk of potential failures and prioritize the needed preventive actions and the resource allocations before the service is delivered
13
. Since the main goal of FMEA is to find,
prioritize, and minimize the failure, it has been widely used in various manufacturing areas, helping reliability-related problems 10,11,12.
CIRRELT-2013-61
3
Using Fuzzy Cost-Based FMEA, GRA and Profitability Theory for Minimizing Failures at a Healthcare Diagnosis Service
Figure 1. FMEA process.
In the recent decades, the scope of FMEA has started to be extended and applied to the service sector 15. Service FMEA was proposed, together with system FMEA, design FMEA, and process FMEA 1, providing the generic guidelines required to apply it to the service setting. In addition, various methods to integrate the customer’s needs are mentioned such as benchmarking, quality function deployment, market research, and focus groups. Another approach was proposed to combine service blueprint and FMEA in order to provide reliability control in a service setting 13. Recently, S-FMEA was proposed, together with GRA 8. Much debate has taken place regarding risk prioritization
22,23
which is related to the
appropriateness of the relation, consideration of different impacts of S, O, and D in risk implication, and the appropriateness of multiplication 22. In order to cope with these problems, a number of researches have been conducted to provide more multilateral consideration for prioritization such as fuzzy logic
22,24,25,26
, grey theory
28
8,22,25,27
, life cost-based analysis
10
,
9
Analytic network process (ANP) , and Analysis Of Variance (ANOVA) . Despite these attempts, previous works don’t cover all the disadvantage of service FMEA. For example, no attention is still paid to economic aspects of service-specific failures. In addition, there is no attention to consider various experts’ ideas and so on. Since S-FMEA seems to be more realistic among other integrating methods in identifying service failures, our proposed
4
CIRRELT-2013-61
Using Fuzzy Cost-Based FMEA, GRA and Profitability Theory for Minimizing Failures at a Healthcare Diagnosis Service
method will be based on this approach. Then, in the next section for better understanding of our proposed method, S-FMEA based on Geum et al.’s method 8 will be explained briefly. 3.1. Service-specific failure mode and effects analysis The characterizing variable of traditional FMEA consists of three factors: S, O, and D. However, risk in a service setting cannot be measured by a simple judgment due to the inherent intangibility of services. Therefore, Geum et al. extended the traditional 3 dimensions in FMEA by adding 19 sub-dimensions, as shown in Table 1. Table 1. Key considerations for each constituent for risk priority (Geum et al., 2011). Dimension
Criteria Basic
Customer
S Process
O
Sub-dimension Impact
Description How much the impact of failure is
Core process
How much the customer considers it a core process
Typicality
How typical the failure is
Affected range
How broad the affected range is
Customer participation
How much the customer participates in the service process
Customer contact
How closely the failure process contacts the customer
Service encounter
How closely the failure process is located to the service encounter
Interdependency
How closely the process is linked with other processes
Bottleneck possibility
How possible is it that this process works as a bottleneck
Hardness of isolation
How possible that this process can be isolated
Resource distribution
How much the process occupies the resources
Frequency
How frequently the failure happens
Repeatability
Does the failure happen repeatedly
Failure visibility
Is the failure visible to the customer or not
Single point failure
Does the system fail if a single service failure occurs
Chance of nondetection
D
CIRRELT-2013-61
How severe is the failure detected
Method of systematic detection
Does the periodical and systematic method exist for detection
Customer/Employee detection
Is the failure detected by employees or customers
Hardness of proactive inspection
How the failure modes can be inspected proactively
5
Using Fuzzy Cost-Based FMEA, GRA and Profitability Theory for Minimizing Failures at a Healthcare Diagnosis Service
Note that some dimensions should be considered in reverse scale, since the main objective of these criteria is to prioritize the risk. Therefore, the higher the score of the individual dimension, the more hazardous the FM should be. This is the reason why some sub-dimensions are defined as the inverse of the original ones; for example, the isolation possibility is measured by the difficulty of isolation. Similarly, controllability is measured by difficulty of control, and customer intolerance is used as the measure of how customers are tolerable 8. The genuine preventive characteristic of FMEA lies in that it identifies all potential FMs in a system and prioritizes them in a systematic manner, prior to the outbreak of failure. The preventive efforts of FMEA still remain in S-FMEA, because the main activities for conducting FMEA are identical to the traditional FMEA. In the next section, Utility Theory (UT) and Fuzzy Utility Theory (FUT) will be introduced.
4. Utility Theory (UT) and Fuzzy Utility Theory (FUT) based Failure Mode and Effects Analysis Dimensions S, O and D determine the failure cost, and they can be seen as cost drivers in the context of UT. UT is an attempt to infer subjective value, or utility, from choices. In this case, each cost driver is ranked from 1 to 10. Cost values are converted into utility values by dividing the cost value of the highest level for each cost driver, i.e. 29: (1) FMEA involves normally a team effort in which several experts contribute. During the early product development stage, for example, the effects of potential FMs are not very clear. Thus, different opinions will arise in ranking and evaluating them. In order to account for the differences between experts, we use FUT. In FUT, the utility values are expressed by membership functions instead of real numbers. The cost value for level i given by expert j is denoted as
(i = 1…10, j = 1… n), where n is the number of experts 29: (2)
The cost and utility values for D can be derived in the same approach as the one shown for severity. The evaluation of O is different from the evaluation of S and D, since the probability of failure is given
29
. These probability values are converted to the utility values using the
expression:
6
CIRRELT-2013-61
Using Fuzzy Cost-Based FMEA, GRA and Profitability Theory for Minimizing Failures at a Healthcare Diagnosis Service
(3) Where
is the probability that a FM occurs. In previous works,
and
have been defined
as: ⁄∑
(4)
⁄∑
(5)
where i = 1, 2, 3 …, n corresponds to the expert number, j = 1, 2, 3, … (FMs) and
is the
failure event probability. Benefits of this modification are that it produces normalized numbers, it is not time consuming and working with these new functions is very easy and there is no need to draw utility values diagram D and S. It should be mentioned that particular weights can be assigned to experts based on their experience and knowledge. Weights should be in the zero to one interval and total weights for all experts should sum one. In addition, a pairwise comparison among S, O and D has been done to obtain the comparison matrix. After assigning weights for each expert and each dimension, we have the new fuzzy membership function called RPI 24: (
)
√
(
∑
)
(
)
In the following, this equation will be applied to the case study in
( 8
∑
)
(6)
to consider RPI factors in
cost terms and assign weights to each expert based on their knowledge. After that, we will use grey analysis relational theory to obtain risk score for each dimension. Finally, we will use profitability evaluation to choose the optimum mix of failures to be repaired.
5. Grey relational analysis (GRA) as a tool for risk prioritization In this section, a new integrated method for risk prioritization is introduced with the help of GRA and our proposed new membership function. Contrary to the traditional FMEA which consists of only three dimensions, S-FMEA has multiple sub-dimensions describing each dimension, and showing the complicated relationships between them 8. Therefore, a GRA characterized by multiple criteria in a complicated decision making interrelated situation, is proposed to solve this problem. Unlike the previous studies, application of GRA in this paper consists of a two-phase
CIRRELT-2013-61
7
Using Fuzzy Cost-Based FMEA, GRA and Profitability Theory for Minimizing Failures at a Healthcare Diagnosis Service
application in order to highlight the multilateral perspective of S-FMEA. The first phase deals with the calculation of risk score for each dimension, and the second phase covers the calculation of overall risk priority by using Equation (6). In the first phase, the risk score for each dimension is calculated and referred to as S score, O score, and D score respectively. These scores are then used as the inputs to the second phase, where the final risk priority is computed. Section 5.1 illustrates the calculation of risk score for each dimension whereas section 5.2 covers the calculation of the overall risk score. 5.1. The calculation of risk score for each dimension Step 1. Calculating the comparative series for FMs for each dimension. As the first stage, all values for each FM are processed into a comparability sequence. If there are m FMs and n attributes in a dimension, the ith FM can be expressed as a comparative series ) as below 8.
(
{
( {
(
})
}) (
{
{
})
}
{
(7)
}
Step 2. Setting the reference sequence (standard series) definition. Since the FMs with higher value should be selected, the reference set should be set as: =(
,
,...,
) = (1, 1, 1, . . . , 1).
Step 3. Calculating the grey relational coefficient for each dimension. This step is used for determining how close
is to
. The larger the coefficients, the closer
the distinguishing coefficient,
and
. Let be
, which affects the relative value of risk without
changing the priority. The relational coefficient can be expressed as: (
(8)
)
where :
( )
is the standard series, and |
( ) is
the comparative series,
| { {
} }
is usually set to 0.5 28.
8
CIRRELT-2013-61
Using Fuzzy Cost-Based FMEA, GRA and Profitability Theory for Minimizing Failures at a Healthcare Diagnosis Service
Step 4. Calculating the grey relational grade (the risk score): Using the weighting coefficient of the decision factors, the final grey relational grade is calculated according to: ( where
)
∑
(
for i = 1,..., m
)
is the weighting coefficient of factors, and ∑
(9) .
Therefore, scores for each dimension can be obtained using the grey relational grade framework as shown in Table 2. Table 2. Risk scores for each dimension. Dimension S score O score D score
In Table 2, (
Grey relational grade (Risk score) Γ( , ) =∑ ( ) for i = 1, 2, . . . ,m ( : Total number of attributes for S dimension) Γ( , ) =∑ ( ) for i = 1, 2, . . . ,m ( : Total number of attributes for O dimension) Γ( , ) =∑ ( ) for i = 1, 2, . . . ,m ( : Total number of attributes for D dimension)
) is the grey relational grade between
and x, representing the level of
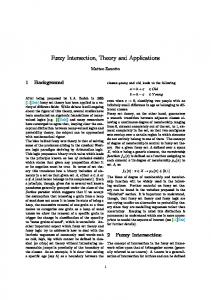
correlation between the reference sequence and the comparability sequence. It means that if the degree of relation is stronger, this FM is more risky, and is thus prioritized as the urgent one. Until now, the risk score of each dimension is evaluated. After calculating scores for each dimension, the overall risk score can be calculated under the framework of profitability theory. 5.2. The calculation of overall risk score using profitability evaluating 5.2.1. The profitability evaluation After finding the risk scores for each dimension in the previous step, in order to consider economic aspects in prioritizing of the failures we use profitability theory. Figure 2 reports a complete framework to evaluate profitability.
CIRRELT-2013-61
9
Using Fuzzy Cost-Based FMEA, GRA and Profitability Theory for Minimizing Failures at a Healthcare Diagnosis Service
Figure 2. The profitability evaluation framework. In calculating the fault profitability, the corrective action cost is evaluated by means of the following relation: (10) where,
is the personnel cost per hour,
the hours spent for each activity,
related to the improvement of medical devices, and
is the cost
encompasses all the other costs associated
to the improvement action. 5.2.2. The priority–profitability diagram At this point a given priority and a given potential profitability are associated with each fault. We draw a graph where the abscissa represents the FM priority, evaluated with the new RPI, while the ordinate represents the profitability. The points in this graphic are the single FMs and their disposition in the quadrant provides information about their priority, economic opportunities of intervention and advantages. Then a straight line passing through the origin, and called strategy straight line, can be drawn. The straight line slope indicates the adopted planning policy and expresses the expected relation between the action urgency and the economic convenience intervention. To identify this slope, 30 stated the policy into four fundamental terms : 1. PR: This term expresses the trend of an organization to accept one or more unconformities. 2. SR: This term expresses the trend of an organization to accept rejects (internal unconformities).
10
CIRRELT-2013-61
Using Fuzzy Cost-Based FMEA, GRA and Profitability Theory for Minimizing Failures at a Healthcare Diagnosis Service
3. PT: It expresses the trend of an organization to make a profit; it shows how profit is important in the organization policy. 4. IL: This term reveals the trend of an organization to risk its own image on the market. In fact, there is a correlation between a potential FM prevention and the organization image. To each element of the adopted planning policy is attributed a score from 1 to 10 depending on the preference of the manager. After attributing a score to the four elements, the value M is given by: [
(11)
]
The obtained score is then turned into the slope of the strategy straight line (t) using a conversion relation. If the organization decides to assign more importance to fault criticality, the straight line will have a low slope. On the other hand, if profitability is assumed to be more important, higher slopes are obtained. See
30
for detailed explanation of this process.
5.2.3. Failure classification The strategy straight line defines a local coordinate, on whose basis we create a classification of the considered faults in the FMEA analysis. This coordinate is the distance from the axes origin to the projection points on the line indicating the failures, called Critical Index
30
and is
calculated by: √ where
(
)
is the Critical Index of generic fault j,
(12)
is the profitability of generic fault j,
is
the risk priority index of generic fault j, and m is the strategy straight line's slope. Since the RPI is dimensionless, we need to normalize the profitability values before calculating the
. Then,
we calculate a score for each potential design fault, which identifies its priority, and at the same time we calculate another score, which identifies the profitability in accomplishing the correct actions. All the potential failures are considered through priority and profitability criteria. Furthermore, we use an algorithm of optimization to choose the optimum mix of failures to be repaired taking into account the firm budget as a bound for the execution of corrective actions.
CIRRELT-2013-61
11
Using Fuzzy Cost-Based FMEA, GRA and Profitability Theory for Minimizing Failures at a Healthcare Diagnosis Service
6. Optimal mix of failure selection As a matter of fact, not all the failures can be repaired or avoided due to the limited available budget allocated to corrective actions. Only a specific mix of FMs can be modified according to the available budget. Therefore, we propose to use an optimization model to find the optimal mix of faults to be repaired maximising the sum of their C.I., in such a way that the firm budget is respected. The optimization problem is formulated as follows 30: Max. ∑ s.t. ∑
Budget {
(13)
}
where j is a generic fault,
takes the value 1 if the action is selected and 0 otherwise, C.I. is the
Critical Index of the j-th fault. Needless to say, Budget is the available budget for the corrective actions.
7. Numerical example In this section, a numerical example proposed by Geum et al. 8 is used to illustrate the proposed approach. The example in
8
concerns the potential failure diagnosis for a hospital located in
Seoul, Korea. The activities or the tasks performed in a hospital might be quite different depending on the specific department. In particular, Geum et al. elected the department of internal medicine since it has a high level of interaction between customers and staff. 7.1. Construction of service-specific FMEA Considering the hospital service, S-FMEA is constructed. Firstly, FMs are identified and listed. 5 FMs were identified in this numerical example. The identification of FMs includes the possible errors which might occur during the service delivery process. Table 3 shows the list, types and characteristics of the FMs used by Geum et al 8. Each RPI factor is estimated based on a 1 to 10 scale 29. Assigned ranks for each RPI factor, according to the opinions of five experts (identified by Eng 1 to Eng 5), are shown in Table 4. These numbers were thrown from a discrete uniform distribution within the interval [1,10]. Cost values provided by the 5 experts for dimensions S and D are given in Figure 3. Costs to severity functions in Figure 3 were suggested in 24.
12
CIRRELT-2013-61
Using Fuzzy Cost-Based FMEA, GRA and Profitability Theory for Minimizing Failures at a Healthcare Diagnosis Service
Table 3. FMs in the Internal Medicine case.
FM3
FM Inaccurate checkin No availability of doctor Long waiting time
FM4
Order forgotten
FM5
Wrong prescription
FM1 FM2
Type Wrong employee actions Service delivery system failures Service delivery system failures Wrong employee actions Wrong employee actions
Description Incorrect reservation, inaccurate prioritization Long doctor consultation, inaccurate allocation of customers Unexpected arrival of customer, long processing time Inaccurate allocation of customers Wrong prescription due to a mistake, Wrong communication between doctor and nurse
Cost value for S 100
Cost
80 Expert 1
60
Expert 2 40
Expert 3
20
Expert 4
0
Expert 5 1
2
3
4
5
6
7
8
9
10
Severity Rank
Cost value for D 30
Cost
25 20
Expert 1
15
Expert 2
10
Expert 3 Expert 4
5
Expert 5
0 1
2
3
4
5
6
7
8
9
10
Detection Rank
Figure 3. Cost values given by experts to S and D.
CIRRELT-2013-61
13
Using Fuzzy Cost-Based FMEA, GRA and Profitability Theory for Minimizing Failures at a Healthcare Diagnosis Service
Table 4. Assigning ranks for each RPI factor. FM
1
2
3
4
5
Eng
S1
S2
……
S11
O1
O2
O3
O4
D1
D2
D3
D4
1 2 3 4 5 1 2 3 4 5 1 2 3 4 5 1 2 3 4 5 1 2 3 4 5
6 8 5 6 7 10 10 9 8 9 5 3 4 4 3 7 8 7 6 7 10 9 9 8 9
5 4 3 4 3 4 6 5 6 5 6 5 7 6 6 5 6 6 5 4 10 10 10 10 9
…… …… …… …… …… …… …… …… …… …… …… …… …… …… …… …… …… …… …… …… …… …… …… …… ……
5 4 3 3 5 9 8 8 7 8 5 6 7 7 6 9 7 8 8 7 8 9 8 9 7
8 7 8 7 6 7 7 7 7 7 10 9 8 9 10 9 10 8 10 9 2 3 3 4 8
3 2 3 4 2 10 10 9 9 10 9 9 8 9 10 10 9 8 9 10 8 9 10 9 8
7 8 9 9 7 9 9 9 9 9 10 6 7 6 10 7 8 9 10 9 8 9 9 9 8
3 2 3 1 2 1 2 2 2 3 8 10 9 9 10 7 8 6 7 8 4 5 5 4 4
10 10 10 10 9 10 9 9 9 5 8 10 9 8 8 10 8 10 9 9 4 7 2 5 7
9 9 10 9 9 8 7 7 3 6 9 9 8 7 7 3 5 4 4 3 2 2 1 2 3
5 8 8 7 5 8 6 7 7 7 7 7 6 5 6 5 4 5 4 3 10 9 8 8 7
4 6 2 7 1 9 6 9 9 7 3 7 6 5 6 4 6 4 5 6 3 3 1 2 1
Using values in Table 4 and costs-to-severity functions from Figure 3, we evaluate costs (see Table 5) for S and D factors according to each expert’s opinion. The value
in Table 5 refers to
the weight of experts’ opinion, which is assigned according to their experience and knowledge. In our case, we set them arbitrarily in such a way that they sum up to 1. Using Equations 3, 4 and 5, cost values for each sub criteria (in Table 5) are converted into utility values (see Table 6). In addition, Table 6 reports the experts’ assignment of weights to utility values of each dimension of RPI. Now we convert the fuzzy membership functions numbers into numerical values. To this end, we used the COM defuzzification method. In the COM defuzzification method, the fuzzy logic controller first determines the typical numerical value for each scaled membership function. The typical numerical value is the mean of the numerical values corresponding to the degree of membership at which the membership function was scaled.
14
CIRRELT-2013-61
Using Fuzzy Cost-Based FMEA, GRA and Profitability Theory for Minimizing Failures at a Healthcare Diagnosis Service
Table 5. Assigning Costs to each RPI factor. FM
1
2
3
4
5
CIRRELT-2013-61
Eng 1 2 3 4 5 1 2 3 4 5 1 2 3 4 5 1 2 3 4 5 1 2 3 4 5
W 0.15 0.2 0.3 0.25 0.1 0.15 0.2 0.3 0.25 0.1 0.15 0.2 0.3 0.25 0.1 0.15 0.2 0.3 0.25 0.1 0.15 0.2 0.3 0.25 0.1
CS1
CS2
……
CS11
O1
O2
O3
O4
CD1
CD2
CD3
CD4
12 25 13 19 24 36 44 40 36 60 10 19 11 13 24 16 25 21 19 24 36 30 40 36 60
10 10 21 13 24 9 16 13 19 18 12 12 21 19 20 10 16 17 16 14 36 44 57 67 60
…… …… …… …… …… …… …… …… …… …… …… …… …… …… …… …… …… …… …… …… …… …… …… …… ……
10 10 21 7 18 24 25 32 22 36 10 16 21 22 20 24 19 32 36 24 20 30 32 50 24
8 7 8 7 6 7 7 7 7 7 10 9 8 9 10 9 10 8 10 9 2 3 3 4 8
3 2 3 4 2 10 10 9 9 10 9 9 8 9 10 10 9 8 9 10 8 9 10 9 8
7 8 9 9 7 9 9 9 9 9 10 6 7 6 10 7 8 9 10 9 8 9 9 9 8
3 2 3 1 2 1 2 2 2 3 8 10 9 9 10 7 8 6 7 8 4 5 5 4 4
16 18 20 22 23 16 16 18 19 11 13 18 18 17 19 16 15 20 19 23 14 12 18 9 16
14 16 20 19 23 13 12 13 5 13 14 16 15 14 16 14 8 13 7 11 14 3 18 3 11
11 15 15 14 11 13 10 13 14 16 11 12 11 9 13 11 7 18 7 11 16 16 15 17 16
14 10 18 14 11 14 10 18 19 16 14 12 11 9 13 14 10 13 9 13 14 4 18 3 11
15
16
5
4
3
2
FM 1
Eng 1 2 3 4 5 1 2 3 4 5 1 2 3 4 5 1 2 3 4 5 1 2 3 4 5
W 0.15 0.20 0.30 0.25 0.10 0.15 0.20 0.30 0.25 0.10 0.15 0.20 0.30 0.25 0.10 0.15 0.20 0.30 0.25 0.10 0.15 0.20 0.30 0.25 0.10 0.019 0.054 0.042 0.051 0.026 0.025 0.041 0.056 0.042 0.028 0.019 0.049 0.043 0.042 0.031 0.023 0.048 0.060 0.045 0.023 0.027 0.030 0.059 0.045 0.030
W*US1 0.009 0.012 0.037 0.019 0.014 0.018 0.043 0.052 0.063 0.024 0.021 0.029 0.075 0.057 0.024 0.021 0.044 0.070 0.055 0.019 0.020 0.033 0.065 0.063 0.023
W*US2 …… …… …… …… …… …… …… …… …… …… …… …… …… …… …… …… …… …… …… …… …… …… …… …… …… …… 0.001 0.002 0.006 0.002 0.002 0.026 0.036 0.069 0.040 0.026 0.017 0.036 0.071 0.062 0.022 0.027 0.028 0.071 0.067 0.018 0.019 0.038 0.062 0.080 0.015
W*US11 0.088 0.100 0.176 0.125 0.043 0.075 0.100 0.150 0.125 0.050 0.150 0.154 0.176 0.192 0.100 0.115 0.200 0.176 0.250 0.077 0.038 0.060 0.091 0.083 0.059
W*UO1 0.045 0.050 0.091 0.083 0.025 0.150 0.200 0.230 0.192 0.100 0.115 0.154 0.176 0.192 0.100 0.150 0.154 0.176 0.192 0.100 0.088 0.154 0.300 0.192 0.059
W*UO2 0.075 0.118 0.230 0.192 0.050 0.115 0.154 0.230 0.192 0.077 0.150 0.087 0.150 0.109 0.100 0.075 0.118 0.230 0.250 0.077 0.088 0.154 0.230 0.192 0.059
W*UO3 0.045 0.050 0.091 0.050 0.025 0.030 0.050 0.075 0.063 0.030 0.088 0.200 0.230 0.192 0.100 0.075 0.118 0.130 0.125 0.059 0.050 0.074 0.111 0.083 0.033
W*UO4 0.024 0.036 0.061 0.056 0.023 0.030 0.040 0.068 0.059 0.014 0.023 0.042 0.064 0.050 0.022 0.026 0.032 0.065 0.051 0.025 0.030 0.035 0.078 0.033 0.023
W*UD1
Table 6. Weights assigned by experts to utility values.
0.023 0.035 0.065 0.052 0.025 0.035 0.043 0.070 0.022 0.023 0.028 0.043 0.060 0.047 0.021 0.040 0.030 0.074 0.033 0.021 0.043 0.012 0.110 0.015 0.022
W*UD2 0.025 0.045 0.068 0.053 0.017 0.030 0.030 0.059 0.053 0.024 0.029 0.043 0.059 0.040 0.023 0.031 0.026 0.100 0.032 0.020 0.030 0.040 0.056 0.053 0.020
W*UD3 0.031 0.030 0.081 0.052 0.016 0.027 0.026 0.070 0.062 0.021 0.036 0.041 0.056 0.038 0.022 0.036 0.034 0.066 0.038 0.022 0.042 0.016 0.108 0.015 0.022
W*UD4
Using Fuzzy Cost-Based FMEA, GRA and Profitability Theory for Minimizing Failures at a Healthcare Diagnosis Service
CIRRELT-2013-61
CIRRELT-2013-61
Rating
17
D
O
S
Characteristics of failure
19.33628 17.29124 17.74371 33.94262 11.55758 54.25649 15.08449 18.76429 13.27118 19.95247 15.87512 7.415009 3.028047 8.447218 2.329245 20.0555 18.7330 13.9454 14.7304
Effect of failure
S1: Impact (5) S2: Core process (5) S3: Typicality (1) S4: Affected range (3) S5: Customer participation (5) S6: Customer contact (1) S7: Service encounter (5) S8: Interdependency (5) S9: Bottleneck possibility (3) S10: Hardness of Isolation (1) S11: Resource distribution (1) O1: Frequency (5) O2: Repeatability (3) O3: Failure visibility (5) O4: Single point failure (1) D1: Chance of undetection (5) D2:Method of systematic detection (3) D3: Customer/Employee detection (5) D4: Hardness of proactive inspection (3)
Giving up the reservation
Cause of failure
FM1 Inaccurate check Communication error
FMs
Giving up the reservation, dissatisfaction 42.36865 15.78 47.83142 22.61437 13.80365 47.10143 18.51221 14.75262 35.50909 18.56893 28.17595 7 9.515818 9 2.000807 17.16024 11.85192 13.17768 16.55837
No existing free doctor
FM2 No availability of doctor
FM3 Long waiting time Wrong planning to reservation Taking long time to checkin 15.67359 18.14195 26.64188 16.25958 17.79414 54.39658 39.7044 33.7543 16.73276 14.12591 19.43236 9.095337 8.896365 7.931799 9.261288 17.29244 14.94628 11.04586 11.59911
Table 7. List of S-FMEA for the Internal Medicine case.
Miscommunication between doctor and nurse
Putting wrong information of reservation Impossible to check the reservation 21.27343 15.55915 16.36845 15.13245 11.31841 38.58727 24.93618 14.36264 16.74843 14.09159 29.83794 9.334311 9.095337 8.976527 7.091196 18.7833 11.22003 13.23011 11.8831
40.06250 56.21735 36.22301 27.55735 17.23531 13.77493 17.46556 19.27408 27.74883 15.78645 36.71038 4.027832 9.193036 8.79668 4.526316 14.63632 14.34675 15.98433 14.20197
Receiving wrong prescription
FM5 Wrong prescription
FM4 Order forgotten
Using Fuzzy Cost-Based FMEA, GRA and Profitability Theory for Minimizing Failures at a Healthcare Diagnosis Service
Using Fuzzy Cost-Based FMEA, GRA and Profitability Theory for Minimizing Failures at a Healthcare Diagnosis Service
The fuzzy logic controller then uses the following equation to calculate a weighted average of the typical values. (14) Where
is the typical numerical value for the scaled membership function n, and
is the
degree of membership at which membership function n was scaled. After defuzzification of Table 6 by COM method, and based on the identified FMs given in Table 3, the CS-FMEA is constructed, as shown in Table 7. The value in parentheses refers to the weight of each dimension. 7.2. Application of grey relational analysis This section illustrates the application of GRA to the numerical example in 8. Step1. Based on Table 7 and Equation 7, the first step of GRA is applied. Table 8 shows the comparative series for S dimension. Table 8. Comparative series for S dimension. FM1 FM2 FM3 FM4 FM5
S1 0.178 0.691 0.097 0.221 0.640
S2 0.133 0.099 0.151 0.094 1
S3 0.143 0.813 0.341 0.112 0.554
S4 0.503 0.251 0.110 0.084 0.361
S5 0.005 0.055 0.144 0 0.131
S6 0.956 0.796 0.959 0.607 0.054
S7 0.083 0.160 0.632 0.303 0.136
S8 0.165 0.076 0.499 0.067 0.177
S9 0.043 0.538 0.120 0.120 0.365
S10 0.192 0.161 0.062 0.061 0.099
S11 0.101 0.375 0.180 0.412 0.565
Step 2. Working with the reference set and using Equation 8, the grey relational coefficients for each dimension are calculated. They are reported in Table 9. In this case, we set ζ = 0.5. Table 9. Grey relational coefficients for S dimension. FM1 FM2 FM3 FM4 FM5
S1 0.378 0.618 0.356 0.391 0.581
S2 0.366 0.357 0.371 0.356 1
S3 0.368 0.728 0.432 0.36 0.529
S4 0.502 0.401 0.36 0.353 0.439
S5 0.334 0.346 0.368 0.333 0.365
S6 0.92 0.711 0.925 0.56 0.346
S7 0.353 0.373 0.576 0.418 0.367
S8 0.375 0.351 0.5 0.349 0.378
S9 0.343 0.52 0.362 0.363 0.441
S10 0.382 0.373 0.347 0.347 0.357
S11 0.357 0.444 0.378 0.459 0.535
Step 3. After calculating the grey relational coefficients, grey relational grade for each dimension is calculated using the weighted average of each grey relational grade. Table 10 shows the weight vector for dimension S.
18
CIRRELT-2013-61
Using Fuzzy Cost-Based FMEA, GRA and Profitability Theory for Minimizing Failures at a Healthcare Diagnosis Service
Table 10. Weight vector for each sub-dimension of S dimension. Weight
S1 0.0541
S2 0.052
S3 0.011
S4 0.043
S5 0.0478
S6 0.0267
S7 0.0505
S8 0.0536
S9 0.03
S10 0.011
S11 0.0104
Step 4. Using the weighting coefficients in table 10, Equation 9 and the risk score expressions given in Table 2, the final grey relational grade is calculated for S, O and D dimensions. Results of the grey relational grade for each dimension are given in Table 11. Table 11. Grey relational grades for each dimension. S
O
D
FM1
0.035
0.1525
0.168667
FM2
0.04
0.1914
0.121242
FM3
0.039
0.2057
0.1125
FM4
0.034
0.2222
0.124234
FM5
0.047
0.1681
0.11733
By using Equation 6, the overall grey relational grades are calculated and the resulting values are reported in Table 12. Table 12. Overall grey relational grades.
FM1 FM2 FM3 FM4 FM5
S*W1 0.012 0.014 0.014 0.012 0.016
O*W2 0.025 0.031 0.034 0.037 0.027
D*W3 0.081 0.058 0.054 0.059 0.056
SUM 0.118 0.104 0.102 0.108 0.101
SUM^(1/3) (RPI) 0.491 0.470 0.467 0.477 0.465
Rank 1 3 4 2 5
According to the results in Table 12, the most important and critical FMs are FM1, FM4, FM2, FM3 and FM5, respectively. Profitability is obtained in Figure 2 as the difference between Advantage and Cost of action from. Moreover, Equation 10 allows computing Cost of action based on the values provided in Table 13. Assuming PR=3, SR=4, PT=6 and IL=6, the slope of the strategy straight line is evaluated by using Equation 11, leading to M = 5 and m = 45˚. Table 13. C.I. values using Profitability.
FM1 FM2 FM3 FM4 FM5
Cost of action 7 2 16 5 3
CIRRELT-2013-61
Total loss without corrective action 5872 5872 5190 5000 5300
Total loss after corrective action 1046.3 2050.6 1323.5 1100 2000
19
Profitability 4818.7 3819.4 3850.5 3895 3297
Normalized Profitability 0.245 0.194 0.196 0.198 0.168
C.I. 0.477 0.423 0.423 0.430 0.398
Using Fuzzy Cost-Based FMEA, GRA and Profitability Theory for Minimizing Failures at a Healthcare Diagnosis Service
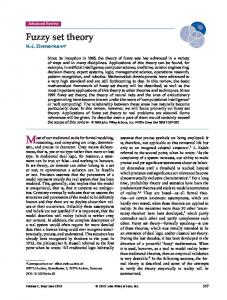
Figure 4 shows the profitability- RPI diagram. By using Equation 12, we compute C.I. for each
Profitability
FM, leading to the values shown in Table 13. 0,5 0,45 0,4 0,35 0,3 0,25 0,2 0,15 0,1 0,05 0
FM 1 FM 2 FM 3 FM 4 FM 5 0,46
0,465
0,47
0,475
0,48
0,485
0,49
0,495
0,5
RPI
Figure 4: Profitability- RPI diagram for the numerical example. Finally, the manager has to select the best mix of failures. In the numerical example, it is assumed that a maximum budget of 30 currencies is available. By solving the linear program (13) with the commercial software Lingo 13.0, we found that the optimal corrective action under the present budget constraint consist in implement actions related to FMs 1, 4, 2, and 3. Since precise and accurate prioritization of failures has a key role in their selection for corrective actions in order to reduce service failures and related costs, we conducted a sensitivity analysis to evaluate possible changes in prioritizations of failures. As shown by Table 14, the prioritization of failures for corrective actions changes according to the available budget. If budget is decreased by 10%, the prioritization of failures becomes 1, 4, 2, 5 while, if the budget is increased by 10%, all the five consider failures (1, 4, 2, 3, 5) could be afforded. Table 14. Sensitivity analysis for budget factor Budget Factor
Prioritization of failures
27(10% decrease)
FM1,FM4,FM2,FM5
30
FM1,FM4,FM2,FM3
33(10% increase)
FM1,FM4,FM2,FM3,FM5
8. Discussion and conclusions This paper proposes an integrated approach to identify, evaluate, and improve the potential failures using FCS-FMEA, GRA and profitability theory. In this paper a new integrated approach
20
CIRRELT-2013-61
Using Fuzzy Cost-Based FMEA, GRA and Profitability Theory for Minimizing Failures at a Healthcare Diagnosis Service
is developed to improve the method of S-FMEA from an economic perspective. Accordingly, at the first step, the estimated cost of faults based on an arbitrary number of expert’s (5 experts in the case here considered) was employed to evaluate each factor of RPI. In addition, different weights were assigned to each expert’s opinion and each RPI factor. Doing so, a more comprehensive and realistic evaluation of potential effects is possible. In the second step, each FM was evaluated using GRA. GRA is applied by using a two-phases scheme. In the first phase, the risk score of each dimension (S, O, and D) is calculated. Then, the final risk priority is computed in the second phase. Since precise and accurate prioritization of failures has a key role in their selection for corrective actions, we propose two measures (fuzzy RPI and profitability evaluation) in the second phase to achieve better results. This integrated method is an original and innovative approach based on combining FCS-FMEA, GRA and profitability theory. In particular, FCS-FMEA has been combined with GRA in order to consider many inter-related different dimensions and weights. On the other hand, considering profitability with FCS-FMEA and GRA, reduces the losses caused by failure occurrence. Besides, a maximization problem has been used to select the best mix of failures to be repaired. This constrained maximisation problem is solved by a standard tool, leading to the most convenient mix of failures to be repaired under available budget constraint.
Acknowledgements This research was partially financed by grants [OPG 0293307 and OPG 0118062] from the Canadian Natural Sciences and Engineering Research Council (NSERC). This support is gratefully acknowledged.
CIRRELT-2013-61
21
Using Fuzzy Cost-Based FMEA, GRA and Profitability Theory for Minimizing Failures at a Healthcare Diagnosis Service
References 1. Stamatis DH. Failure Modes and Effects Analysis: FMEA from Theory to Execution, ASQC Quality Press, Milwaukee, WI, 2003. 2. Miller JL, Craighead CW, Karwan KR. Service recovery: A framework and empirical investigation. Journal of Operations Management 2000; 18:387–400. 3. Michel S. Analyzing service failures and recoveries: A process approach. International Journal of Service Industry Management 2001; 12:20–33. 4. Berry LL, Parasuraman A. Prescriptions for a service quality revolution in America. Organizational Dynamics 1992; 20:5–15. 5. Boshoff C. An experimental study of service recovery options. International Journal of Service Industry Management 1997; 8:110–130. 6. Reichheld FF. Learning from customer defections. Harvard Business Review 1996; 74:56–69. 7. Roos I. Switching process in customer relationships. Journal of Service Research 1999; 2;68– 85. 8. Geum Y, Cho Y, Park Y. A systematic approach for diagnosing service failure: Servicespecific FMEA and grey relational analysis approach. Mathematical and Computer Modelling 2011; 54: 3126–3142. 9. Narayanagounder S, Gurusami K. A new approach for prioritization of FMs in design FMEA using ANOVA. Proceedings of World Academy of Science, Engineering and Technology 2009. 10. Rhee SJ, Ishii K. Using cost based FMEA to enhance reliability and serviceability. Advanced Engineering Informatics 2003; 17:179–188. 11. Dale BG, Shaw P. Failure mode and effects analysis in the U.K. motor industry: A state-ofthe-art study. Quality and Reliability Engineering International 1990; 6:179–188. 12. Vandenbrande WW. How to use FMEA to reduce the size of your quality toolbox. Quality Progress 1998; 31:97–100. 13. Chuang PT. Combining service blueprint and FMEA for service design. The Service Industries Journal 2007; 27:91–104. 14. Morán J, Granada E, Mínguez JL, Porteiro J. Use of grey relational analysis to assess and optimize small biomass boilers. Fuel Processing Technology 2006; 87:123–127. 15. Wu HH. A Comparative Study of Using Grey Relational Analysis in Multiple Attribute Decision Making Problems. Quality Engineering 2002; 15:209–217. 16. Hoffman KD, Bateson JEG. Essentials of Service Marketing. Dryden, Texas 1997. 17. Smith A, Bolton R, Wagner J. A model of customer satisfaction with service encounters involving failure and recovery. Journal of Marketing Research 1999; 36:356–372. 18. Parasuraman A, Zeithaml VA, Berry LL. A conceptual model of service quality and its implication for future research. Journal of Marketing 1985; 49:41–50. 19. Kelley SW, Davis MA. Antecedents to customer expectations for service recovery. Journal of the Academy of Marketing Science 1994; 22:52–61.
22
CIRRELT-2013-61
Using Fuzzy Cost-Based FMEA, GRA and Profitability Theory for Minimizing Failures at a Healthcare Diagnosis Service
20. Tax SS, Brown SW. Recovering and learning from service failure. Sloan management review 1998; 40:75–88. 21. Wirth R, Berthold B, Kramer A, Peter G. Knowledge-based support of system analysis for the analysis of FMs and effects. Engineering Applications of Artificial Intelligence 1996; 19:219–29. 22. Chang CL, Wei CC, Lee YH. FMEA using fuzzy method and grey theory. Kybernetes 1999, 28:1072–1080. 23. Bowles JB, Peláez CE. Fuzzy logic prioritization of failures in a system FM, effects and criticality analysis. Reliability Engineering & System Safety 1995; 50:203–213. 24. Jamshidi A. A Fuzzy Cost-based FMEA Model. International Conference on Industrial Experting and Operations Management; 2010, Dhaka, Bangladesh. 25. Pillay A, Wang J. Modified FMEA using approximate reasoning. Reliability Engineering & System Safety 2003; 79:69–85. 26. Chang CC, Liu PH, Wei CC. FMEA using grey theory. Integrated Manufacturing Systems 2001; 12:211–216. 27. Chen JK. Utility priority number evaluation for FMEA. Journal of Failure Analysis and Prevention 2007; 7:321–328. 28. Deng J. Introduction to grey system theory. Journal of Grey Systems 1989; 1:1–24. 29. Dong Ch. FMEA based on fuzzy utility cost estimation. International Journal of Quality & Reliability Management 2007; 24:958–971. 30. Carmignani G. An integrated structural framework to cost-based FMEA: The PC-FMEA. Reliability Engineering and System Safety 2008; 94: 861–871.
CIRRELT-2013-61
23