P. Bożek, A. Głowacka, U. Litwin, M. Pluta http://dx.doi.org/10.15576/GLL/2016.2.19
GLL
Geomatics, Landmanagement and Landscape No. 2 • 2016, 19–29
UsinG Gis tooLs to obtain eLevation modeLs for the pUrpose of spatiaL pLanninG1, 2 Piotr Bożek, Agnieszka Głowacka, Urszula Litwin, Magda Pluta Summary The paper presents the possibilities of applying GIS tools in order to obtain elevation models for spatial planning. Digital Elevation Model (DEM) or Digital Terrain Model (DTM) can be created based on direct field measurements, vectorization of existing cartographic materials, observations from the air, or data obtained from radar systems placed on the Earth’s orbit, using radar interferometry. The research methodology was based on the use of GIS tools in the process of obtaining public (generally available) elevation data, and assessing suitability of that data, for instance, in the context of spatial planning. In the study, we have used data from airborne laser scanning, free data provided by CODGiK (Central Documentation Centre of Geodesy and Cartography) and data acquired from Google Earth software, among others. Data analysis was divided into 4 stages: the first was to estimate how large are the differences when creating a grid elevation model out of a cloud of points, using aggregation algorithms. The second stage of the analysis consisted in the comparison of the amount of the received free data, and the elevation model established based on the cloud of points – the LIDAR model. The next stage of the analysis was aimed at a mutual comparison of the elevation models created with free data. The last stage of the analysis concerned the comparison of the DSM (Digital Surface Model) with the free data acquired from the Google Earth. Keywords Digital Elevation Model (DEM) • Digital Terrain Model (DTM) • DSM (Digital Surface Model) • LIDAR • spatial planning
1. introduction
The Digital Elevation Model (DEM) is a numerical discrete (point-based) representation of the topographic heights of the terrain, together with the interpolation algorithm, which allows for restoring its shape in a specific area [Kurczyński 2014]. As 1
2
The present publication has been financed from the MNiSW (Polish Ministry of Science and Higher Education) research grant (No. 4360/2015). Research results implemented for research topic DS 3366/KGRKiF/2016 were financed from a scientific grant by the MNiSW (Polish Ministry of Science and Higher Education).
20
P. Bożek, A. Głowacka, U. Litwin, M. Pluta
noted by authors Burdziej and Kunz [2006], DEM is one the most common sources of data concerning terrain, while according to Przybyła and Pyszny [2013], the model can be created based on direct field measurements, vectorization of existing cartographic materials, aerial observations, or data obtained from radar systems placed on the Earth’s orbit, using radar interferometry. According to Burdziej and Kunz [2006], the accuracy of DEM determines the possibility of its use for specific purposes, while Hejmanowska et al. [2008] note that it affects the outcome of the analyses carried out with the consideration thereof, as well as derivative maps such as grade map, map of exposures, or map of visibility. Accuracy of the DEM will depend on the data sources used for its construction, as well as the density of points, measured object definitions, and the chosen type and parameters of the grid (TIN, GRID) [Hejmanowska et al. 2008]. Moreover, according to Burdziej and Kunz [2006], the source of errors in the DEM, which has been developed on the basis of raster data, lies in the size of the smallest fields (pixels), which store the information about the heights. Image resolution determines the accuracy of DEM, and the decrease in resolution causes the decrease in the amount of detail within the entire model. Despite these limitations, the use of raster data enables fast processing of large data sets, and therefore, according to Rusli et al. [2014], it is recommended for the construction of DEMs in small and medium scale. One of the data sets used to build the DEM is the satellite imagery stored in the form of raster images. Particularly noteworthy are the images taken by the Aster scanner, which captures images in 14 spectral channels of different spatial resolution, where the system of registration of near-infrared was equipped with the capability to perform reverse images, at an angle of 27.7°, as a result of which it is possible to perform stereoscopic imaging [Przybyła and Pyszny 2013]. The scanner is mounted on board of the satellite, which performs nadir imaging and reverse imaging, within area coverage between 83°N–83°S. Based on satellite images, a DEM was created called AsterGRID, developed in cooperation with NASA, and the Japanese Ministry of Economy, Trade and Industry. Implementation of the project started in 1999, and it lasted for 10 years. Data development comprised processing of some 1.5 million images, creating 1.2 million stereo-pairs, removing clouds, and allocating the DEM (Digital Elevation Model) onto 22,600 tiles sized 1° × 1°. The Aster model is a GRID model, in which each cell (pixel) has a specific x, y coordinates as well as the averaged coordinate z [Przybyła and Pyszny 2013]. According to Rusli et al. [2014], AsterGRID is available under an open license (open source), and the resolution of the DEM is 30 m. In addition, the average accuracy of the DEM, estimated by its creators, is 10 m, and the prevalence of negative errors is noted, i.e. undervaluation of heights [Rusli et al. 2014]. Moreover, as noted by Mukherjee et al. [2013], the accuracy of the vertical model that is based on Aster stereo pairs is impacted by the morphological characteristics and the roughness of the terrain; additionally, the error increases significantly with the increase in the slope grade above 100. In the context of using DEM for specific purposes, its accuracy is an important issue. According to Litwin et al. [2015], accuracy depends on the errors of point positioning, which result from the selected measurement method, the size of the mesh cells, and
GLL No. 2 • 2016
21
UsinG Gis tooLs to oBtAin eLevAtion ModeLs...
the configuration of the terrain. According to Burdziej and Kunz [2006], assessment of the DEM accuracy is performed by comparing the size of the RMSE (Root Mean Square Error) calculated on the basis of a comparison of selected model points with control points. According to Fisher [1999], DEM can be well defined, and in that case, the uncertainty of measurement is expressed by the RMSE error; or it can be poorly defined, in which case indeterminacy or ambiguity occurs (Figure 1). Well-defined DEM
Poorly-defined DEM Uncertainty
Error
Ambiguity
Indeterminacy
Insufficiently defined metadata
Incompatibility
Source: Fisher 1999
Fig. 1. Characteristics of Digital Elevation Model definition
According to Hejmanowska et al. [2008], the ambiguity arises when during the measurement, various criteria are adopted different, as well as various methods and interpolation parameters. Indeterminacy occurs when the adopted criteria are not known during the measurement, or when there is no information as to whether these criteria were met. Moreover, the consideration of the quality of the model should take into account the measurement technique used, the criteria adopted during the measurement, and the technology to generate the DEM. DEM error distribution may be determined by analytical or empirical methods, or the increasingly frequently applied Monte Carlo method. Analytical methods, due to the difficulty in the formulation of the function describing the propagation of an error, are rarely used in practice. Empirical method, on the other hand, requires the knowledge of error for selected points throughout the area. Monte Carlo method involves placing random errors of the given distribution within the model, and then performing spatial analysis with regard to these errors. Repeating the procedure several times allows us to determine the spatial distribution of errors [Hejmanowska et al. 2008]. According Burdziej and Kunz [2006] a reduction in the resolution causes generalization of the model, including the loss of extreme values, which translates into an increase in the value of the error where grade models of land correspond to the forms with the greatest inclination.
Geomatics, Landmanagement and Landscape No. 2 • 2016
22
P. Bożek, A. Głowacka, U. Litwin, M. Pluta
2. materials and methods
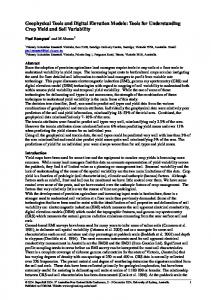
The research methodology was based on the use of GIS tools, the process of obtaining generally available elevation data, and assessing suitability of that data, for spatial planning, among others. The study used data from airborne laser scanning, free data provided by CODGiK (Central Documentation Centre of Geodesy and Cartography), and data acquired thanks to the Google Earth software, among others. The methodology can be divided into two parts: first, pertaining to data acquisition and processing, and second, pertaining to collating and comparing the data, in order to assess accuracy. The first stage was related to the acquisition of data. The study used two types of data: free public data, and elevation data obtained by the technology of airborne laser scanning. The first free data was obtained from the CODGiK website, and it was represented by the DEM. As of 12 July 2014, this data was made available free of charge, and data coverage spanned the entire area of Poland.2 The maximum distance between adjacent points in the CODGiK data is 100 m. Free data also included the data obtained via Google Earth. Elevation data was imported from this platform, using the free TCX Converter software. The generally available data was compared with the information obtained from the air laser scanning. LIDAR data provided the accuracy of point location at the level of 0.2 m, with 8 points per 1 m2. The study covered two areas: one located in Zabierzów municipality (Figure 2a) and the other, in Nowy Targ municipality (Figure 2b). The areas of study were selected because of their configuration. The first area is characterized by a great diversity of use: it is a built-up area, directly adjoining a woodland area, shrubbery, and grassland. The other area, located in the municipality of Nowy Targ contains mostly open spaces, undeveloped, and without trees or shrubs. Only in the south-west portion of the region, there is a densely built-up fragment – a housing estate. The selection of these areas allowed the assessment of the suitability of the free elevation data, both in urban areas and in the open area (such as agricultural land). In order to obtain consistent elevation data formats, GIS software was used: SAGA GIS (version 2.1.2) and QGIS (version 2.12.0). The first step consisted in processing the cloud of point into a raster format. Thus classified, the cloud of points represented Numerical Terrain Model (DTM). Using the Saga GIS software, a cloud was distinguished, containing only those points that were classified as terrain (GROUND). This was followed by the conversion from the files of point clouds (.las) into raster format (.geotiff). As a result, GRID models were obtained with a mesh of 1 m. The SAGA offers the capability to create the geotiff format by using one of the five algorithms for aggregation: the creation of a grid based on the first, or the last point in the mesh cell, the largest and smallest values in the individual cell of the mesh, and on the basis of calculating the average height of the points contained in the mesh cell. The study used all these algorithms, thus creating five separate grid files. Identical operations were 2
Based on art. 40a ust. 2 pkt 1 ustawy Prawo geodezyjne i kartograficzne z dnia 17 maja 1989 r., Dz. U. z 2014 r. poz. 897 (tekst jednolity). Until 12 July 2014 no fees are charged for making data sets available.
GLL No. 2 • 2016
UsinG Gis tooLs to oBtAin eLevAtion ModeLs...
23
performed with respect to the point cloud containing DTM, however, in this case only the algorithm creating the grid based on the highest value in the individual mesh cell was applied. In both studied areas, the methodology of processing point clouds to raster form was applied. Free data provided by CODGiK was converted from .XYZ format to raster format with a grid cell of 100 m. The last phase of data acquisition consisted in using free software called TCX Converter. This facilitated obtaining heights for points with the given grid coordinates (WGS 84 frame of reference). This was done based on the .kml file format, containing the so-called “route paths.” The program updates the information on the heights of the points, and then allows you to export that to the desired format (e.g. Csv). As the source of the plane data, coordinates of points were used found in the free CODGiK data (spaced 100 m). For the area located in Zabierzów municipality, 132 points were assigned, and 144 points for the area in the municipality of Nowy Targ. a)
b)
Source: authors’ study
Fig. 2. Research area: fragments of Zabierzów municipality (a) and Nowy Targ municipality (b)
The developed data (both raster and vector) has been imported into QGIS software, which prepared it for analysis. Within the program, vector layer was created containing a regular grid of points (Figure 3). The points constituted the markers, which imported elevation data from individual raster layers, and from the vector layer containing the heights thanks to the TCX Converter software. For this purpose, the QGIS Point Sampling Tools plug-in was used, which offers the ability to retrieve values from a raster layer, and then assign them to any vector layer. The heights of the individual rasters were summarized in one table of attributes, and then using the calculator of fields, deviations were calculated from the elevation model created out of the cloud of points (raster created using an algorithm that calculates the average altitude of points
Geomatics, Landmanagement and Landscape No. 2 • 2016
24
P. Bożek, A. Głowacka, U. Litwin, M. Pluta
within 1 m2). The data obtained was exported to .csv format. Using Microsoft Excel and Surfer software, we have analysed the results.
Source: author’s study
Fig. 3. Layer showing DEM with marked locations of altitude measurements for the areas in Zabierzów and Nowy Targ municipalities
3. results
The analysis of elevation data has been subdivided into several stages. The first stage consisted in estimating, how large the differences are, when developing the grid elevation model out of point cloud, using aggregation algorithms. When creating the GRID, only those points were included, which were classified as terrain (GROUND). The mesh cell size was 1 m. An assessment was made of the way the algorithms, which aggregate the cloud of points, affect the accuracy of the square grid model (Table 1, Table 2). Table 1. Analysing the differences between the GRIDs created using aggregation algorithms in the SAGA GIS software for Zabierzów municipality The area located in Zabierzów municipality
LIDAR mean – LIDAR low
LIDAR mean – LIDAR high
LIDAR mean – LIDAR first
LIDAR mean – LIDAR last
Minimum difference
0.000
0.005
0.000
0.000
Maximum difference
0.160
5.880
0.160
0.120
Average difference
0.029
0.223
0.017
0.020
Mean value of differences
0.072
Source: authors’ study
GLL No. 2 • 2016
25
UsinG Gis tooLs to oBtAin eLevAtion ModeLs...
Table 2. Analysing the differences between the GRIDs created using aggregation algorithms in the SAGA GIS software for Nowy Targ municipality The area located in Nowy Targ municipality Minimum difference
LIDAR mean – LIDAR low
LIDAR mean –LIDAR high
LIDAR mean – LIDAR first
LIDAR mean – LIDAR last
0.000
0.000
0.000
0.000
Maximum difference
0.100
0.137
0.137
0.090
Average difference
0.036
0.033
0.020
0.022
Mean value of differences
0.028
Source: authors’ study
Both in the first and second area studied, with an exception of one case, the maximum difference in the values did not exceed 0.16 m, and the average height difference for all the test points was 0.036 m. In the area located in Zabierzów municipality, the average difference in height for all models in relation to the output model reached 0.029 m, which should be considered a very good result. In open spaces with uniform slope, similar result was obtained regardless of the aggregation method applied. Along with the increase of the individual GRID cell, differences may increase, but let us keep in mind that this is also connected to the generalization of results, and does not only depend on the aggregation algorithm. For the area located in Zabierzów municipality, the biggest height difference occurred between the model created on the basis of the average value, and the model using the maximum value in the cell – that difference amounted to 5.880 m. This resulted in a decrease in the accuracy of the entire model. Reasons for such a large difference should be seen in the data source, rather than in erroneous execution of the elevation model. The algorithm takes into account all the points contained in one area of the mesh cell, including noise or the points in the cloud that were wrongly classified. The algorithm, which creates the GRID, while taking into account the maximum value of points in the area of 1 m, used the maximum value (in this case the noise of the points cloud). The second stage of the analysis was based on a comparison between the altitudes obtained from the free data, and the elevation model established based on the cloud of points – the LIDAR model. Analysis of the height differences compared to the LIDAR model data in both areas, clearly demonstrated that the differences are less significant in the model, which uses free data provided by the CODGiK. In the elevation model for the area located in Zabierzów municipality, the maximum difference for CODGiK data amounted to 1.578 m, while in the case of the model retrieving data from Google Earth, to as much as 20.857 m. For the area located in the municipality of Nowy Targ, the maximum difference for CODGiK data amounted to 4.950 m, whereas for the model retrieving data from Google Earth, to 6.346 m (Table 3). For both areas, the difference between the LIDAR model and the free CODGiK model Geomatics, Landmanagement and Landscape No. 2 • 2016
26
P. Bożek, A. Głowacka, U. Litwin, M. Pluta
amounted to 0.16 m, while in the case of the data obtained from the Google Earth model, this difference amounted to 3.211 m (Table 4). Table 3. Height differences for the models developed using free data Area/location
The area located in Zabierzów municipality
The area located in Nowy Targ municipality
Analysis of the models
LIDAR mean – CODGiK data
LIDAR mean – Google data
LIDAR mean – CODGiK data
LIDAR mean – Google date
Minimum difference
0.000
0.088
0.000
0.148
Maximum difference
1.578
20.857
4.950
6.346
Average difference
0.216
3.494
0.104
2.927
Source: authors’ study
Table 4. Differences between free data and LIDAR data Data source Mean value of differences from the two areas
CODGiK
Google Earth
0.160
3.211
Source: authors’ study
The models, which use free data, are better suited for open areas; and here also lower differences in values were noted for the models created on the basis of free data. Elevation models developed on the basis of free data cope better in the case of less complicated surfaces, with a uniform grade (slope). In areas that are heavily urbanized, with varied terrain and varied surfaces, it is impossible to achieve satisfactory results. The next stage of the analysis was to conduct a mutual comparison of elevation models created on the basis of free data. We were hoping that the comparison would answer the question whether it is possible to merge and use the data to build one joint elevation model. Average differences between the points in the area of Zabierzów municipality reached the value of 3.603 m, and in Nowy Targ municipality, 3.263 m. The free data provided by CODGiK has a low density (about 100 m). If the accuracy of both elevation models had similar characteristics, it would have been possible to supplement the CODGiK data and render it denser, using the data acquired from the Google Earth. In both areas, the difference of heights assumes the largest value in built-up areas, and in border areas. In the area of Zabierzów municipality, height differences were smaller; and in those locations where there are strongly urbanized areas, the values were similar. Visualization of the point distribution of differences, or mutual interdependencies between measurement points, is shown on the map (Figure 4), which was developed using the Surfer software. The resulting differences were plotted on the map using the interpolation, or Kriging.
GLL No. 2 • 2016
27
UsinG Gis tooLs to oBtAin eLevAtion ModeLs...
Source: authors’ study
Fig. 4. Height differences between the model based on the CODGiK data, and elevation model acquired from Google Earth for Zabierzów and Nowy Targ locations
The last analyses concerned the comparisons of the DEM with the data acquired from the free Google Earth service. Configuration of the terrain, along with the vegetation or buildings, is of particular importance in the analysis of the impact of potential investments (both construction investments and linear infrastructure) on the existing environment. The changes, which investment projects within the landscape will cause, can be assessed best (i.e. in the easiest, and yet the most effective manner) by means of their visualization. Thanks to using the appropriate elevation model, first we are able to designate the area (subject to visibility changes, shading, or the course of airways), which the given investment will affect, and then assess the extent to which the investment will affect the environment. As in previous cases, there are discrepancies between the two elevation models. The maximum difference in the Zabierzów municipality location amounted to 20.857 m, and in the Nowy Targ municipality location, 6.120 m. The average height differences for all points in Zabierzów municipality reached 3.494 m, and in the Nowy Targ municipality, 3.027 m (Table 5). Table 5. Comparison of height differences between the Google Earth elevation model and the DEM (LIDAR) The area located in Zabierzów municipality
The area located in Nowy Targ municipality
Minimum difference
0.088
0.150
Maximum difference
20.857
6.120
3.494
3.027
Area/location
Average difference Source: authors’ study
Geomatics, Landmanagement and Landscape No. 2 • 2016
28
P. Bożek, A. Głowacka, U. Litwin, M. Pluta
4. Conclusions
The spatial planning today requires the use of modern technologies that support the planning process. Already at the designing stage, many aspects must be considered, present within every investment project. Regardless of the size of the investment project, each one project makes an impact on the surrounding environment. With the latest technology, it is possible to predict some of that impact. The use of elevation models improves the very process of investment project design, but it also allows its users to assess how the investment will affect the environment after its completion. In order to create elevation models, one can use GIS software, which allows the acquisition and processing of the elevation data available. In the planning process, free data can be used. We should bear in mind that the accuracy of such data differs, and it largely depends on the studied area. The present study used two types of free data. The first type of data, obtained from CODGiK, had good accuracy, but low density of coverage points (approximately 100 m), and the other type of data, obtained, among others, from Google Earth, left much to be desired in terms of precision. The data used in the Google Earth software demonstrates an elevation model (obtained using SAR technology) for large areas (e.g. the whole continent). Accuracy for small areas (such as the ones analysed in the present work) is therefore lower. Therefore this type of data cannot be used where high accuracy of material is required. In such cases, one should use data with greater accuracy (LIDAR). Free data, however, can be useful at the stage of planning. It has one important feature: that of being generally available. We can using it in order to carry out preliminary analyses, to designate areas where a more detailed analysis (using more precise data) is needed, which can save time when processing the data with greater accuracy. references Burdziej J., Kunz M. 2006. Ocena wpływu rozdzielczości i metody pozyskiwania danych wysokościowych na dokładność numerycznych modeli terenu oraz modeli spadków i ekspozycji. Arch. Fotogram. Kat. Teledet., 16. Fisher P. 1999. Models of uncertainty in spatial data. Geographical Information Systems: Principles, Techniques, Management, and Applications. Hejmanowska B., Drzewiecki W., Kulesza Ł. 2008. Zagadnienie jakości Numerycznych Modeli Terenu. Arch. Fotogram. Kat. Teledet., 18a. Kurczyński Z. 2014. Fotogrametria. Wydawnictwo Naukowe PWN, Warszawa. Litwin U., Piech I., Rakowski D. 2015. Digital terrain model as a basis for determining the floodland of the Prądnik River. Geomat. Landmanag. Landsc. (GLL), 2. Mukherjeea S., Joshi P.K., Mukherjeea S., Ghoshb A., Gargc R.D., Mukhopadhyay A. 2013. Evaluation of vertical accuracyof open source Digital Elevation Model (DEM). Int. J. Appl. Earth Observ. Geoinf., 21. Przybyła Cz., Pyszny K. 2013. Porównanie numerycznych modeli terenu SRTM i ASTER GDEM oraz ocena możliwości ich wykorzystania w modelowaniu hydrologicznym w obszarach o małych deniwelacjach. Rocz. Ochr. Środ., 15(2).
GLL No. 2 • 2016
UsinG Gis tooLs to oBtAin eLevAtion ModeLs...
29
Rusli N., Majid M., Din H. 2014. Google earth’s derived digital elevation model. A comparative assessment with Aster and SRTM data. 8th International Symposium of the Digital earth (ISDE8).
mgr inż. piotr bożek Uniwersytet rolniczy w Krakowie Katedra Geodezji rolnej, Katastru i fotogrametrii 30-198 Kraków, ul. balicka 253a, e-mail:
[email protected] mgr inż. agnieszka Głowacka Uniwersytet rolniczy w Krakowie Katedra Geodezji rolnej, Katastru i fotogrametrii 30-198 Kraków, ul. balicka 253a, e-mail:
[email protected] prof. dr hab. inż. Urszula Litwin Uniwersytet rolniczy w Krakowie Katedra Geodezji rolnej, Katastru i fotogrametrii 30-198 Kraków, ul. balicka 253a, e-mail:
[email protected] mgr inż. magda pluta Uniwersytet rolniczy w Krakowie Katedra Geodezji rolnej, Katastru i fotogrametrii 30-198 Kraków, ul. balicka 253a, e-mail:
[email protected]