Using Keyhole Markup Language to create a spatial interface to South African water resource data through Google Earth Michael Silberbauer1, Willie Geldenhuys2 Resource Quality Services, Department of Water Affairs and Forestry, Private Bag X313, Pretoria, South Africa 0001,
[email protected] [email protected]
Abstract The rainfall in South Africa is in the low to moderate range (around 500 mm per year) and the runoff generated is less than 50 mm per year, with evaporation exceeding 2000 mm per year in most of the country. By the middle of the twentieth century, urbanisation, industrial development and mineral exploitation were generating so much effluent that the parched hydrological system had no further capacity for dilution or assimilation of contaminants before the water arrived at the next user downstream. In order to monitor and manage this situation, which becomes critical during dry spells, the government institution currently known as the Department of Water Affairs and Forestry established a nationwide network of water quality monitoring sites, many of which have now been operating for thirty years or longer. In the early years of the programme, the network layout and operation were part of the corporate consciousness, with only occasional hard copy reports of the entire system to jog people’s memories. Most of those involved in the design and early operation of the network have long retired, and new users of the data have difficulty in appreciating the extent and interactions of monitoring programmes and sites. Soon after the department produced its last monumental hand-drawn water quality map in 1984, geographical information systems (GIS) became available and greatly simplified data presentation. The next fundamental shift in spatial data methods occurred in 2005, when Google launched Google Earth on the Internet, with the Keyhole Markup Language (KML) as a method for users to overlay data. We used these tools to set up a publicly accessible spatial inventory on the departmental Internet web site , giving rapid access to several thousand surface water and groundwater monitoring site locations. Using the KML popup balloon function, users can select pre-generated time-series graphs of water quality, flat data files and flow data records. Maucha ionic symbols show the major ions and salinity at sites where such data are available. Date tags for the opening and closing of monitoring sites enable a user to show monitoring activities for selected periods and the hierarchical folder layout permits the selection of sites related to particular types of monitoring, such as sewage works or rivers. The advantages over a conventional GIS system are Google Earth’s ability to zoom rapidly from national to local scale, the frequent update of the background layers and fly-through perspective views where topography emphasises the inter-relationship of pollution sources, monitoring sites and water users. To help orientate users, we have provided supplementary background data, including South African river names and drainage region codes in KML format. Limitations of the system include the need for a more-than-entry-level PC with an Internet connection and the sparking of unreasonable user
expectations regarding elevation resolution, real-time satellite images and real-time water quality data. Integrating the water quality inventory with Google Earth has provided users of water quality data with a new way of visualising the South African data network and of sifting the inventory for useful data. Despite the limited potential audience, the site logs more than 100 visits per month. Future developments could include a tighter integration with corporate systems, including the live water quality database and the use of time-enabled markers to show how water quality at each site measures up to the applicable standards and guidelines from year to year.
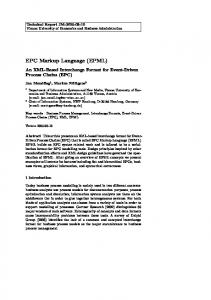
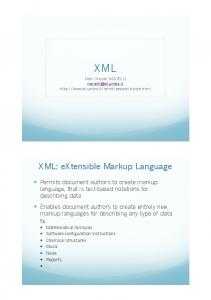
Introduction To appreciate the importance of South Africa’s water quality monitoring network, and the need for a spatial inventory, some background information on the region’s climate, hydrology and economic development is necessary. Rainfall over South Africa is in the low to moderate range with an average of about 480 mm per year (Figure 1a). Annual evaporation rates increase from the southeast to northwest and mostly exceed 2000 mm (Figure 1b). The runoff generated from rainfall is generally less than 50 mm per year, representing a yield of 9% against the world average of 35% (Allanson 2004; Schultz 2006; Schultz & Lynch 2006). Rainfall is also very seasonal and river flow is often low or non-existent in the dry season, even in major rivers such as the Limpopo.
500-800mm
20002500mm
250-500mm >2500mm
15002000mm
References Allanson, BR 1961, ‘Investigations into the ecology of polluted inland waters in the Transvaal, Part I: The physical, chemical and biological conditions in the Jukskei-Crocodile River System’, Hydrobiologia, vol. 18, no. 1-2, pp. 2-76. Allanson, BR 2004, ‘Limnology in South Africa: Past and present status and future needs’, in B Gopal & RW Wetzel (eds.), Limnology in Developing Countries, vol. 4, pp. 1-116. Allanson, BR & Gieskes, JMTM 1961, ‘Investigations into the ecology of polluted inland waters in the Transvaal, Part II: An introduction to the limnology of Hartbeespoort Dam with special reference to the effect of industrial and domestic pollution’, Hydrobiologia, vol. 18, no. 1-2, pp. 77-94. Beepa 2008, ‘FRAPS real-time video capture and benchmarking’, viewed 2008-08-10, . Cobban, DA & Silberbauer, MJ 1993, ‘Water quality decision-making facilitated through the development of an interface between a geographic information system and a water quality database,’ in SA Lorenz, SW Kienzle & MC Dent (eds.), Hydrology in Developing Regions... the Road Ahead, Proceedings of the Sixth South African National Hydrological Symposium, vol. II, pp. 523-530. CSV2KML 2007, ‘csv2kml 0.4b compiled in October 2007’, viewed 2008-08-09, . Day, JA & King, JM 1995, ‘Geographical patterns, and their origins, in the dominance of major ions in South African rivers’, South African Journal of Science, vol. 91, pp. 299-306. DWAF-RQS 2008, ‘Resource Quality Services water quality data exploration supplementary information’, viewed 2008-08-10, . Fuchs, C & Horak, E 2008, ‘Africa and the digital divide’, Telematics and Informatics, vol. 25 pp. 99-116.
Google Code 2008, ‘KML Reference’, viewed 2008-08-10, . Gnu 2008, ‘Gawk’, viewed 2008-08-10, . Martin, K 2007, Export to KML Extension Version 2.4 documentation, Bureau of Planning, City of Portland, viewed 2008-08-09, . Microsoft 2004, ‘Windows Movie Maker 2.1’, viewed 2008-08-10, . Miniwatts Marketing Group 2008, Africa Internet usage and population statistics, viewed 2008-0809, . Palmer, SE 1999, Vision science—photons to phenomenology, The MIT Press, Cambridge, Massachusetts. PKWARE 2007, ‘Data security software’, . Schulze, RE 2006. ‘Water Resources Complexities and Hydrological Needs in South Africa: Background’, in RE Schulze (ed.), South African Atlas of Climatology and Agrohydrology, Water Research Commission, Pretoria, South Africa, WRC Report 1489/1/06, Section 21.1. Schulze, RE & Lynch, SD 2006, Annual Precipitation, in RE Schulze (ed.), South African Atlas of Climatology and Agrohydrology, Water Research Commission, Pretoria, South Africa, WRC Report 1489/1/06, Section 6.2. Schulze, RE & Maharaj, M 2006, ‘A-Pan Equivalent Reference Potential Evaporation’, in RE Schulze (ed.), South African Atlas of Climatology and Agrohydrology, Water Research Commission, Pretoria, South Africa, WRC Report 1489/1/06, Section 13.2. Silberbauer, MJ 1997, ‘The application of geographic information systems to water quality monitoring’, in Remote Sensing and Geographic Information Systems for Design and Operation of Water Resources Systems (Proceedings of Rabat Symposium S3, April 1997), IAHS Publication no. 242, pp. 189-195. Silberbauer, MJ 2006, ‘The construction of a hydrologically-correct, annotated 1:500 000 spatial dataset of the rivers of South Africa and contiguous basins’, Report number N/000/00/REH/0701, DWAF: Resource Quality Services, Pretoria, South Africa, viewed 200808-09, . Stiff, HA. Jr. 1951, ‘The interpretation of chemical water analysis by means of patterns’, Journal of Petroleum Technology, vol. 3, no. 10, section1, pp. 15-16 & section 2, p3. Swart, SJ, van Veelen, M & Nell, U 1991, ‘Water quality data inventory, Volume 1: Drainage regions A, B, C, D, E, F’, Technical Report TR146, Hydrological Research Institute, Department of Water Affairs, Pretoria, ~400pp. van Veelen, M, Nell, U & Geldenhuys, WF 1990, ‘Surface water quality of South Africa 19791988. Volume 2: Drainage Region A and B’, Technical Report TR145, Hydrological Research Institute, Department of Water Affairs, Pretoria. ~100pp.
van Vliet, HR & Nell, U 1986, ‘Surface water quality of South Africa, the Vaal River catchment 1979-1983’, Technical Report TR131, Hydrological Research Institute, Department of Water Affairs and Forestry, Pretoria, 208 pp.