Researchers perform their analysis on the former and once the paper is accepted .... forecasting when dealing with multi
Using Split Samples to Improve Inference on Causal Effects Marcel Fafchamps and Julien Labonne⇤ April 2017
Abstract We discuss a statistical procedure to carry out empirical research that combines recent insights about pre-analysis plans and replication. Researchers send their datasets to an independent third party who randomly generates training and testing samples. Researchers perform their analysis on the training sample and are able to incorporate feedback from both colleagues, editors and referees. Once the paper is accepted for publication the method is applied to the testing sample and it is those results that are published. Simulations indicate that, under empirically relevant settings, the proposed method delivers more power than a pre-analysis plan. The effect mostly operate through a lower likelihood that relevant hypotheses are left untested. The method appears better suited for exploratory analyses where there is significant uncertainty about the outcomes of interest. We do not recommend using the method in situations where the treatment are very costly and thus the available sample size is limited. An interpretation of the method is that it allows researchers to perform direct replication of their work. We also discuss a number of practical issues about the method’s feasibility and implementation.
⇤ Fafchamps:
Stanford University, Freeman Spogli Institute for International Studies, Encina Hall E105, Stanford CA 94305 USA (
[email protected]). Labonne: Blavatnik School of Government, University of Oxford Radcliffe Observatory Quarter, Woodstock Road, Oxford, OX2 6GG (
[email protected]). We thank Michael Alvarez (Co-Editor), two anonymous referees, Rob Garlick and Kate Vyborny for discussions and comments. All remaining errors are ours. Replication data are available on the Harvard Dataverse (Fachamps and Labonne, 2017). Supplementary materials for this article are available on the Political Analysis Web site.
1
1
Introduction
The gap between statistical theory and practice makes it challenging to assess the reliability of empirical findings in political science (Gerber, Green and Nickerson, 2001).1 This is due to a combination of researchers’ degree of freedom and publication bias. As a result, the probability of Type I error in published research is believed to be larger than the commonly accepted five percent. For example, Gerber and Malhotra (2008) report that there is a bunching of p-values just below the 0.05 threshold in top political science journals.2 This is consistent with researchers and editor unconsciously or consciously selecting outcome variables, regression methods, estimation samples, and control variables to deliver significant results. A number of reforms of the reviewing process have been proposed to decrease the risk that spurious findings are published and cited (Green, Humphreys and Smith, 2013; Miguel et al., 2014; Nyhan, 2015; Findley et al., forthcoming). The common objective is to encourage researchers to transparently select which statistical tests to implement before accessing the data on which they will be run. A prominent example is the introduction of pre-analysis plans (PAPs).3 Such plans are written – and possibly shared with the research community – before any analysis is carried out. This reduces the risk that researchers select hypotheses that can be rejected with the available data (Humphreys, Sanchez de la Sierra and van der Windt, 2013; Olken, 2015; Monogan, 2015; Blair et al., 2016; Dunning, 2016; Lin and Green, 2016). PAPs have two main limitations: reduced ability to learn from the data and complexity. By construction, PAPs can only include hypotheses that the researcher could think about before using the data. In situations where the prior information is limited, it is likely that relevant hypotheses will be left out of PAPs. The pace of new discoveries might slow down. In addition, social scientists are often interested in both the effects of a treatment and in the mechanisms underlying it. As analyses usually proceed sequentially, pre-specifying all possible regressions along the "analysis tree" is likely to be too taxing and inefficient (Olken, 2015). Some researchers argue that the profession 1 It
echoes earlier findings in other social science disciplines (Leamer, 1974, 1978, 1983; Lovell, 1983). et al. (2016) find similar results for top economics journals. 3 The Experiments in Governance and Politics network allows researchers to register both experimental and observational studies (http://egap.org/content/registration). Similarly, The American Economic Association and the Center for Open Science have recently set-up similar registries. 2 Brodeur
2
should encourage replications (Coffman and Niederle, 2015; Dunning, 2016). While filling a PAP offers protection for studies using soon-to-be collected data, it offers less protection in the case of analysis of existing data as researchers might have analyzed the data before writing the plan. In this paper we discuss a related – and possibly complementary – method that allows researchers to learn from the data before registering their analyses and thus decreases the likelihood that relevant hypotheses are left untested. The method seeks to combine a key characteristic of PAPs – a commitment device – with the sequential nature of statistical analysis in political science. The process involves sending the data to an independent third party who randomly generates two non-overlapping subsets of the data. Researchers only have access to one subset – called the training dataset – while the third party keeps the second one – called the testing dataset. Researchers are free to analyze the training dataset and can adapt ideas from seminar audiences, editors and referees and incorporate them into the analysis. Once the paper has been accepted for publication it is akin to a detailed pre-analysis plans that fully specifies the regressions to be estimated on the testing sample. The analysis is implemented, unchanged, on the testing dataset, and these results are the ones that are published.4 The method combines insights from recent papers on PAPs and replication (Coffman and Niederle, 2015; Olken, 2015; Dunning, 2016). The first half of the dataset is used to prepare a manageable PAP; i.e. one that does not suffer from the complex "analysis tree" that Olken (2015) identified. Researchers are able to use a subset of the data to make analysis decisions and can thus allocate their time more efficiently on relevant regressions. The second half of the dataset is used to perform a full replication of the results, as suggested by Coffman and Niederle (2015) and Dunning (2016).5 This is a very appealing replication as the data come from the same context and were collected using the same protocols. Crucially, as opposed to PAPs, the method allows researchers to test hypotheses that they did not think about before starting their analysis. Researchers can refine their research plans based on initial findings, interactions with seminar audiences, and 4 The
results from the training sample should remain available to the interested (Bayesian) reader. have been discussing ways to promote replication across the social sciences. A number of panels and roundtables on this topic were organized both at APSA in Philadelphia in September 2016 and at the ASSA in Chicago in January 2017. 5 Researchers
3
requests from referees and editors.6 We believe this approach better fits the way empirical research is carried out in political science – particularly when drawing inference about treatment effects. It is common for new hypotheses to arise from observing realizations of the data (Laitin, 2013; Gelman, 2014). Hence it is rarely possible for researchers to ex-ante list all possible tests they may want to perform. Only a subset of hypotheses tested on the training sample - potentially those that are rejected on that sample - are carried over to the testing sample. As we correct for multiple testing, this compensates for the loss of power due to smaller sample sizes. In practice, we do not recommend a purely mechanical approach with all hypotheses rejected on the training set tested on the testing set. Rather, researchers are expected to select a subset of those hypotheses. This should be guided by theory, additional robustness tests and the feedback from colleagues, seminar audiences, editors and referees. Importantly, this method can be combined with a PAP as a researcher could register in a PAP a number of hypotheses to be tested on the full sample and then carry out more exploratory analyses with the proposed method. This is related to the various phases of medical research that starts with very clear objectives and then follows more exploratory work. Indeed, at first the research has two very clear objectives: to establish that the drug is safe and that it has the intended therapeutic effect. Once the drug has been proven to work, researchers engage in more exploratory work to study both whether the drug has other therapeutic effects, works differently on some populations or interacts with other drugs. This often requires sequential trials and data collection. But given the way social science data is collected, those steps can be combined. The proposed method offers two other methodological benefits: reduced type I errors, as in PAPs; and reduced the risk of publication bias. The main potential cost of split samples is loss of power. First, the method reduces the risk of Type I error because researchers fully specify the regressions they want to estimate before having access to the dataset on which hypotheses will be tested. This reduces the risk of focusing on specifications where a spurious null happens to be rejected. The authors are able to credibly commit to implementing adequate p-value adjustments. Second, the method reduces the risk of publication bias because journal editors decide whether to publish 6 One
could argue that additional hypotheses can be addressed in future research. But given the cost of collecting additional data and the long publication lag, this would unnecessarily delay the availability of evidence.
4
a paper before seeing the final results.7 This last benefit could also be achieved by PAPs if journal editors were willing to accept a paper on the basis of the quality of PAP design alone (Findley et al., forthcoming). To capture these features in a simple way, we imagine a situation in which the researcher wishes to test multiple hypotheses, without strong a priori information on which hypotheses are most relevant. In such a situation, it is common for researchers to adjust for multiple testing. We present results from simulations quantifying the tradeoff between reduced type I error and loss of power, compared to a situation where the researcher test hypotheses on the full sample using a PAP. In both cases we adjust for multiple testing. We show that when the researcher most wishes to learn from the data, the proposed split sample approach can dominate a PAP. The effect operates through a lower likelihood that relevant hypotheses are left untested and through a reduction in the number of tests that are implemented. Indeed, multiple comparison adjustments can induce a large reduction in power when using the full sample. The split sample approach allows the researcher to curtail the number of tests carried on the testing sample, and this compensates for the loss of power due to smaller sample size. This is because researchers decide on the few hypotheses to test based on initial work with the data which limits the loss of power associated with multiple testing adjustments. We also provide guidance on the optimal way of splitting the full sample into training and testing subsamples. Results presented in the paper indicate that in a large number of relevant empirical settings, the proposed method delivers more power than a PAP.
8
Effect sizes of 0.2
standard deviation can be detected with power comfortably above 80 percent as soon 7 Franco,
Malhotra and Simonovits (2014) take advantage of an NSF-sponsored program to quantify publication bias. They show that strong results are much more likely to be published. This effect is partially explained by the fact that researchers do not write up null findings (Franco, Malhotra and Simonovits, 2014), and partly by the fact that editors and referees are reluctant to publish null results. Publication bias is particularly damaging to meta-analyses since it generates an inflation bias. Our method offers a credible way of mitigating this bias. 8 The simulations assume that experimental data are available but the approach can be applied to observational data as well. This is important as concerns about p-hacking are more marked for observational studies than they are for experiments (Brodeur et al., 2016). Type I errors in observational studies can arise from both sampling variation - dealt with by splitting the data - and from misspecification of the estimating equations. Our proposed method offers more scope to reduce errors arising from the second source than standard PAPs because it allows researchers to incorporate feedback from a broader set of colleagues, editors, and referees. This is especially important for observational studies for which registering an estimation strategy without adequate feedback is inherently more risky.
5
as sample size is above 3,000. For a smaller effect size (e.g., 0.1 standard deviation), a sample of 10,000 observations or more is required. Results further suggest that the method increases the likelihood that relevant hypotheses are tested. Indeed, due to the expected loss in power associated with multiple testing adjustments researchers often limit the number of hypotheses included a PAP. In those situations, researchers are unable to learn from observations made during data collection and field experimentation. For effect sizes of .3 , we show that as long as there is a small likelihood that the relevant hypothesis isn’t included in the PAP, the split sample approach delivers more power for sample sizes above 2,000. The method is less attractive in situations where the viable sample size is small, e.g., in experiments with a costly treatment. We argue that the method is especially relevant as social sciences are entering the age of big data (Einav and Levin, 2014; Grimmer, 2015). Researchers now have access to large datasets from both the public and private sectors and are increasingly able to run experiments on a large number of subjects. Those datasets often contain a large number of potential outcome and control variables which creates great opportunities for exploring previously untestable hypotheses. It appears important to develop methods that deliver credible results (Hainmueller and Hazlett, 2013; Belloni, Chernozhukov and Hansen, 2014; Athey and Imbens, 2015). There are other ways by which spurious results can be published, but dealing with them is beyond the scope of this paper. For instance, our proposed method still delivers biased estimates if researchers use unreliable data, or faulty code and software. To illustrate, Bell and Miller (2015) could replicate Rauchhaus (2009)’s findings in STATA but not in R – an outcome they attribute to a problem in Stata. More perniciously, some researchers have been caught fabricating data. In line with current practice, we argue that the best way to deal with those issues is to ask researchers to make their code and data publicly available after publication. This would increase the likelihood that potential mistakes are quickly identified. The remainder of the paper is organised as follows. In Section 2, we discuss the statistical problem and the two procedures that we propose to solve it. Results from simulations are discussed in Section 3. Section 4 discuss some practical considerations. Section 5 concludes.
6
2
The statistical problem
We consider the following canonical setup. Researcher A is interested in estimating the effect of an exogenous treatment T (with T = 1 for half of the observations and T = 0 otherwise). She has access to a sample S of size N that includes a set of m potential outcome variables (yk )k=1,...,m . The m outcome variables can either capture different concepts, related concepts, or different ways of measuring the same concept. For example, the researcher may have access to individual data on voting behavior, vote buying, political knowledge, political interest, etc. Unsure of which aspects of voting behavior is affected by the treatment, the researcher can run regressions of the form: y k = a + bk T + u
(1)
Some of these null hypotheses (H0k : bk = 0) are true (m0 ), some are non-true (m m0 ).9 The researcher is interested in selecting a statistical procedure that maximises power while avoiding Type I errors. In the remainder of this section we compare two statistical procedures that can help the researcher reach her objective. We start by assuming that the researcher wants to reduce type I errors by controlling the Family Wise Error Rate (FWER). We then assume that the researcher wants to control the False Discovery Rate (FDR) instead. In the next Section we quantify the cost and benefits of both methods. The method we propose can be applied to any type of statistical test that corrects for FWER or FDR – for example, one could incorporate equivalence tests in the analysis (Hartman and Hidalgo, 2015). It offers no gain in power for methods that do not apply FWER or FDR corrections, however. But such methods are ill-suited to exploratory analysis, which is what our proposed method is designed for. To keep the exposition as clear as possible, we focus our presention the estimation of treatment effects through regression analysis. 9 There are alternative ways of thinking about this problem. Gelman et al. (2013) and Gelman (2015), for instance, approach the problem from a more Bayesian point of view. They assume that we live in a world where there are very few true zeros: most null hypotheses are non-true but most effect sizes are very small (Gelman et al., 2013; Gelman, 2015). Future research should explore how the proposed split sample approach could be adjusted to fit this perspective.
7
2.1
Controlling the Family Wise Error Rate
We now assume that the researcher is interested in maximizing power while controlling the Family Wise Error Rate (FWER). Definition 1 The Family Wise Error Rate is the probability of rejecting at least one true null hypothesis. The most basic way of controlling the FWER is to make Bonferoni adjustments: instead of rejecting H0 if the p-value is smaller than a, reject if it is smaller than a/m.10 The main issue is that the method is only valid if the researcher can keep track of all 0
tests she performed. If for example, the researcher ran m tests and attempt to control 0
the FWER as if only m tests had been carried out (with m < m ), the reported FWER will underestimate the actual FWER. As a result, we rule out that the researcher can implement the Bonferoni adjustments without a pre-analysis plan. 2.1.1
Procedure 1: Pre-Analysis Plan with Bonferoni corrections
Before having access to the data, the researcher can prepare and register a pre-analysis plan (Humphreys, Sanchez de la Sierra and van der Windt, 2013; Olken, 2015; Dunning, 2016). Such a plan lists the hypotheses to be tested and describes how they will be tested, including which variables to include, how they will be included, and how researchers intend to deal with the multiple comparison problems. The main drawback of PAPs is that they do not allow researchers to learn from the data, and this can slow down the pace of new discoveries. PAPs can only cover hypotheses that the researcher could think of before carrying out their experiment. There often are other testable hypotheses that the researcher did not think of beforehand. A number of social scientists have recently argued that some of their most important findings were the direct result of time spent with the data (Laitin, 2013; Gelman, 2014). For example, Simonsohn (cited by Laitin (2013)) argues that: "I also think of science as a process of discovery . . . Every paper I have [written] has some really interesting robustness, extensions, follow-ups that I would have never thought about at the beginning." Similarly, 10 Importantly
the Bonferoni adjustments are only valid if all null hypotheses are true (m = m0 ) and all tests are independent. It is well known that this correction tends to be very conservative and can lead to serious loss of power. Below we also discuss alternative p-values adjustments to correct for multiple testing.
8
Gelman (2014) states that "Many of my most important applied results were interactions that my colleagues and I noticed only after spending a lot of time with our data." To capture those constraints, we assume that the researcher picks a subset m0 of the m variables that might be affected by the treatment. This includes m00 true null hypotheses and (m0
m00 ) non-true null hypotheses. Those m0 variables are included the
PAP. A crucial parameter in this context is y: the likelihood that variables for which the null hypotheses is non-true are included in the PAP. To put it differently, y captures the degree of uncertainty surrounding the effects of T; or the degree of prior information available. Rejecting a given hypothesis in this set-up requires that the hypothesis is included in the subset m0 and that it is rejected on the full sample. Let a be the significance level used to test H0k and let dk be the standardized effect size for the m
m0 non-true null
hypotheses. Under our assumptions, power is given by: 1
PAP/Bon f bk
= y ⇤ F(dk
r
N 4
Z1
a 2m0
)
(2)
where F is the cumulative distribution function for the standard normal distribution. More details on the calculations are provided in the technical appendix. As the researcher implements m0 tests at level a/m0 she controls the FWER at level a. 2.1.2
Procedure 2: Sample split with Bonferoni adjustments
We now outline the main characteristics of the the split sample approach. More practical guidelines on how to implement the procedures are provided in Section 4. • Step 1: Guided by theory and existing evidence, researcher A puts together a
sample S including a number of variables that broadly captures the general set of hypotheses that she wants to test. The researcher also includes variables used to test for potential heterogeneous effects. This step is likely to include extensive data cleaning.
• Step 2: A third-party B randomly generates two non-overlapping subsets. If the
researcher is interested in studying particular subgroups the sample should be stratified accordingly. The first sub-sample (training sample) is sent back to A. The
9
third-party keeps the second one (testing sample). All relevant IDs are scrambled during the process so that A is unable to ‘reverse engineer’ the randomization. • Step 3: A runs regressions, presents the results at seminars and conferences, and refines the methodology based on feedback received.
• Step 4: The paper is submitted to a journal, referees make their comments and A amends her analysis in response, possibly several times.
The discovery process described by steps 3 and 4 identifies a final subset J of the m outcome variables. We call this the final methodology for analysis. One option is to select outcome variables for which we can reject the null of no effect at the a level in the training set, conditional on a choice of estimator, control variables, and standard error correction. • Step 5: Once the editor is satisfied that the estimation strategy is reliable, she accepts the paper conditional on the agreed upon final methodology for analysis. A
then secures the testing sample from B and applies the agreed upon methodology to it. The published version of the paper includes the results obtained from the testing sample with adequate p-values adjustments to deal with multiple testing. In essence, this final step allows researchers to perform a direct replication of their findings. We nonetheless recommend that the results from the training sample be made available as an appendix to the paper, e.g., for an interested (Bayesian) reader or for possible inclusion in a meta-analysis. Throughout we assume that the researcher starts with m possible null hypotheses. Of these, a subset J are found to be significant at the a level in the training set and interesting. This subset determines the list of tests estimated on the testing set. To illustrate, let m = 20 and imagine that, in the training sample, treatment is significant at the a = 5% level for seven of these 20 outcome variables. Then we only regress treatment on these seven outcome variables in the testing sample. For an hypothesis to be rejected, it is necessary that it be rejected first on the training sample, and then again on the testing sample. We assume that researchers allocate a share s of their data to the training sample and that they use significance level atr on the training sample and a on the testing sample. As the training and testing samples are independent, power becomes: 10
1
Split/Bon f bk
= F dk
r
sN 4
Z1
atr 2
!
F
dk
r
(1
s) N 4
Z1
a 2B
!
(3)
where B is the number of tests carried out on the testing sample. B corresponds to the number of rejections in the training sample, aggregating across both true positives and false positives. It is the sum of two binomial-distributed variables. The fist ◆◆ ✓ random ✓ q has distribution B(m0 , atr ); the second has distribution B m m0 , F dk sN Z1 atr . 4 2
Their sum is distributed according to: B ⇠ B(m0 , atr ) + B
m
m0 , F
dk
r
sN 4
Z1
atr 2
!!
(4)
As above the researcher implements B tests at level a/B and so she controls the FWER at level a. Setting a critical value for the training sample (atr ) involves trading off a larger number of rejections on the training sample for a lower probability of rejection on the testing sample due to multiple testing adjustment. The above formulas show that the optimal value of (atr ) is a function of the number of hypotheses, the number of true null hypotheses, the sample size, and the distribution of effect sizes across all hypotheses. Should a researcher be willing to assume the number of true null hypotheses and the distribution of effect sizes across all hypotheses in their data, the formulas can be used to numerically derive the optimal critical value for a particular sample size and number of tested hypotheses. 2.1.3
Recap
The relative benefits of both approaches - that we will quantify in Section 3 - are a function of two main parameters. First, if prior information about the expected effects of treatment T is low (i.e., y is close to zero) the loss of power associated with a preanalysis plan is greater and the sample split method becomes more appealing. This is because if researchers do not know which hypotheses are likely to be non-true then the pre-analysis plan is less likely to include the relevant hypotheses. To put it differently, we expect the split sample approach to be especially useful when carrying out exploratory work. Second, if N is large, researchers are less concerned about the loss
11
of power associated with the sample split and the method becomes more appealing.
2.2
Controlling the False Discovery Rate
We now assume that researchers are interested in maximizing power while controlling the False Discovery Rate (FDR). The concept, introduced Benjamini and Hochberg (1995), captures the idea that, in a number of relevant cases, it is acceptable to reject true null hypotheses as long as such rejections constitute a small share of total rejections. The intuition is that the decision-maker would reach the same conclusion regardless of whether or not those true null hypotheses are rejected. Definition 2 The False Discovery Rate is the expected proportion of errors among the rejected hypotheses. Benjamini and Hochberg (1995) proposed a method to control the FDR. The BH method proceeds as follows: 1. Carry out the m tests and get the associated p-values p1 , . . . , pm 2. Rank the p-values from smallest to largest p(1) , . . . , p(m) 3. Get k = Max {i | p(i) control the FDR.
i m q }.
q is the level at which the researcher would like to
4. Reject all H(i) for i k Benjamini and Yekutieli (2001) show that the method is conservative as it controls the FDR at level
m0 m q.
The proof relies on the fact that while for true null hypotheses
the p-values are uniformly distributed over [0, 1], they tend to be bunched towards 0 for non-true null hypotheses. As a result, when observing two p-values the hypothesis associated with the smallest one is more likely to be non-true. Simulations presented in Benjamini and Hochberg (1995) indicate that power is significantly larger than for methods that control the FWER. Benjamini, Krieger and Yekutieli (2006) extend the method to a two-stage procedure where the first stage is used to get an estimate of m0 . The sharpened q-values are obtained as follows:
12
0
1. Apply the BH procedure at level q = q/(1 + q). Let c be the number of hypotheses rejected. If c = 0, stop; otherwise, continue to step 2. ˆ0 = M 2. Let m
c 0
3. Apply the BH procedure at level q⇤ = q m/mˆ0 In the simulations we compare a pre-analysis plan with our sample split approach with sharpened q-values. The trade-offs are similar as before but both methods are expected to deliver higher power than when researchers wanted to control FWER.
3
Comparing the two procedures
3.1
Main results
We illustrate the method for the canonical setup described above. We compute power and FWER under the full sample approach with a PAP and the split sample approach.11 In both cases, we present results with Bonferroni adjustments. We show the sensitivity of power and FWER to variation in the following parameters: prior information (y); the sample size (N ); the standardized effect size (d); the number of tested hypotheses (m); the number of tested null hypotheses that are true (m0 ); and the share of the total sample that is allocated to the training set (s). We present results from applying the above formulas and simulation methods to various parameter values. To capture the idea that there are many more true null hypotheses than false ones (Ioannidis, 2005), we organize the simulations around the assumption that, out of 100 possible null hypotheses, only one is non-true, i.e., should be rejected. Hence, unless stated otherwise, the results presented below are based on m = 100 and m0 = 99. Given these parameter values, the majority of the results found significant are spurious. For instance, if a = 5%, there will on average be five false rejections and, provided that power is high enough, one true rejection in the training sample. For now we use a 50-50 split between the training and testing samples, i.e., we set s = 0.5. 11 Data
and replication files for this study are archived in the Political Analysis Dataverse (Fachamps and Labonne, 2017).
13
We organize our simulations around two stylized testing scenarios: (1) testing 10 null hypotheses on the full sample with Bonferroni corrections (with y = .25, .50, .50 or 1); (2) testing all 100 null hypotheses on the training sample, and only testing (with Bonferoni corrections) on the testing sample those null hypotheses that were significant in the training sample. We assume that we only test 10 hypotheses on the full sample to capture the idea the the researcher writes a pre-analysis plan. Role of N and y.
We start by investigating the effect of sample size on the power to
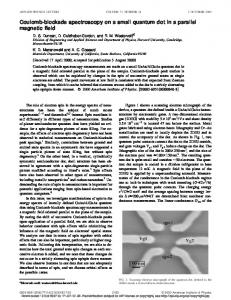
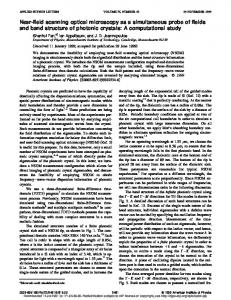
detect a true effect of size 0.2. In other words, we compute the likelihood of rejecting the null hypothesis when this hypothesis is false and the true effect is 0.2. Figure 1 plots power under the scenarios for sample sizes varying between 500 to 10,000. Power under the split sample approach is well above 0.8 for the kind of sample sizes of 3,000 or more that are commonly encountered in empirical work. Importantly, the PAP strictly dominates the split sample approach only when the amount of prior information is very high. In situations where y is lower, the split sample approach actually delivers more power than a PAP. If y = .75 the split sample dominates the PAP as soon as N is larger than 2,300. The split sample delivers more power than a PAP as soon as N is larger than 700 (resp. 1,500) when y is equal to .25 (resp. .50). Figures 2 and 3 plot similar results for different effect sizes of 0.1 and 0.3. Larger, but still relatively common, sample sizes are required to have power above 0.8 with smaller expected effect sizes (Figure 2). For example, with a small expected effect size of 0.1, raising power above 0.8 under the split sample approach requires sample sizes of 10,000 or more. As above, the split sample dominates a PAP for low values of y and medium sample sizes. Researchers’ Ability to Learn. As argued above, the split sample approach has an important benefit: it allows the researcher to test a large number of hypotheses with little loss in power. Using formulas for power discussed in Section 2.1, we can compute the value y⇤ at which the two methods yield similar power. In Figure 4, we plot the value of y⇤ for various effect sizes (.1, .2 and .3). For all values of y below the curve, the split sample approach delivers more power. In a large number of cases, y needs to be close to one for the full sample approach with a PAP to be superior (or equivalent)
14
1
Power
.8 .6 .4 .2 0 0
2000
4000 6000 Sample Size [Effect Size: .2]
Split sample Full sample (ψ=.75) Full sample (ψ=.25)
8000
10000
Full sample (ψ=1) Full sample (ψ=.50)
Figure 1: Comparing Power : Full Sample vs. Split Sample [Effect size = .2]
1
Power
.8 .6 .4 .2 0 0
2000
4000 6000 Sample Size [Effect Size: .1]
Split sample Full sample (ψ=.75) Full sample (ψ=.25)
8000
10000
Full sample (ψ=1) Full sample (ψ=.50)
Figure 2: Comparing Power : Full Sample vs. Split Sample [Effect size = .1]
15
1
Power
.8
.6
.4
.2 0
2000
4000 6000 Sample Size [Effect Size: .3]
Split sample Full sample (ψ=.75) Full sample (ψ=.25)
8000
10000
Full sample (ψ=1) Full sample (ψ=.50)
Figure 3: Comparing Power : Full Sample vs. Split Sample [Effect size = .3] to the split sample approach. For example, for effect sizes of .3 as soon as sample size is above 2,000, y needs to be one for the two approaches to yield similar results. Even with an effect size of .1 and a sample size of 7,000, y needs to be above .6 for the full sample approach with a PAP to dominate. This set of results thus confirms that the split sample approach increases researchers’ ability to learn from the data. Role of the number of variables (m). So far we have set m = 100 and m0 = 99. Next, we simulate what happens to power when we vary the total number of hypotheses that are being tested (m) and the number of non-true hypotheses (m0 ). The effect size that we are trying to detect is 0.2, as in Figure 1. Figure 5 shows our simulation results for scenario (2) – the split sample approach with Bonferroni correction applied to the testing sample results. Results show that power is a decreasing function of m and m0 . This is because the Bonferroni correction becomes more stringent as m or m0 increase. Role of the share of the total sample that is allocated to the training set (s). We also investigate whether it is optimal to split the sample 50-50 between training and testing sets. We continue to focus on scenario (2) – sample split with Bonferroni corrections – 16
Figure 4: Value of y at which the full sample approach with a PAP and the split sample approach yields the same power. 1
.8
ψ*
.6
.4
.2
0 0
2000
4000 6000 Sample Size Effect size .1 Effect size .3
8000
10000
Effect size .2
Note: y is the likelihood that the non-true hypothesis is in the set of tests included in the PAP.
1
Power
.8 .6 .4 .2 0 0
2000
4000 6000 Sample Size [Effect Size: .2]
m=10 & m0=9 m=100 & m0=90 m=1000 & m0=900
8000
10000
m=100 & m0=99 m=1000 & m0=990
Figure 5: Power Under the Sample Split Approach with Bonferroni Corrections: Number of variables 17
and we simulate power under alternative sample splitting rules, i.e., 30/70 and 70/30. The results, displayed in Figure A.1, indicate that, across all considered sample sizes, a 50/50 split delivers the best power. Role of the decision rule on the training sample.
Next, we investigate whether
power in the split sample approach with Bonferroni correction depends on the threshold level of significance used to select hypotheses in the training sample. So far we have assumed that this threshold is the same in the training and testing samples, i.e., a = 0.05. We now compare this situation to using a threshold of 0.1 when selecting hypotheses on the training sample. Three effect sizes are considered: 0.1, 0.2 and 0.3. We find that, for all three effect sizes, power appears to be marginally larger with a 0.05 threshold than a 0.1 threshold (Figure A.2). This is because applying a less restrictive threshold to the training sample increases the number of true null hypotheses that are rejected, and thus the number of hypotheses that are tested on the testing sample. A larger number of hypotheses means that a stronger Bonferroni correction is required on the testing sample, and this results in a loss of power. It is important to note that this finding is somewhat driven by our stated assumptions that m = 100 and m0 = 99. These assumptions are intended to capture the fact that there are many more true hypotheses than false ones Ioannidis (2005). However, in the extreme case m = m0 = 1, a higher threshold in the training sample will deliver higher power. FWER. Having compared the two statistical procedures - the PAP and the split sample approach - in terms of power, we now compare in terms of their ability to minimize the risk of false rejection. In Table 1 we compare the FWER under our two scenarios. Recall that the FWER is the probability of rejecting at least one true null hypothesis. As expected given that we use Bonferonni corrections, the FWER is below 5% under both methods.
3.2
Extensions
Controlling the FDR.
We now compare the two procedures if the researcher is in-
terested in controlling the FDR rather than the FWER. We run simulations computing q-values for m = 100, m0 = 90, d = .2 and sample sizes varying from 500 to 5,000 in 18
Table 1: Comparing the Family Wise Error Rate with the 2 methods m 10 100 100 1,000 1,000
FWER for: m0 Full Sample Split Sample 9 0.044 0.018 90 0.044 0.016 99 0.048 0.048 900 0.044 0.016 990 0.048 0.041
Notes: authors’ calculations.
100 increments using the method described in Section 2.2. We assume that half of the observations are allocated to the training set. For both the full sample and the split sample approach we compute power as the share of the 1,000 iterations for which the q-value is below .05. Results are available in Figure 6. As expected under both the full sample and the split sample approaches, power is higher when using sharpened q-values than when using Bonferroni corrections. In addition, power under the split sample approach is now above .8 as soon as sample sizes are larger than 2,000 observations. Importantly those results assume that y=1. Given the narrow gap between power with a PAP and power with the split sample approach, the split sample approach will dominate the PAP if y is below .5 for sample sizes of about 1,000 and if y is below .8 for sample sizes of about 2,000. Clustered samples.
Up to now we have assumed that researchers have access to an
unclustered sample (or that inter-cluster correlation is sufficiently low to be ignored). In a number of settings this assumption is likely to be violated and we now report results from simulations with clustered samples. In a sample with c clusters and an intra-cluster correlation coefficient of r power is given by: 1
bClustered = F(dk k
s
N 4 ⇤ (1 + ( c
1) r )
Z1
a 2
)
(5)
We can easily adjust the formula to obtain power both for the full sample approach and the split sample approach with Bonferroni corrections. As before, we run 10,000 simulations. We compute power for sample sizes varying from 500 to 10,000 with 20 observations per clusters. We assume that r is either .05 or .1. To ensure that the 19
1
Power
.8
.6
.4
.2
0 0
1000
2000 3000 Sample Size
Full sample (q-value)
4000
5000
Split sample (q-value)
Figure 6: Comparing Power with Sharpened q-values: Full Sample vs. Split Sample [Effect size = .2] two samples are independent we sample full clusters rather than individuals within clusters. The sample split therefore leads to the loss of half of the clusters rather than to the loss of half of the observations per cluster. Results are available in Figure A.3. As expected power is lower than what it is with an unclustered sample. For example, with r = .05 power is above .8 with the split sample approach for samples of 5,000 observations and more. If r = 1, sample sizes of about 8,000 are required for power to be above .8. Sub-group analysis
The approach proposed here should apply equally well to sub-
group analysis - analyses of a sub-sample/subset of the target population. To see this, one can simply think of a treatment effect regression on a sub-group as a separate regression with its own outcome variable (i.e., the outcome in the sub-group). It is immediately apparent that the smaller the sub-group is, the less informative the data will be, and the more results can be expected to vary between training and testing sample. In other words, sub-group analysis is where power issues are most stringent, and thus where our method can prove particularly useful – provided that the sub-group samples do not become too small relative to the effect size of interest. The simulations reported here can be used a guide for deciding when sub-group analysis will not be 20
helped by a sample-split approach. Correlated outcomes So far we have assumed that all outcomes are uncorrelated. In many situations it is likely that some outcomes will be correlated, e.g., because different outcome variables together capture a general concept or behavior. In those situations, researchers can aggregate the outcomes into adequately defined indices (Anderson, 2008). The split sample approach outlined here can be applied to these indices as well, although the gain in terms of power is likely to be smaller: (i) aggregating outcome variables into indices reduces the number of tested outcomes, mechanically reducing the loss of power due to corrections for multiple hypotheses testing corrections; and (ii) if constructed indices are less likely to be left out of the core analysis, this raises our parameter y, which also reduces the gain from the split sample approach. If the researcher is unwilling to postulate the existence of relevant indices, it is possible to conduct the analysis on the training sample as outline here, but then apply to the testing sample a multiple hypotheses adjustment that accounts for correlation in outcome variables. The split sample approach applies to those cases as well and delivers similar benefits. The main difference is that, when outcomes are correlated, test results on the training sample are likely to be correlated as well, leading to groups of outcome variables being either dropped together, or kept in the training sample together - at which point a multiple hypotheses adjustment can be applied to account for the correlation in outcomes. For instance, Sankoh, Huque and Dubey (1997) propose a method to control the FWER without being too conservative, while Benjamini and Yekutieli (2001) offer a method that controls the FRD even when the tests have positive regression dependency. Controlling Referee Degrees of Freedom
In political science, referees and editors
take a very active role in defining the paper’s methodology. They often suggest alternative estimation strategies, alternative outcome variables, and alternative sub-group analyses. In particular they are often interested in seeing evidence of mechanisms (e.g., does the variable of interest affect a related concept?). By design, those additional analyses can’t be incorporated in a PAP and so they are subject to the potential criticism of data mining, due to what Pepinsky (2013) refers to as referee degree of freedom.
21
In the split sample approach, once researchers have been invited to revise and resubmit a paper, they will attempt to find a variable Y that can be considered to proxy for the related concept introduced by the referees and for which they can reject the null. The issue is whether the additional hypothesis that the referee wants the researchers to explore is true (in the sense that it should not be rejected). Let’s call f that likelihood and g the likelihood that the researchers find a Y for which they can reject the null. Under the full sample approach, the probability that an error is made is then f ⇤ g. Under the split sample approach, the probability that an error is made is 0.05 ⇤ g. So as
long as f is larger than 0.05, the split sample approach yields fewer type I errors than a PAP once the editorial process has been taken into account.
4
Practical considerations and additional benefits
We now discuss a number of important practical considerations to ensure that the split sample procedure delivers credible results.
4.1
Credible implementation
To ensure maximum credibility, we argue that the third party needs to be involved early on in the process. In particular, we recommend that a professional association such as APSA - sets up a website where the data collection team can upload the data before the research team gets access to it. The researcher would then get access to a version of the dataset without the treatment dummy for a round of data cleaning. Once the data are cleaned, the random sample split is carried out and the research team is able to download the training sample. The method is most useful for situations where researchers can credibly commit not to have seen the data before sending to a third party. This is consistent with the challenges faced by researchers writing PAPs. We expect this to be possible in a broad and diverse set of research areas. First, there are cases in which researchers are involved in setting up data collection but rely on an intermediary to collect the data. In such a situation, researchers would ask the data collection intermediary to deposit it with the above mentioned website.
22
This potentially applies to a large number of field experiments implemented in developing countries as well as to research projects involving data collected online (e.g., experiments carried out through MTurks). Second, the method can also be applied by researchers using either proprietary data or non-publicly available administrative data. The solution here is to arrange for the owner of the data to only send a random sample of it. Researchers would only have access to the remainder of the data in Step 5 discussed in Section 2.1.2. Third, the method is also applicable in some situations where new survey data is collected, e.g., data collected in relation to the Election Research Preacceptance Competition that the Centre for Open Science organised with the 2016 American National Election Studies (ANES) data.12 There nonetheless remain a number of research situations for which our method is not, at this point, implementable in a fully credible manner. For example, the approach is not currently applicable to research using publicly available data such as the Current Population Survey (CPS) collected by the US Census Bureau, The Demographic and Health Surveys (DHS) or data from the Living Standards Measurement Study (LSMS) available through the World Bank. If the split sample approach were to be become standard, however, access to new rounds of data could be organized to facilitate split sampling, as for proprietary data. The approach is also not readily suitable for researchers running their own lab experiments. Yet experimental laboratories could easily embargo the data collected in their facilities to facilitate subsequent split sample analysis. One area in which split sample analysis is not, by construction, applicable is the reanalysis of data that have been released after publication. Data reanalysis, however, typically serves a objective different from split sampling, namely, that of verifying the reliability and robustness of the published results.
4.2
Cost implications
Researchers might be concerned about the cost implications of the method. However, as the analysis in the paper makes clear, once we take into account the risk that important hypotheses are left untested. In a number of cases, power will actually be higher than under a pre-analysis plan. In addition, as discussed above, the method can be 12 More
information is available at: http://www.erpc2016.com (visited on January 6, 2017).
23
combined with a PAP. For example, if the researcher has strong prior that the treatment has an effect on a subset of the variables she could submit a code to estimate those equations on the full sample - with the appropriate p-value adjustments. If those results are important to guide future research the team could get access to those results when they receive the training sample.
4.3
Implications for the publication process
First, some might worry that the publication process will be bit longer as researchers have to implement the final methodology on the testing sample once the paper has been accepted for publication. We don’t think that those delays will be significant however. Indeed, all the code would have been written and so running it on the testing sample should be relatively fast. In addition, allowing referees and editors to have a significant input in the finalization of the methodology might reduce the number of robustness checks that are carried out as the results will be less likely to be type I errors. This could actually speed up the publication process. Relatedly, researchers might be worried that others will try to scoop them. As long as the potential delays discussed above are kept in check we do not think that the risk of scooping are greater than when researchers prepare a PAP. Indeed, results and draft papers will be available and presented at the same time as they would be if the researchers were to prepare a PAP. Second, as indicated above, we expect that researchers, editors and referees will play an active role in selecting hypotheses to test on the testing sample. Some of the rejected hypotheses on the training sample might neither be interesting or relevant and thus won’t be tested on the testing sample. Conversely, some important hypotheses might fail to be rejected in the training sample but might still be tested on the testing sample. Third, editors should be less reluctant to accept a paper based on results from the training set than from a PAP design. Indeed, the split sample approach provides more information about the findings and, in the case of a RCT, about the quality of implementation. The strength of the main results and associated robustness checks on the training sample provide some information as to whether they will hold on the testing sample. In addition, one can make a case that, for well thought through hypotheses, 24
precisely estimated zeroes should be published (as opposed to underpowered studies) and results from the training set provide useful information on the study’s statistical power. Fourth, even in cases where the editor requires to see the results on the testing sample before accepting the paper, the authors can register a PAP containing all relevant details before running the regressions on the testing sample. If the editor declines to publish the paper after seeing the results, this would allow authors to have a record of a pre-registered design when they submit the paper to another journal. That PAP would likely be superior to the one that researchers would have prepared on their own.
5
Conclusion
In this paper we contribute to the nascent literature on ways to increase the likelihood that published findings are true. We investigate the effectiveness of a method that can be applied to both new and existing datasets. The method relies on a third-party randomly splitting the data in two non-overlapping subsets. Researchers use the first half to refine their research plan, present their findings during seminars and conference and submit them to journals. Once the paper is accepted, the precise research plan is then implemented on the second half and this is the set of results that are published. We find that, in a large number of empirically-relevant settings, the proposed method delivers more power than a pre-analysis plan. This is because the researchers are able to learn from the data and thus the likelihood that relevant hypotheses are left untested is lower than under a PAP. For this reason we encourage researchers to adopt the approach, especially for natural and quasi-experiments relying on large datasets. In the context of controlled experiments (e.g., RCTs or lab experiments), researchers may find it useful to combine our approach with a PAP. For hypotheses over which they have strong priors, researchers could file a PAP. But they could still use the split sample approach to test other, more exploratory hypotheses. More generally, the split sample approach is likely to be most useful when writing out a standard PAP is costly, either because the sequence of analysis is difficult to describe beforehand, or because of ex ante uncertainty about potential outcome variables.13 13 These conditions are not dissimilar from those in which an incomplete contract is optimal – a finding
25
We believe that a professional association or journal may find it useful to set up and maintain an online platform where researchers can upload their dataset and have someone carry out sample splitting. The method can, in some cases, also be implemented by researchers working with proprietary data, e.g., researchers can send their anonymized dataset with garbled variable names to the third party. While the paper outlines an important avenue through which more credible empirical results that can be implemented, it leaves open some questions and points to avenues for further research. Many of these questions are directly related to the procedure and were raised in the body of the paper: How should an optimal critical value on the training sample be selected? What kind of multiple testing correction should be implemented on the testing sample? How can data collection methods be made credibly amenable to split sampling? Other questions relate to the implemention of the method in a Bayesian framework. More broadly, research is needed to derive “optimal” contracts between researchers, editors and referees that can credibly minimize pre-testing and publication bias in the presence of imperfect information and commitment. The simulations presented in the paper indicate that our method dominates a PAP with FWER corrections. But we have not established that no alternative method exists that dominates both approaches. It may be possible to come up with a decisiontheoretic model tailored to the inference issues discussed here, for instance using a Bayesian approach with pre-commitment. While such approach could yield some gains in terms of efficiency and power, at this point it is unclear how it could be implemented at a reasonable cost in terms of analytical derivation, coding, and computer time. Until such method is made available, our approach offers the advantage of being easy to understand and simple to implement
that is not incongruous since, ultimately, a PAP is a form of contract between the researcher and the reader.
26
References Anderson, Michael L. 2008. “Multiple Inference and Gender Differences in the Effects of Early Intervention: A Reevaluation of the Abecedaian, Perry Preschool, and Early Training Projects.” Journal of the American Statistical Association 103(484):1481–1495. Athey, Susan and Guido Imbens. 2015. “Machine Learning Methods for Estimating Heterogeneous Causal Effects.” mimeo, Stanford University . Bell, Mark and Nicholas Miller. 2015. “Questioning the Effect of Nuclear Weapons on Conflict.” Journal of Conflct Resolution 59(1):74–92. Belloni, Alexandre, Victor Chernozhukov and Christian Hansen. 2014. “HighDimensional Methods and Inference on Structural and Treatment Effects.” Journal of Economic Perspectives 28(2):29–50. Benjamini, Yoav, Abba M. Krieger and Daniel Yekutieli. 2006. “Adaptive linear step-up procedures that control the false discovery rate.” Biometrika 93(3):491–507. Benjamini, Yoav and Daniel Yekutieli. 2001. “The Control of the False Discovery Rate in Multiple Testing Under Dependency.” The Annals of Statistics 29(4):1165–1188. Benjamini, Yoav and Yosef Hochberg. 1995. “Controlling the False Discovery Rate: A Pactrical and Powerful Approach to Multiple Testing.” Journal of the Royal Statistical Society. Series B (Methodological) 57(1):289–300. Blair, Graeme, Jasper Cooper, Alexander Coppock and Macartan Humphreys. 2016. “Declaring and Diagnosing Research Designs.” Columbia University, mimeo . Brodeur, Abel, Mathias Le, Marc Sangnier and Yanos Zylberberg. 2016. “Star Wars: The Empirics Strike Back.” American Economic Journal: Applied Economics 8(1):1–32. Coffman, Lucas C. and Muriel Niederle. 2015. “Pre-Analysis Plans are not the Solution Replications Might Be.” Journal of Economic Perspectives 29(3):81–98. Dunning, Thad. 2016. “Transparency, Replication, and Cumulative Learning: What Experiments Alone Cannot Achieve.” Annual Review of Political Science 19(1):S1–S23. Einav, Liran and Jonathan Levin. 2014. “Economics in the age of big data.” Science 346(6210):715. Fachamps, Marcel and Julien Labonne. 2017. “Replication Data for "Using Split Samples to Improve Inference on Causal Effects".”. URL: http://dx.doi.org/10.7910/DVN/Q0IXQY, Harvard Dataverse, V1 Findley, Michael G., Nathan M. Jensen, Edmund J. Malesky and Thomas B. Pepinsky. forthcoming. “Can Results-Free Review Reduce Publication Bias? The Results and Implications of a Pilot Study.” Comparative Political Studies .
27
Franco, Annie, Neil Malhotra and Gabor Simonovits. 2014. “Publication bias in the social sciences: Unlocking the file drawer.” Science 345(6203):1502–1505. Gelman, Andrew. 2014. “Preregistration: what’s http://andrewgelman.com/2014/03/10/preregistration-whats/ .
in
it
for
you?”
Gelman, Andrew. 2015. “The Connection Between Varying Treatment Effects and the Crisis of Unreplicable Research.” Journal of Management 41(2):632–643. Gelman, Andrew, John Carlin, Hal Stern, David Dunson, Aki Vehtari and Donald Rubin. 2013. Bayesian Data Analysis, Third Edition. Chapman and Hall/CRC. Gerber, Alan and Neil Malhotra. 2008. “Do statistical reporting standards affect what is published? Publication bias in two leading political science journals.” Quaterly Journal of Political Science 3(3):313–326. Gerber, Alan S., Donald P. Green and David Nickerson. 2001. “Testing for Publication Bias in Political Science.” Political Analysis 9(4):385–392. Green, Don, Macartan Humphreys and Jenny Smith. 2013. “Read it, understand it, believe it, use it: Principles and proposals for a more credible research publication.” Columbia University, mimeo . Grimmer, Justin. 2015. “We Are All Social Scientists Now: How Big Data, Machine Learning, and Causal Inference Work Together.” PS: Political Science & Politics 48(1):80–83. Hainmueller, Jens and Chad Hazlett. 2013. “Kernel Regularized Least Squares: Reducing Misspecification Bias with a Flexible and Interpretable Machine Learning Approach.” Political Analysis 22(2):143–168. Hartman, Erin and F Daniel Hidalgo. 2015. “What’s the Alternative?: An Equivalence Approach to Balance and Placebo Tests.” UCLA, mimeo . Humphreys, Macartan, Raul Sanchez de la Sierra and Peter van der Windt. 2013. “Fishing, Commitment, and Communication: A Proposal for Comprehensive Nonbinding Research Registration.” Political Analysis 21(1):1–20. Ioannidis, John. 2005. “Why Most Published Research Findings Are False.” PLOS Medicine 2(8):e124. Laitin, David D. 2013. “Fisheries Management.” Political Analysis 21:42–47. Leamer, Edward. 1974. “False Models and Post-Data Model Construction.” Journal of the American Statistical Association 69(345):pp. 122–131. Leamer, Edward. 1978. Specification Searches. Ad Hoc Inference with Nonexperimental Data. New York, NY: Wiley.
28
Leamer, Edward. 1983. “Let’s Take the Con out of Econometrics.” American Economic Review 73(1):31–43. Lin, Winston and Donald P. Green. 2016. “Standard Operating Procedures: A Safety Net for Pre-Analysis Plans.” PS: Political Science & Politics 49(3):495–500. Lovell, M. 1983. “Data Mining.” Review of Economic and Statistics 65(1):1–12. McConnell, Brendon and Marcos Vera-Hernández. 2015. “Going beyond simple sample size calculations: a practitioner’s guide.” IFS Working Paper W15/17 . Miguel, E., C. Camerer, K. Casey, J. Cohen, K. M. Esterling, A. Gerber, R. Glennerster, D. P. Green, M. Humphreys, G. Imbens, D. Laitin, T. Madon, L. Nelson, B. A. Nosek, M. Petersen, R. Sedlmayr, J. P. Simmons, U. Simonsohn and M. Van der Laan. 2014. “Promoting Transparency in Social Science Research.” Science 343(6166):30–31. Monogan, James E. 2015. “Research Preregistration in Political Science: The Case, Counterarguments, and a Response to Critiques.” PS: Political Science & Politics 48(3):425–429. Nyhan, Brendan. 2015. “Increasing the Credibility of Political Science Research: A Proposal for Journal Reforms.” PS: Political Science & Politics 48(S1):78–83. Olken, Benjamin. 2015. “Pre-Analysis Plans in Economics.” Journal of Economic Perspectives 29(3):61–80. Pepinsky, Tom. 2013. “The Perilous Peer Review http://tompepinsky.com/2013/09/16/the-perilous-peer-review-process/ .
Process.”
Rauchhaus, Robert. 2009. “Evaluating the Nuclear Peace Hypothesis A Quantitative Approach.” Journal of Conflict Resolution 53(2):258–277. Sankoh, A. J., M. F. Huque and S. D. Dubey. 1997. “Some comments on frequently used multiple endpoint adjustment methods in clinical trials.” Statistics in Medicine 16(22):2529–2542. Wittes, Janet. 2002. “Sample Size Calculations for Randomized Controlled Trials.” Epidemiologic Reviews 24(1):39–53.
29