Using Structure Indices for Efficient Approximation of Network Properties Matthew J. Rattigan
Marc Maier
David Jensen
Knowledge Discovery Laboratory Department of Computer Science University of Massachusetts Amherst
Knowledge Discovery Laboratory Department of Computer Science University of Massachusetts Amherst
Knowledge Discovery Laboratory Department of Computer Science University of Massachusetts Amherst
[email protected]
[email protected]
[email protected]
ABSTRACT Statistics on networks have become vital to the study of relational data drawn from areas such as bibliometrics, fraud detection, bioinformatics, and the Internet. Calculating many of the most important measures—such as betweenness centrality, closeness centrality, and graph diameter—requires identifying short paths in these networks. However, finding these short paths can be intractable for even moderate-size networks. We introduce the concept of a network structure index (NSI), a composition of (1) a set of annotations on every node in the network and (2) a function that uses the annotations to estimate graph distance between pairs of nodes. We present several varieties of NSIs, examine their time and space complexity, and analyze their performance on synthetic and real data sets. We show that creating an NSI for a given network enables extremely efficient and accurate estimation of a wide variety of network statistics on that network.
Categories and Subject Descriptors H.2.8 [Database Applications]: Data mining H.3.1 [Content Analysis and Indexing]: Indexing methods
General Terms
Finding short paths is not just an amusing diversion. Over the past several decades, social scientists and mathematicians have devised several useful measures that can be calculated on the nodes of a network, each of which is derived from the nodes’ participation in short paths. Two of the best-known measures are betweenness centrality—the proportion of all shortest paths in the network that run through a given node—and closeness centrality—the average distance from the given node to every other node in the network [9]. For example, centrality measures can help evaluate whether Mr. Bacon lies near the center of the Hollywood universe or whether he is near the periphery. Several researchers have used such measures to construct statistical models of networks [10][17]. Recent work in knowledge discovery has begun to study very large networks, often comprising millions of nodes. Given networks of this size, even the most efficient algorithms for calculating network statistics can become intractable. For example, the most efficient known algorithms for calculating betweenness centrality and closeness centrality are O(ne+n2logn), where n and e are the number of nodes and edges in the graph [3]. Ad hoc calculations that use basic path finding can have even higher complexity, as they require bidirectional breadth-first search.
Algorithms, Measurement
Keywords Network structure index, social network analysis, knowledge discovery in graphs, centrality
1. INTRODUCTION “Six Degrees of Kevin Bacon” is a popular trivia game that challenges players to find a path of co-star relationships that connect a given actor with Kevin Bacon, a popular American performer who has appeared in over 50 movies [27]. Given the actor Raul Julia, for example, players might produce the path Raul Julia – Christina Ricci (“The Addams Family”) – Winona Rider (“Mermaids”) – Christian Slater (“Heathers”) – Kevin Bacon (“Murder in the First”). The game is an application of a classic problem in computer science: finding short paths between nodes in a graph. Permission to make digital or hard copies of all or part of this work for personal or classroom use is granted without fee provided that copies are not made or distributed for profit or commercial advantage and that copies bear this notice and the full citation on the first page. To copy otherwise, or republish, to post on servers or to redistribute to lists, requires prior specific permission and/or a fee. KDD'06, August 20–23, 2006, Philadelphia, Pennsylvania, USA. Copyright 2006 ACM 1-59593-339-5/06/0008...$5.00.
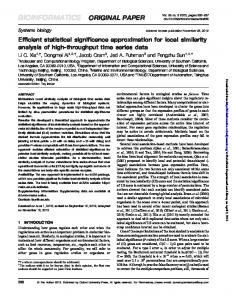
Figure 1: The average number of nodes explored by bidirectional breadth-first search increases dramatically as path length increases. The inset graph shows the distribution of shortest path length. Both graphs are based on the Rexa citation graph (see Appendix A for details).
For instance, consider the Rexa citation graph of papers in computer science and related fields (see Appendix A for details). The largest connected component contains 165,000 nodes (papers) connected by 321,000 edges (citations). Figure 1 depicts the distribution of shortest (optimal) path lengths between pairs of nodes (inset), along with the average number of nodes explored by a bidirectional breadth-first search that discovers these paths. On average, identifying a path of median length with breadth-first search requires the exploration of hundreds of nodes, while finding a path of length 15 requires the exploration of 65,000 nodes. Calculations that require finding many of these paths become cumbersome, if not impossible. Below, we introduce the concept of a network structure index (NSI), a tool that enables efficient path finding in large relational datasets. We present several varieties of NSIs, examine their time and space complexity, and analyze their performance on synthetic and real data. Finally, we show that creating an NSI for a network enables extremely efficient and accurate estimation of a wide variety of graph statistics on that network.
2. THE STRUCTURE INDEX A network structure index is similar to the type of index commonly used to speed queries in modern database systems. An NSI can be constructed once for a given graph and then used to speed the calculation of dozens or hundreds of subsequent measures on the graph. The intuition behind NSIs is provided by previous work that has shown that path finding can be surprisingly efficient in a network that exhibits homophily, the tendency of neighboring nodes to have similar attribute values [1]. Unfortunately, many networks do not “naturally” have attributes that exhibit homophily. However, we can synthetically generate and annotate any arbitrary graph with such an attribute and use it for pathfinding in the same way that destination and mileage signs improve navigation in a 2D Euclidean space of roadways. An NSI consists of two components. The first is a set of node annotations that provides information about relative or absolute location. Formally, for a graph G consisting of vertices V and edges E, the annotations define a function A: V→ S, where S is an arbitrarily complex “annotation space.” The second element of the structure index is a distance measure D: S × S → ℜ that maps pairs of node annotations to a positive real number. We do not require our distance measure D to be unbiased (or even a metric). As a result, we forfeit any optimality guarantees associated with admissible search, and the paths we find are not necessarily optimal. However, in practice, search using our best NSIs returns paths that are both short and sufficient for a wide variety of applications. Our annotation space S can be quite simple (e.g., a single value for each node) or complex (e.g., multidimensional vectors of values). As with database indices, the key is to balance the complexity of the annotation process with its utility. In the following sections, we present several examples of NSIs. For each, we consider the time and space required to build and store the annotations, the time complexity of using the index, and the performance characteristics of the index. An NSI can be used directly to approximate graph distance (hop count), or it can be combined with a search algorithm to discover short paths between any two nodes in a graph. We explore both approaches in this paper. In our experiments that use the latter method, we use best-first search, queuing nodes according to their annotation distance D from the target in a manner similar to
Goldberg [11]. In the case where multiple nodes have the same D value, we select the node with the largest degree. When using an NSI for pathfinding, we use the first path discovered between the origin and destination nodes, rather than continuing to explore alternative routes.
2.1 ALL PAIRS SHORTEST PATH (APSP) Among the most basic NSIs is the ALL PAIRS SHORTEST PATH (APSP) index, consisting of an n×n matrix (n = |V|) containing the optimal path distances between all pairs of nodes. The accompanying distance function is a simple lookup into this table. While this strategy yields optimal results when searching for paths, in many cases it may be infeasible in terms of annotation complexity—the Floyd-Warshall algorithm runs in O(n3) [8], while more complex approaches using fast matrix multiplication can reduce the exponent to 2.376 [5]. Furthermore, APSP requires O(n2) to store the distances themselves. Although APSP may seem trivial, the use of structure indices is a general approach, not specific to a single implementation or annotation scheme. Any NSI trades off complexity and performance, and APSP represents an extreme on both scales.
2.2 DEGREE The DEGREE NSI represents the opposite ends of the complexity and performance spectra from APSP. In this scheme, we simply annotate each node with its undirected degree within the graph. To calculate the annotation distance between a source nodes s and target t, we define the following function:
DDegree (s,t) = 2n " degree(s) " degree(t) Thus when navigating the graph with a best-first search we will always judge the unexplored node with the highest degree to be closest to the target node [1]. While simple to construct and store ! for both time and space complexity), the DEGREE NSI does (O(n) not perform well in practice, as we show in Section 3.
2.3 LANDMARK METHODS Previous work in network path finding has utilized a system of network landmarks to efficiently navigate graph structure [4][11][18]. With this technique, we randomly designate a small number of nodes in the network to serve as navigational beacons. Then, we annotate nodes in the graph by flooding out from each landmark and recording the graph distance to each node in the network. The resulting annotation for each node is a vector of graph distances, with each landmark defining an independent annotation “dimension.” An illustration of this type of annotation is shown in Figure 2. The distance measure D is defined as follows:
DLandmark (s,t) = MIN[d(s,l) + d(l,t)] l "L
Where L is the set of landmark nodes, and d() is the exact shortest-path distance between nodes. Unfortunately, this strategy performs rather poorly in practice. Many of today’s “small-world” ! data sets are characterized by small diameters due to the existence of “short cut” links in the graph [13][26]. As a result, a found path that passes through a landmark often forms two sides of a triangle, resulting in artificially long paths. Global Network Positioning (GNP) is a related strategy developed by Ng and Zhang [18]. This annotation technique utilizes a nonlinear optimization algorithm to create a multidimensional coordi-
nate system that encodes the location of each node within the network. The associated distance measure is simply the Manhattan distance (L1 norm) between node pairs:
DGNP (s,t) = # c d (s) " c d (t) d
Where d is the number of dimensions (|L|-1) in the computed space, and ci(x) is the ith coordinate (0 ≤ i < d) of node x. While the computational cost of GNP appears to be prohibitive for large ! networks (a separate optimization over d parameters must be performed for each node, in addition to an optimization over d2 parameters for each landmark), we include it here to enable comparison with current work in the networking literature.
The most effective method we discovered for creating dimensions is a competitive flooding algorithm that is both incremental and randomized. The algorithm works as follows: 1. 2. 3.
Randomly select k seed nodes, assign them zone labels 1 through k, and place them in the labeled set L. Place all other nodes in the unlabeled set U. While U is not empty a. Randomly select a node l from the labeled set, and one of its unlabeled neighbors u. b. Assign u to the same zone as l and move it to the labeled set L.
This entire process is repeated d times, providing us with d sets of zones. Thus each node is annotated with a d-dimensional vector of zone labels. The annotation distance between two zone vectors is defined as the number of pair-wise matches.
#1 if zone d (s) = zone d (t), DZone (s,t) = 1" & $ d 0 otherwise d %
Figure 2: A LANDMARK NSI annotates nodes with distances to landmark nodes (here, node B). Each additional landmark provides a separate “dimension” of annotations.
2.4 ZONES The ZONE NSI utilizes multiple dimensions, where each dimension divides the graph into regions that are connected, mutually exclusive, and collectively exhaustive (see Figure 3 for an example). Each dimension is analogous to the way that a state in the U.S. is divided into counties or voting precincts. As the number of dimensions grows, each node becomes distinguishable from other nodes based on its zone memberships.
Figure 3: A ZONE NSI divides the set of nodes into disjoint regions (annotated here with a 1, 2, or 3). ZONE NSIs typically use multiple, independently derived zone designations; this example depicts only one dimension. We explored several methods for creating each dimension of a ZONE NSI. Two key criteria for selecting a method are (1) its ability to generate dimensions independently, and (2) its ability to create zones of roughly equal size. To a first approximation, independent dimensions are more useful for indexing than correlated dimensions, and equal-size zones in a dimension contain the most information. However, generating dimensions that meet both criteria can be challenging in graphs with a highly variant degree distribution.
A key characteristic of this algorithm is that it labels only a single unlabeled neighbor of each labeled node at each step. Labeling all neighbors creates zones of unequal size resulting in dimensions ! that tend to be highly correlated. Labeling only a single neighbor creates zones of nearly equal size and reduces correlation among dimensions. The time complexity of the annotation process is O(ed), where e is the number of edges |E| in the graph and d is the number of independent graph labelings or dimensions in annotation space. Storing the zone for each node and dimension takes O(nd) space. The savings over the APSP example above are significant in both regards.
2.5 DISTANCE TO ZONE The DISTANCE TO ZONE (DTZ) annotation scheme is a hybrid approach that combines the LANDMARK and ZONE strategies. The annotation procedure (1) divides the graph into zones using the flooding algorithm described above; and (2) for each node u and zone Z, calculates dtz(u, Z): the distance from u to the closest (in terms of hop count) node in Z.
Figure 4: A DTZ NSI uses both zones and distance to zones as annotations. Here we see an example for a single dimension with three zones. In Figure 4, node A has zone distances of 1, 0, and 2 for the white, light gray, and dark gray zones respectively, while node D has corresponding distances of 1, 1, and 0. As with the ZONE model, we repeat the entire process d times to produce several dimensions of annotation space, and sum over all dimensions to calculate annotation distance.
Figure 5: Path ratio and exploration ratio of several NSIs on three canonical network types as the dimensionality of the indices changes. The ZONE and DTZ NSIs utilize 50 regions per dimension. Results were averaged over multiple synthetically generated networks of 10,000 nodes. In all cases, lower values are better. The annotation distance between nodes s and t is defined as:
DDTZ (s,t) = " dtz d (s, zone(t)) + dtz d (t, zone(s)) d
Note that the values of dtz(s, zone(t)) and dtz(t, zone(s)) may differ, as the random flooding process does not produce symmetric distances between nodes and zones. For the one-dimensional ! case in Figure 4, the total distance-to-zone value for the pair (E, F) is dtz(E, dark gray) + dtz(F, light gray) = 1 + 2 = 3. The resulting set of node annotations takes up O(nkd) space. Calculating the distance of each node from a single zone requires an O(e) flood, resulting in a total time complexity of O(ekd). Note that for large values of k and d, the space and time requirements can exceed the O(n2) space and O(n3) time needed for the APSP index. In practice, however, we can find near-optimal paths in very large graphs with relatively small numbers of zones and dimensions.
3. SEARCH PERFORMANCE We measure the optimality of the lengths of the paths found by a particular NSI by the path ratio P: r
P = " p fi i=1
r
"p
oi
i=1
Where pf and po are the lengths of the found and optimal paths for r randomly selected pairs of nodes in the graph. An NSI that finds
!
optimal paths (such as APSP) will have P = 1.0, while a poorly performing NSI will produce a value of P >> 1.0. This measure weights the contribution of long paths more than short ones, but short-to-medium-length paths are much more frequent in all the graphs we evaluate. If traversal time is proportional to path length, and paths between all pairs of nodes are equally likely to be requested, then P is an unbiased estimator of overall performance. The most important benefit of using an NSI for path finding is the decrease in search complexity for applications that rely on finding paths. Unless we can dramatically improve search performance, it is difficult to justify the computational and storage costs of building the index. To measure this performance gain, we define the exploration ratio E: r
E = " e fi i=1
r
"e
bi
i=1
Where ef is the number of nodes explored by best-first search using our structure index, and eb is the number of nodes that are explored using a bidirectional breadth-first search for r pairs of nodes. Here, values close to zero reflect parsimonious search per! formance, and values greater than 1.0 indicate pathologically poor search performance. We evaluate the NSIs from Section 2 on synthetic graphs of 10,000 nodes generated using three models: random networks as defined by Erdős and Rényi [6], rewired lattices defined by Watts and Strogatz [26], and the Forest Fire graph model recently intro-
duced by Leskovec et al. [16]. (See Appendix A for more detail on the network generation procedures.) In Figure 5, we compare the performance of DEGREE, LANDMARK, GNP, ZONE, and DTZ when implemented with increasing numbers of dimensions. Since the APSP index will always behave optimally, we omit the results from the figures. Several features of the plots are immediately apparent. Because degree-based annotations only consist of a single static value, adding additional dimensions is redundant and performance does not change across dimensions in the plots shown here. DEGREE also performs poorly on lattice networks, where degree provides no useful navigation information. Some methods (DEGREE, LANDMARK, GNP) have unacceptably high exploration ratios—exploring many times more nodes than simple breadth-first search—even when they exhibit acceptable path ratio performance. This effect is due to the use of best-first search where the search algorithm expands nodes ordered by annotation distance rather than by the path distance from the source node. Interestingly, the performance of the GNP scheme degrades as the number of dimensions increases beyond a certain threshold. We conjecture that this is due to the fact that the optimization algorithm (in this case, the Nelder-Mead simplex downhill method) used to derive the coordinate system is unable to converge on a satisfactory solution given a large number (O(d2)) of parameters. The DTZ index performs consistently best across all network types. This is not surprising, given that DTZ combines all the local information available to ZONE, as well as global gradient information akin to LANDMARK. With 10 dimensions and 50 zones, this amounts to 500 landmarks with which to navigate. It has been noted in the literature that the performance of LANDMARK and GNP can be improved through intelligent selection of landmark nodes [11][18], and we suspect that the same may be true regarding the placement of seed nodes for ZONE and DTZ. An exploration of different strategies is reserved for future study.
Figure 6: Path ratios for ZONE and DTZ on random and Forest Fire networks for equivalently sized sets of annotations. In the ZONE plots, number of dimensions is labeled on a geometric scale (as a multiple of the number of zones) in order to make a fair comparison with DTZ.
Table 1: Time and space complexity of different network structure indices, where n denotes the number of nodes, e edges, d dimensions, k zones, and M(x) is the cost of running the Nelder-Mead simplex downhill method with x parameters. NSI APSP DEGREE LANDMARK GNP ZONE DTZ
Time ~ O(n3) O(n) O(ed) O(n⋅M(d)) O(ed) O(ekd)
Space O(n2) O(n) O(nd) O(nd) O(nd) O(nkd)
However, the ZONE and DTZ annotation schemes have two parameters: the number of zones to use k, and the number of dimensions d. As with landmark placement, detailed analysis of a principled approach to choosing these parameters is beyond the scope of this paper. Increasing each never hurts in terms of performance; however, more zones and higher dimensions take longer to build and more space to store. The space and time complexity of each annotation scheme is summarized in Table 1. Recall that the ZONE scheme requires only O(nd) space, compared to O(nkd) for DTZ. Given the additional information being stored by DTZ, we expect for it to outperform a ZONE index with an equivalent dimensionality and number of regions.
Figure 7: Path and exploration ratios for Rexa and IMDb data sets.
DTZ
used on the
In order to directly compare the two NSIs, we can increase the number of dimensions of ZONE so that its total space requirements equal that of DTZ. The results are shown in Figure 6. ZONE and DTZ offer roughly equivalent performance once their annotations are allowed to fill equal amounts of memory. Further, the results seem to vary slightly across graph types, with ZONE performing a bit better on random graphs and a bit worse on Forest Fire graphs. As mentioned previously, the key to using an NSI effectively is to determine the size and type of the index to build, balancing complexity and performance. Figure 7 depicts the performance characteristics of the DTZ index on two real datasets: the Rexa citation graph and the IMDb actor graph (165k nodes / 321k edges and 10k nodes / 628k edges, respectively; see Appendix A). The results demonstrate the robustness of the DTZ technique. The Rexa dataset is a relatively large, sparsely connected graph, with each node having an average degree of 1.95. The IMDb data set is roughly twenty times smaller in terms of nodes, but has an average degree of 62.8. Considered together, these two data sets represent a wide range of network structures. In both cases, the DTZ NSI approaches optimal path lengths with very few annotation dimensions. Furthermore, the best-first searches performed with the indices are two orders of magnitude more efficient than simple breadth-first search. As we show in section 4, this allows us to efficiently calculate a number of statistics on real networks.
Simple distances can be used to produce a wide variety of attributes on nodes, and these attributes, in turn, can be used by data mining algorithms that analyze graphs [10][17]. For instance, a simple distance function can be used to label nodes with their distance to a particular node in a graph (e.g., how close is each actor to Kevin Bacon?). Additionally, a distance function can be used to label nodes with the minimum or maximum distance to one of a set of designated nodes (e.g., how close is each actor to an Academy Award winner?). While such calculations can be made with any method for finding short paths, including breadthfirst search, only an efficient distance function, such as the one provided by an NSI, makes such calculations feasible for large graphs.
4. APPLICATIONS While having the ability to efficiently find a path to Kevin Bacon in an actor graph is certainly useful in its own right, the real utility of an NSI becomes apparent when it is integrated into an algorithm that requires efficient discovery of short paths between several pairs of nodes in the graph.
4.1 Constant Time Distance Estimation Depending on the distance measure being employed, we can sometimes use an NSI to directly estimate the graph distance between any two nodes. Whether this is feasible depends on the ability of our annotation distance measure to provide global rather than local information. Figure 8 shows scatterplots of calculated annotation distance versus actual graph distance for the ZONE and DTZ annotation schemes. In the case of ZONE, even at short path lengths, the annotation distances are highly variable. Though in practice these values are often good enough to provide effective local information for search navigation, they are not good estimators of actual graph distance. The plot for DTZ, however, exhibits a clear linear relationship between annotation distance and graph distance. As a result, we can accurately gauge the relative distance between different pairs of nodes using the annotation distance. If necessary, we can use DTZ annotation distance to estimate actual graph distances with the following procedure: (1) annotate the graph as described for DTZ in Section 2.4, (2) randomly sample p pairs of nodes in the graph and perform breadth-first search to obtain their exact graph distance, and (3) use linear regression to obtain an equation for estimated distance:
dˆ (x, y) = m " DDTZ (x, y) + b Depending on the structure of the graph, step 2 may be intractable for some pairs of nodes. However, since we are identifying a strictly linear relationship, we can terminate our breadth-first ! search after examining paths of lengths greater than four or five and still produce reliable regression results.
Figure 8: Scatterplots of the relationship between annotation distance and actual graph distance for ZONE (top) and DTZ (bottom) on the Rexa citation network.
4.2 Closeness Centrality Centrality measures such as betweenness centrality and closeness centrality [9] are crucial to the study of social network dynamics. Unfortunately, even their approximate calculation involves finding the shortest path between many pairs of nodes. As a result, accurate estimates of these measures are often intractable to calculate efficiently for large data sets. However, by using an NSI for path finding, we can estimate these measures efficiently. For the purposes of the following discussion, we utilize a DTZ scheme only, as it consistently outperformed the other NSIs in our synthetic experiments.
Closeness centrality, or C, measures the proximity of a given node in a network to every other node.
C(a) = " d(a,bi ) i
To estimate C, we can calculate the average of the graph distance to a sample of nodes in our data set. Rather than using (possibly intractable) breadth-first search, we use NSI-based navigation to ! determine the distance between these sampled pairs. Since the path lengths found with the structure index are always greater than or equal to the optimal shortest path lengths, our estimate of C will be consistently upwardly biased. However, in most applications, the actual value of C for a particular node is meaningless in and of itself; rather, it is the value of C relative to the corresponding values for other nodes in the network that is of importance.
Table 2. IMDb actors ranked by approximated closeness centrality. 1. Martin Sheen 2. Michael York 3. Jürgen Prochnow 4. Seymour Cassel 5. Tchéky Karyo 6. Malcom McDowell 7. Harvey Keitel 8. David Warner 9. Robert DeNiro 10. Ben Kingsley
11. Udo Kier 12. Christopher Plummer 13. Martin Landau 14. Richard Riehle 15. James Earl Jones 16. Brion James 17. Peter Coyote 18. F. Murray Abraham 19. Whoopi Goldberg 20. Samuel L. Jackson
The list in Table 2 shows actors drawn from the data and ranked by closeness centrality. As outlined in Appendix A, the data are drawn from movies made between 1970 and 1999 listed in the Internet Movie Database. Kevin Bacon does not top the list, though he still ranks 554th out of over ten thousand actors. The most highly ranked actor by our estimate of closeness centrality is Martin Sheen, a popular actor with over three decades of experience. During the period covered by our data, Sheen appeared in over 150 films and television shows in a remarkably wide variety of genres, including drama (Badlands, Apocalypse Now, The West Wing), comedy (The Simpsons), science fiction (Babylon 5), thriller (Voyage of Terror), and horror (Tales from the Crypt). The other top-ranked actors have similar long careers with diverse roles that have paired them with a wide variety of actors.
Figure 9: Closeness approximation ranking comparisons for estimations made with 5000 sampled pairs on a synthetic Forest Fire graph of 10000 nodes. Figure 9 depicts a scatterplot of actual versus approximated closeness rankings obtained with a DTZ NSI (note that even the “exact” C values used here are actually estimates, as they are obtained through sampling). As can be seen from the figure, using path lengths discovered through NSI navigation provides highly accurate estimates. Traditionally, the quality of a rank ordering is evaluated using a permutation test on Spearman’s ρ statistic or Kendall’s τ. However, since our sample size is relatively large (in this example, ten thousand nodes), any reasonably correct ordering is going to appear significant when compared to the random rankings of a permutation test—our values of 0.9995 and 0.9818 for these statistics have associated p-values of less than one in a million. A slightly more informative measure is the precision of the top-n nodes in the ranking; our ranking produces precision values of 0.9600 and 0.9760 for the top 100 and 1000 nodes. To evaluate the utility of the distance estimates obtained using the approximated distance from Section 4.1, we repeat the experiments for estimating closeness centrality, using path lengths calculated from the linear equation rather than ones found through searching. The results produced for this “searchless” closeness estimation can be seen in the scatterplot in Figure 10. The associated values of ρ, τ, precision at 100, and precision at 1000 are 0.9860, 0.9052, 0.6900, and 0.8270, respectively. While the results are not as accurate, the distance function can be calculated in constant time, which in practice allows for many more pairs to be sampled when making estimates.
Figure 10: “Searchless” closeness estimate ranking comparison for approximations derived from 5000 sampled pairs on a synthetic Forest Fire graph with 10000 nodes. As with simple distance, a measure of centrality can be used to produce attributes on nodes that may be useful to knowledge discovery algorithms. In particular, measures of closeness centrality can be used to determine the closeness of every node to a collection of key nodes (e.g., closeness to all winners of Academy Awards for best actor in the past 10 years). Closeness can also be calculated for more restricted communities. For example, clustering can be used to reveal communities within the graph, which in turn can be used to constrain closeness calculations for their members. This can produce attributes that measure a form of localized closeness centrality (e.g., closeness rank of an actor within his or her “home” movie industry). Finally, there is no reason to adhere strictly to the conventional definition of closeness. For example, we can weight closeness based on the attributes of the
outlying nodes (e.g., closeness to winners of Academy Awards weighted by recency of award). As with simple distance, these attributes have always been available, but an NSI makes them tractable for large graphs.
Jeremy, the top scoring actor on the list, is a prolific adult film star who has recently crossed over into mainstream cinema. Similarly, Gérard Depardieu and Stellan Skarsgård link foreign film communities (French and Swedish, respectively) to Hollywood.
4.3 Betweenness Centrality
Table 3. Top twenty IMDb actors as ranked by estimated betweenness centrality.
Betweenness centrality, or B, is a second measure of network “importance.” The betweenness of a node measures the number of short paths on which a given node lies [9]:
B(a) = " ij
g a (i, j) , i# j#a g(i, j)
Where g(i,j) is the number of shortest geodesic paths connecting nodes i and j, and ga(i,j) is the number of these paths that pass through node a.
!
Since its calculation requires knowledge of actual paths rather than simple path lengths, in practice it is often intractable to calculate exactly—the best known algorithm runs in O(en+n2logn) time [3]. However, we can estimate betweenness using the paths identified through NSI-based navigation. Similar to our procedure for estimating closeness, we randomly sample pairs of nodes and discover the shortest path between them. We then count the number of times each node in the graph appears on one of these paths to obtain a betweenness ranking.
1. Ron Jeremy 2. Udo Kier 3. Gérard Depardieu 4. Stellan Skarsgård 5. Martin Sheen 6. Tchéky Karyo 7. Ice-T 8. Nina Hartley 9. Michael York 10. Max Von Sydow
11. Malcom McDowell 12. Om Puri 13. Ginger Lynn Allen 14. Ben Kingsley 15. Jürgen Prochnow 16. Féodor Atkine 17. Peter Coyote 18. Armin Mueller-Stahl 19. Harvey Keitel 20. Joaquim De Almeida
As with simple distance and closeness centrality, betweenness centrality can also be used to create features on nodes that are useful for data mining. For example, we could calculate betweenness centrality for particular groups of nodes (e.g., actors that sit between winners of Academy Awards for best picture and the IMDb’s “Bottom 100,” the worst 100 movies as voted by users of the Internet Movie Database).
5. RELATED WORK The random graph flooding algorithm described in Section 2.4 is similar to randomized partitioning algorithms found in the graph theory literature such as the algorithm described by Bartal [2]. However, such schemes are often inapplicable to a domain in which exact node distances (and therefore graph diameters) are difficult to compute efficiently.
Figure 11: Betweenness ranks calculated with 50000 sampled pairs of nodes on a synthetic Forest Fire network of 10000 nodes. The results are depicted in Figure 11. Here we compare rankings of nodes using our betweenness estimate (obtained with a DTZ NSI) with the exact measure (not using samples as with the closeness example above). Because the sampling procedure fails to include all the short paths in its calculation of betweenness, many nodes have identical betweenness scores, forming the horizontal lines in the scatterplot. Even so, the plot exhibits a clear relationship between the actual and approximated values of betweenness. As with our closeness estimation, the associated values of Spearman’s ρ and Kendall’s τ (0.9424 and 0.8596, respectively) have pvalues that are literally off the charts. Precision at 100 and 1000 nodes is 0.6900 and 0.7260, which is quite accurate given that less than 1/10th of one percent of paths were considered in the calculation. In the actor graph, a high betweenness score can indicate an actor’s role as a “bridge” between two communities. In Table 3 we have the top 20 actors as ranked by betweenness centrality. Ron
Kleinberg [12][13] explores the notion of similarity-based navigation in small-world networks. He demonstrates how the presence of network homophily can provide a gradient that guides search using local information. Watts investigated a similar approach by constructing a hierarchical model from which to derive homophily [25]. In this paper, we present methods for creating such homophily in domains that may lack local information. We detail a number of ways in which this information can be obtained for both synthetic and real datasets. As described above, the LANDMARK NSI designates select nodes as landmarks to provide directional information for navigation. This approach has been studied by Chow [4] as well as Goldberg and Harrelson [11] in conjunction with A* search, since an admissible heuristic can be derived from distances to landmarks. While this strategy can guarantee optimal paths by employing A*, a large number of nodes must be explored to discover these paths. This is not ideal if fast discovery of short paths is needed, as in the case of approximating network statistics. We show that the LANDMARK approach is not effective when combined with a nonoptimal best-first search strategy. The landmark and GNP approaches have been adopted by the networks/Internet community as a basis for determining network latency between hosts on the Internet, and several Internet coordinate approaches attempt to minimize network latency through extensions of GNP [20][21][24]. Goldberg and Harrelson describe several methods for effectively positioning landmarks within networks [11], as do Ng and Zhang [18]. Kleinberg et al. provide a
theoretical analysis and framework of all beacon-based strategies, such as GNP and others [14]. Other strategies in the Internet domain have attempted to create network overlay structures, such as a rings-based approach that does not rely on selection of landmark nodes [28]. This concept has recently been explored theoretically as a technique for distance estimation and nearest neighbor searches by Slivkins [22] and Krauthgamer and Lee [15]. However, it is unclear how accurately any of these strategies perform on domains other than the Internet or for the purposes of approximating network statistics. Additionally, our current work focuses on undirected, unweighted graphs with the goal of minimizing hop count, not network latency.
6. CONCLUSIONS AND FUTURE WORK We have identified several methods for creating a network structure index. Two of these methods, ZONE and DTZ, allow efficient and accurate estimation of path lengths between arbitrary nodes in a network. Using these indices, we can estimate path length between a pair of nodes in constant time, and we can estimate the closeness centrality of a given node in time that is linear in the number of outlying nodes. In addition, we have shown empirically that we can estimate the betweenness centrality of a given node by accessing less than 5% of the nodes explored by breadth-first search. Such efficient calculations of network statistics open up a new range of potential approaches to knowledge discovery. First, identification of short paths and central nodes are important types of knowledge discovery for networks. Closeness centrality can direct attention to the core of a network, and betweenness centrality can help identify key connectors of otherwise separate communities. Second, estimates of these measures can support the application of other methods (e.g., joint statistical models such as probabilistic relational models [10] or relational dependency networks [17]). Centrality and other path-based measures summarize local structure in ways that can be easily considered by learning algorithms for these models. Third, path length and centrality measures can be adapted to produce a wide variety of more local features, such as distance to particular nodes, closeness to particular classes of nodes, and betweenness for two or more subsets of nodes. Despite our success at creating reasonably efficient and accurate NSIs, we have not exhausted the space of potential solutions in this general class of indices. As we outlined in Section 5, a number of promising results in computer networking and theory point toward additional techniques for constructing NSI annotations, and we are actively investigating these alternatives. In addition, we are considering how to efficiently update NSIs when nodes and links are added to the network so that dynamic graphs can be successfully indexed. Finally, we are investigating how to apply our own recent developments in network searching [23] to more effectively use NSI annotations to find short paths. We are actively exploring additional applications of network structure indices. Two of the most promising directions are finding connection subgraphs and approximating neighborhood functions. Faloutsos and coauthors have pioneered work in this area by identifying efficient methods for finding connection subgraphs— sets of short paths between nodes—and for approximating the size of the neighborhood of a node [7][19]. NSIs may provide an alternative way of representing much of the information needed for both of these tasks.
7. ACKNOWLEGEMENTS This research is supported by Lawrence Livermore National Laboratory and the Department of Energy under contract number W7405-ENG-48. The U.S. Government is authorized to reproduce and distribute reprints for governmental purposes notwithstanding any copyright notation hereon. The views and conclusions contained herein are those of the authors and should not be interpreted as necessarily representing the official policies or endorsements either expressed or implied, of LLNL/DOE or the U.S. Government. The authors wish to thank T. S. Eugene Ng for the use of the GNP source code, as well as Andrew McCallum and the students and staff of the Information Extraction and Synthesis Lab at the University of Massachusetts for use of the Rexa data. Finally, we would like to thank Cindy Loiselle for her helpful comments and M&Ms.
8. REFERENCES [1] L. A. Adamic, R. M. Lukose, A. R. Puniyani, and B. A. Huberman. Search in power-law networks. Physical Review E, 64, 2001. [2] Y. Bartal. Probabilistic approximation of metric spaces and its algorithmic applications. In Proceedings of the 37th Annual IEEE Symposium on Foundations of Computer Science, 1996. [3] U. Brandes. A faster algorithm for betweenness centrality. Journal of Mathematical Sociology 25:163-177, 2001. [4] E. Chow. A graph search heuristic for shortest distance paths. Technical Report UCRL-JRNL-202894, Lawrence Livermore National Laboratory, 2004. [5] D. Coppersmith and S. Winograd. Matrix muliplication via arithmetic progressions. Journal of Symbolic Computing. 9:251-280, 1990. [6] P. Erdös and A. Rényi. On the evolution of random graphs. Publ. Math. Inst. Hungar. Acad. Sci. 5, 17-61. 1960. [7] C. Faloutsos, K. S. McCurley, and A. Tomkins. Fast discovery of connection subgraphs. In Proceedings of the 10th ACM SIGKDD International Conference on Knowledge Discovery and Data Mining, 2004. [8] R. W. Floyd. Algorithm 97 (shortest path). Communications of the ACM, 5(6):345, 1962. [9] L. C. Freeman. Centrality in social networks: Conceptual clarification. Social Networks 1:215-239, 1979. [10] N. Friedman, L. Getoor, D. Koller, and A. Pfeffer. Learning probabilistic relational models. In Proceedings of the International Joint Conference on Artificial Intelligence, 1999. [11] A.V. Goldberg and C. Harrelson. Computing the shortest path: A* search meets graph theory. In ACM-SIAM Symposium on Discrete Algorithms, 2005. [12] J. Kleinberg. Navigation in a small world. Nature, 406:845, 2000. [13] J. Kleinberg. The small-world phenomenon: An algorithmic perspective. In Proceedings of the 32nd ACM Symposium on Theory of Computing, 2000. [14] J. Kleinberg, A. Slivkins, and T. Wexler. Triangulation and embedding using small sets of beacons. In Proceedings of
th
the 45 Annual IEEE Symposium on Foundations of Computer Science, 2004. [15] R. Krauthgamer and J. R. Lee. Navigating nets: Simple algorithms for proximity search. In ACM-SIAM Symposium on Discrete Algorithms, 2004. [16] J. Leskovec, J. Kleinberg, and C. Faloutsos. Graphs over time: Densification laws, shrinking diameters and possible explanations. In Proceedings of the 11th ACM SIGKDD International Conference on Knowledge Discovery and Data Mining, 2005.
[21] Y. Shavitt and T. Tankel. Big-Bang simulation for embedding network distances in Euclidean space. In Proceedings of IEEE Infocom, 2003. [22] A. Slivkins. Distance estimation and object location via rings of neighbors. In Proceedings of the ACM Symposium on Principles of Distributed Computing, 2005. [23] Ö. Şimşek and D. Jensen. Decentralized search in networks using homophily and degree disparity. In Proceedings of the Nineteenth International Joint Conference on Artificial Intelligence, 2005.
[17] J. Neville and D. Jensen. Dependency networks for relational data. In Proceedings of the 4th IEEE International Conference on Data Mining, 2004.
[24] L. Tang and M. Crovella. Virtual landmarks for the Internet. In Proceedings of the Internet Measurement Conference, 2003.
[18] T. S. E. Ng and H. Zhang. Predicting Internet network distance with coordinates-based approaches. In Proceedings of the 21st Annual Joint Conference of the IEEE Computer and Communications Societies 1:170-179, 2002.
[25] D. J. Watts, P. S. Dodds, and M. E. J. Newman. Identity and search in social networks. Science, 296:1302-1305, 2002.
[19] C. R. Palmer, P. B. Gibbons, and C. Faloutsos. ANF: A fast and scalable tool for data mining in massive graphs. In Proceedings of the 8th ACM SIGKDD International Conference on Knowledge Discovery and Data Mining, 2002.
[27] Wikipedia contributors (2006). Six Degrees of Kevin Bacon. Wikipedia, The Free Encyclopedia. Retrieved 15:10, April 15, 2006 from http://en.wikipedia.org/w/index.php? title=Six_Degrees_of_Kevin_Bacon&oldid=48040027.
[20] M. Pias, J. Crowcroft, S. Wilbur, T. Harris, and S. Bhatti. Lighthouses for scalable distributed location. In Proceedings of the 2nd International Workshop on Peer-To-Peer Systems, 2003.
[28] B. Wong, A. Slivkins, and E. G. Sirer. Meridian: A lightweight network location service without virtual coordinates. In Proceedings of SIGCOMM, 2005.
[26] D. J. Watts and S. H. Strogatz. Collective dynamics of smallworld networks. Nature, 393:440-442, 1998.
Figure 12: Examples of synthetic graphs with 100 nodes
APPENDIX A: DATA SETS We evaluated the performance of our indices on three types of synthetic networks. Small (100 node) examples of each are depicted in Figure 12. The first type is based on an Erdös-Rényi style random graph model [6], in which we randomly connect a given number of nodes with edges and then select the largest connected component (typically encompassing > 95% of the nodes) for annotation. The second type of graph used is a “lightly” rewired lattice, as first proposed by Watts and Strogatz [26]. For this model, we construct a lattice (specifying the number of nodes in the graph and their degree), and then randomly rewire a portion of the edges according to some probability (in this paper, 0.01). Finally, we tested our algorithms on small world graphs generated with the Forest Fire model described by Leskovec et al. [16], us-
ing burn probabilities ranging from 0.32 to 0.48, and a backward burning probability of 0.2. In addition two real-world datasets were used for experiments in this paper. The Rexa database is a citation graph of scientific papers in computer science. It contains 165k nodes, representing papers, connected by 321k undirected edges, representing the citations among papers. The low average degree is due to coreference errors in the particular version of the Rexa dataset used and the fact that many papers in the dataset cite papers that do not appear elsewhere in the data and thus have a degree of one. The IMDb dataset is a network of actors drawn from www.imdb.com. Actors are linked when they have costarred in a movie together between 1970 and 2000. Furthermore, actors who have appeared in fewer than 20 movies in that period have been filtered out. The resulting network contains 10k nodes and 628k edges.