University of Nebraska - Lincoln
DigitalCommons@University of Nebraska - Lincoln Faculty Publications: Agricultural Leadership, Education & Communication Department
Agricultural Leadership, Education & Communication Department
1-1-2012
Using Targeting Outcomes of Programs as a Framework to Target Photographic Events in Nonformal Educational Programs S. Kay Rockwell University of Nebraska - Lincoln,
[email protected]
Follow this and additional works at: http://digitalcommons.unl.edu/aglecfacpub Part of the Other Public Affairs, Public Policy and Public Administration Commons Rockwell, S. Kay, "Using Targeting Outcomes of Programs as a Framework to Target Photographic Events in Nonformal Educational Programs" (2012). Faculty Publications: Agricultural Leadership, Education & Communication Department. Paper 57. http://digitalcommons.unl.edu/aglecfacpub/57
This Article is brought to you for free and open access by the Agricultural Leadership, Education & Communication Department at DigitalCommons@University of Nebraska - Lincoln. It has been accepted for inclusion in Faculty Publications: Agricultural Leadership, Education & Communication Department by an authorized administrator of DigitalCommons@University of Nebraska - Lincoln.
Published in American Journal of Evaluation 33:2 (2012), pp. 179–194; DOI: 10.1177/1098214011421522 Copyright © 2012 S. Kay Rockwell, Julie A. Albrecht, Gwen C. Nugent, and Gina M. Kunz. Published by Sage Publications on behalf of the American Evaluation Association. Used by permission. http://aje.sagepub.com/content/33/2/179
Using Targeting Outcomes of Programs as a Framework to Target Photographic Events in Nonformal Educational Programs S. Kay Rockwell, Julie A. Albrecht, Gwen C. Nugent, and Gina M. Kunz University of Nebraska–Lincoln, Lincoln, NE, USA Corresponding author — S. Kay Rockwell, University of Nebraska–Lincoln, Lincoln, NE 68506, USA; email
[email protected]
Abstract Targeting Outcomes of Programs (TOP) is a seven-step hierarchical programming model in which the program development and performance sides are mirror images of each other. It served as a framework to identify a simple method for targeting photographic events in nonformal education programs, indicating why, when, and how photographs would be useful to inform other evaluation strategies. In two case studies, photographs enhanced the formative story of a geoscience project being developed and tested, and contributed to the outcome narrative of a 10-year partnership project between two universities. In both cases, TOP proved to be an efficient and easy-to-use framework. Using TOP in this fashion has the potential to help evaluators address challenges posed by the subjectivity of photography and possible biases of the photographer in the research process. Keywords: targeting outcomes of programs (TOP), photography in mixed method evaluations, photographic events, nonformal education
Evaluators continue to look for effective and straightforward ways to tell the story of how the learning process in nonformal education programs affects participants. United Nations Educational, Scientific, and Cultural Organization (UNESCO, 1991) defines nonformal education as: Any organized and sustained educational activities that do not correspond exactly to the definition of formal education. Non-formal education may therefore take place both within and outside educational institutions, and cater to persons of all ages. Depending on country contexts, it may cover educational programs to impart adult literacy, basic education for out-of-school children, life-skills, work-skills, and general culture. Non-formal education programmes do not necessarily follow the ‘ladder’ system and may have differing durations, and may or may not confer certification of the learning achieved. (p. 41) 179
180
Rockwell
et al. in
American Journal
of
E va lu at i o n 33 (2012)
Visual representations have been used successfully for needs assessments and evaluations in a variety of nonformal education programs for adults as well as youth. Both qualitative and quantitative evaluation inquiry processes have been enhanced by photography. Images have helped elicit interview responses from young participants or those unable to process written text or verbal directions. Realistic or representatively colored photographs have been preferred for data collection methods in low-literate audiences (Jordan, Adams, Pawley, & Radcliff, 2009; Townsend, Sylva, Martin, Metz, & Wooten-Swanson, 2008). Photographic monitoring has compared changes over time in the biophysical environment (Kuehn & Thompson, 2007), urban development, landscape restoration, grazing management systems, erosion control, and manure management. Similarly, photographic data can track changes in program-specific behaviors and skill sets, such as gardening development, recycling efforts, and lawn care practices or other skills (Taylor-Powell & Steele, 1996). For certain phenomena, photographs might be a preferred data collection tool. They can enable evaluators to systematically represent a range of complex conditions or reactions more readily than a textual representation. For example, photos that document reallife physical surroundings can show heavily wooded to lightly wooded camp sites, or a range of nonverbal behaviors of individuals or groups as depicted on a continuum from aggressive to friendly. They may also be a preferred choice for collecting data about interaction patterns, numbers, and characteristics of program participants as well as reactions between participants and instructors in learning situations (Taylor-Powell & Steele, 1996). In participatory evaluations where enrolled individuals have taken their own pictures, digital photographs have confirmed evaluators’ feelings or hunches (e.g., Fetterman as cited in Fitzpatrick, 2000), providing a reliability check as team members considered whether they reached similar conclusions about complex situations. Photos gave face validity to observations and helped document them in ways no one could dispute, and ultimately became a valued secondary form of data collection for the evaluation team. Using photos, evaluators have probed for additional background information from project leaders, elicited their reactions to confirm what was important to them, and stimulated discussion about intermediate- and long-term outcomes that had been overlooked or missed. Photographs can be a visual stimulus for participants to go into a greater depth and breadth concerning their reactions to instruction or specific program activities. They have been used to probe during interviews when concepts or issues emerged during the course of an educational program (Spiegel, Bruning, & Gidding, 1999). Photolanguage, originally developed for counseling and therapy purposes, has also been used by qualitative researchers and evaluators. This method directs evaluators to select photos that are predicted to stimulate respondents’ memory, emotions, and imagination (Bessell, Deese, & Medina, 2007; White, Sasser, Borgren, & Morgan, 2009). Hurtworth and Sweeney (1995) propose that photos are particularly valuable when a wide range of activities need to be documented, participants are unable to participate in other forms of data collection, images will speak louder than prose, the program’s effects change over time, or the physical context or locality of a program is important. Pictures may convey what the written word misses; they are powerful additions to an evaluation report or presentation and typically increase stakeholders’ interest in the findings (Fetterman as cited in Fitzpatrick, 2000; Taylor-Powell & Steele, 1996). However, questions have been raised about photography’s subjectivity, the possible biases of the photographer, and the reactivity of those photographed (Hurtworth & Sweeney, 1995). Anthropology and visual anthropology literatures provide guidance on how to use, select, and time photographic events. In addition, they help delineate how images may be employed to plan programs or represent participant values, and thus represent one
Targeting
p h oto g r a p h i c e v e n t s i n n o n f o r m a l e d u c at i o n p r o g r a m s
181
model for guiding evaluation practice (Becker, 1979; Bellman & Jules-Rosette, 1977; Collier & Collier, 1986; Fetterman, 2010; Heider, 1976; Pink, 2006). Still, there is little discussion in the evaluation literature of using photography in the evaluation of nonformal education programs. Identifying a framework in which visual representations (e.g., photos of people, activities, landscapes, learning venues, etc.) can support an outcome story will help target photographic needs in these initiatives. Accordingly, the goals of this study were to: 1. Include photography in a multiple method evaluation design in one process-oriented evaluation project and one outcome-oriented evaluation project. 2. Identify a framework within which photography targeted contextual program elements and provided relevant data. 3. Propose a strategy within a specified framework that would provide direction on why, when, and how to target photographic events within the context of nonformal educational programming.
Targeting Outcomes of Programs (TOP): A Structure for Identifying Photographic Events TOP is a two-sided seven-step hierarchy that connects program planning stages with program performance stages (Rockwell & Bennett, 2004). The upper three levels focus on program outcomes and the lower four levels focus on program implementation (Figure 1). Briefly, the seven levels are defined as: • SEE conditions represent the Social, Economic, and Environmental situations targeted in given educational programs/projects. • Practices are the program users’ patterns of behavior. • KASA stands for Knowledge, Attitude, Skills, and Aspirations that participants acquire, improve, or change. • The reactions level addresses participants’ interest in being involved in the program. • Participation includes those who are invested in the program to the degree that it will affect their behavior patterns in the future. • Activities are the various educational strategies used to inform, educate, or train the target audience. • Resources refer to the time, money, and human capital dedicated to the program. Penna and Phillips (2004) describe TOP as a ‘‘practical hierarchy for targeting outcomes, tracking progress toward achieving targets, and evaluating the degree to which programs impact targeted conditions . . . its key strength is that it helps integrate program development and program evaluation; program implementers and managers can use the same concepts in program development as they do in program evaluation’’ (pp. 64, 61). Rockwell and Bennett (2004) note that nonformal education instructors have often used TOP to focus education and training programs on social, economic, and environmental outcomes, and then assess the degree to which these outcomes are achieved. In the two case studies reported in this article, the TOP model guided the selection of photographic events in a process evaluation and an outcome documentation. TOP served as a structure for understanding why, when, and how to add photographs in mixed-method evaluation plans in nonformal education programs. • Why? Would photographs be beneficial in answering evaluation questions in both case studies? Would they capture what was happening in the field, inform findings in other evaluation processes, and illustrate how target audiences reacted?
182
Rockwell
et al. in
American Journal
of
E va lu at i o n 33 (2012)
Figure 1. TOP: A hierarchy for targeting outcomes and evaluating their achievement (Rockwell & Bennett, 2004).
• When? At what stage(s) in nonformal education programs will photographs contribute to answering evaluation questions? Case study #1 involved a process-oriented evaluation: Would photographs help explore what took place during the testing of a new course? Case study #2 consisted of an outcome-oriented evaluation: Would photographs capture how the target audience applied what they had learned? • How? What is the context within which photographs could inform the evaluation questions? Could the goals and objectives in each case study be used to identify appropriate targets for photographic events?
Case Studies for Testing the Setting of Photographic Targets Case Study 1—Geoscience Project GEOL 160, A Field-Based Inquiry-Focused Geoscience Course for Pre-Service Teachers, served as the process-oriented case study. The goal was to develop and deliver the course in Year 1 and field test it in Years 2 and 3. The 3-week course included 2 weeks of studying geology while camping at selected geological sites across three states and 1-week camp at a middle school where students developed and taught lesson plans based on the field experiences. The evaluation design for the 2-year testing phase included (a) quantitative pre/post research instruments to test knowledge and skills gained and attitude and self-efficacy changes; (b) qualitative processes to examine students’ field books as a means of understanding their inquiry-based learning process and their desire to integrate it into geoscience lessons in the classroom; and (c) a participant–observer method to provide feedback on the effectiveness of the instructional processes. In Year 2, the project leaders wanted a participant–observer to help them understand what was happening in the field. They asked: How are students developing inquiry and cooperative learning skills? Is a sense of community developing? They also wanted the evaluation to (a) elaborate on and help explain results of pre/post quantitative instruments and the qualitative analysis of student field books, (b) complement the students’ self-report data being used to document outcomes, and (c) reflect progression over time
Targeting
p h oto g r a p h i c e v e n t s i n n o n f o r m a l e d u c at i o n p r o g r a m s
183
in student understanding of inquiry, their ability to engage in self-directed inquiry processes, and their confidence in teaching science. Overall, the project leaders’ goal was to have an evaluator participate in the educational experience and explore themes emerging as issues in the educational process. They would then use these findings to strengthen the course curriculum for field testing again in Year 3. The evaluator needed to observe students’ social interaction as well as the educational process, interview students and instructors as necessary, fit into the learning process when feasible, and document educational and social activities. Field notes along with photography appeared to be the most appropriate way to gather data during the course. Ultimately, a photo elicitation (Harper, 2002) session at the end of the experience was needed to more fully understand what the evaluator saw and heard throughout the course. Evaluation goals for the geoscience project in Year 3 were based on the evaluation findings of Year 2. Results from knowledge tests indicated that certain parts of the inquiry process were not being internalized by students: (a) The circular nature of inquiry (i.e., new questions build on previous findings), including using inquiry to build new knowledge; and (b) sharing and communicating results. Therefore, the evaluation goals for Year 3 were to (a) explain how the scientific inquiry cycle was implemented and modeled by instructors and (b) explore how students were developing inquiry skills and competencies. Again, it appeared that photography along with field notes would be the most appropriate way to gather data because it had the potential to inform the other evaluation processes as well as verify the evaluator’s observations. Photographic targets. Moving down the TOP’s hierarchy on the program development side (see Figure 1), targets are set at each step, generally in the form of quantitative objectives. Therefore, the program goals at the bottom four levels were used to identify the contextual parameters for photographic events. Briefly, the evaluation questions for the geoscience project fit into TOP as follows: • The reactions level focused on three instructors from two universities who cooperated to recruit and teach students with a unique educational strategy. • Participation included both the students enrolled in the course and the instructors who taught it. • Activities for the curriculum incorporated educational strategies based on Llewellyn’s (2002) text, inquire within: implementing inquiry-based science standards and other teaching methods integrated into the course syllabus. • Resources included educational materials and the organizational maintenance and transportation required to implement the course. Moving up the hierarchy on the program performance side, the evaluation needs of Year 2 focused on Levels 2–4. At the Activities level, the focus was on teaching methods; at the Participation level, photos of students and instructors were needed while they were involved in the teaching or learning process; at the Reactions level, photos had to illustrate how participants reacted to the field-based educational experience. The Resources level was not addressed because it focused on resources and logistics that were accounted for in other ways.
Case Study 2—Partnership Project The UNL/KbTUT Partnership project between the University of Nebraska–Lincoln (UNL) and the Khujand Branch of the Technological University of Tajikistan (KbTUT) served as the outcome-oriented case study. Its broad goal was to help Tajikistan preserve the Tajik heritage and develop a more stable economy. Three grants and five contracts had supported the partnership over a 10-year period. Major goals focused on (a) developing an entrepreneurial center and textile museum at KbTUT; (b) providing KbTUT ad-
184
Rockwell
et al. in
American Journal
of
E va lu at i o n 33 (2012)
ministrators, faculty, and upper level students an opportunity to enhance their subject matter expertise at UNL; (c) enhancing KbTUT’s curriculum in food science and textiles; and (d) training KbTUT faculty in outreach education methods (Albrecht, Prochaska-Cue, Rockwell, & Pulatov, 2010). Upon completion of the grants and contracts, liaisons from the funding agencies asked for documentation of what unfolded at KbTUT after the faculty had time to implement specific projects and apply what they learned while studying at UNL. Therefore, a site visit at Khujand, Tajikistan, was necessary to assess how KbTUT faculty and students integrated the educational training they received at UNL—immediate and long-term outcomes needed to be identified and documented. Liaisons from the funding agencies and the project leaders listed topics they wished to better understand. These topics provided a focus for the site visit that involved departmental visits and personal interviews with the UNL-trained KbTUT faculty, classroom visits, and community excursions. In addition, unplanned project outcomes had to be noted and documented. Tangible results needed to be illustrated. Therefore, photography was used to document the evaluator’s observations. Photographic targets. Moving down TOP’s hierarchy on the program development side (see Figure 1), expected outcomes were identified and defined by the program goals and objectives at the top three levels. Briefly, the evaluation questions for the partnership project fit into TOP as follows: • SEE conditions were the preservation of a heritage and the development of a more stable economy that was further defined in specific objectives. • Practices were defined as ways KbTUT participants implemented what they learned during the intensive training at UNL. • KASA component—knowledge gain had been documented earlier in the grant process. However, data about attitude change, skill development, and participants’ aspirations for the future needed to be addressed. Moving up the program performance side, the evaluation focused on the degree to which targets were reached. At the KASA level, the emphasis was on how faculty trained at UNL used the knowledge and skills they gained at KbTUT, and their plans for the future; at the practice level, the focus was on how the KASA changes altered KbTUT faculty’s teaching and learning strategies; the SEE level dealt with how the participants’ behavioral changes affected the university as well as how the institutional outcomes reached beyond KbTUT and initiated community changes.
Challenges Encountered in Integrating Photography A number of challenges were encountered as photography was integrated into the two evaluation designs: (a) finding an experienced evaluator who was a good fit for the evaluation, (b) participant’s comfort level with the evaluator, (c) program activities whose nature limited photographic documentation, (d) management and selection of photographs for use in evaluation, (e) data analysis and synthesis, (f) photographic documentation of unexpected or unplanned processes, and (g) Institutional Review Board (IRB) approval.
Finding an Experienced Evaluator Geoscience project. Hiring an external experienced evaluator created a challenge due to a limited budget; it covered travel expenses plus a small stipend for an evaluator willing to spend 2 (or 3) weeks in the field with the students and instructors. The individual had to camp in tents and participate in all activities with the students as they explored various geological structures, be sensitive and objective when stress situations arose, and make decisions about photographic targets that would provide appropriate feedback.
Targeting
p h oto g r a p h i c e v e n t s i n n o n f o r m a l e d u c at i o n p r o g r a m s
185
The evaluator had little guidance on the specific student and instructor behaviors to observe, and just a general data collection protocol to use; specifics needed to be developed ‘‘on the fly’’ throughout the testing phase in Year 2.
Partnership project. The budget covered expenses for an evaluator and an assistant to col-
lect the data. The evaluator spent 10 days traveling to and in a developing country, worked with cultural and language barriers, and made adjustments in the evaluation protocol during the data collection process while still meeting the evaluation’s goals and objectives.
Participant’s Comfort Level Geoscience project. The evaluator needed to develop a level of trust with the instructors
because the latter’s teaching methods were continually being observed and photographed. Outside factors complicated the trust-building process. For example, one instructor had no background in educational theory and methods and felt threatened by evaluation in general. Trust with the University students was also required because the students were constantly being questioned, observed, and photographed. Therefore, embedded reporter was chosen over the standard participant–observer title to decrease the intimidation level of having an evaluator within the group. The latter sounded too official and research oriented for the setting. Moreover, the evaluator was not a full participant and students were aware that the project was being evaluated. In this context, embedded reporter better described the nature of the evaluator’s duties.
Partnership project. The evaluator worked with an interpreter because some respon-
dents had limited English-speaking ability. Although the project leader introduced the evaluator via e-mail and reassured subjects about the evaluation process, the evaluator still had to establish credibility with the subjects before collecting data.
Nature of the Program Activities Geoscience project. The basic instructional strategy was teamwork in small groups,
creating a challenge in photographing simultaneous activities and capturing changes over the term of the course. The evaluator was continually faced with the task of selecting appropriate photographs to address evaluation needs.
Partnership project. In interviews, faculty provided evidence illustrating what they
were implementing at KbTUT. And in activities such as visits to a classroom and the textile museum, the evaluator captured data that provided insights into what faculty put into practice following their nonformal educational experience. The evaluator also photographed evidence of changes that were occurring in the community due to the 10-year educational effort. As the evaluator shopped in food markets and toured the countryside, decisions about photographic opportunities for documenting project-related outcomes were continually being made.
Selection of Photographs and Data Management Because the evaluator used TOP (Rockwell & Bennett, 2004) extensively in designing evaluation plans, it was natural to select photographic events that would address the six top levels in the model. Thus, in the geoscience project, events focused on Levels 2–4: Activities, Participation, KASA, and Reactions. In the partnership project, events focused on the upper three levels: KASA; practices implemented; and social, economic, and environmental changes. The KASA level overlapped in the two case studies due to the educational nature of both programs.
186
Rockwell
et al. in
American Journal
of
E va lu at i o n 33 (2012)
Consequently, the TOP model became the framework for managing data. The projects’ goals and objectives were used to categorize the photos and field notes within the appropriate levels in TOP’s hierarchy and match them with relevant targets. Data for the geoscience project were linked to goals and objectives reflecting the targets on the program development side of TOP; those documenting outcomes in the partnership project were matched with the outcomes expected on the program performance side.
Data Analysis and Synthesis After data were sorted according to goals and objectives reflecting appropriate steps in TOP’s hierarchy, customary procedures were followed to verify, analyze, and synthesize the data. A staff member who assisted with logistics in the geoscience project checked and verified how data and field notes reflected what occurred in the field. An evaluation assistant in the partnership project checked and verified that the data and field notes represented the outcomes. In both studies, the evaluator then compiled data summaries addressing the specific program goals and objectives and drafted initial conclusions and recommendations. Together the project leaders and the evaluator studied and discussed the evaluator’s draft, posed questions, and suggested hypotheses. The evaluator then made corrections and adjustments if warranted.
Unexpected or Unplanned Processes Geoscience project. Throughout the 2-week camping experience, interpersonal con-
flicts arose. There was a need to explore what was happening in greater detail so a photo elicitation process was added into the mixed-method evaluation plan.
Partnership project. Within the 10-year contract and grant cycle, there was an administrative change at KbTUT. The new administration wanted to refocus the objectives, but the suggestion was rejected by the UNL project leader because the funders had specified how funds would be used. Therefore, it was important to observe for unplanned outcomes that could have resulted from funds being used slightly differently than intended.
IRB Approval In both case studies, the evaluations would have fallen into the IRB’s exempt category if photography had not been part of the evaluation design. With the addition of photography, the review level became expedited, which indicated a greater level of risk and required greater scrutiny by the IRB.
Geoscience project. The IRB specifically requested information on how the pho-
tographs were being used in the project; they asked if pictures would be taken of specific individuals and whether the photos would be used in publications. IRB approval was granted when the informed consent procedure specified that photographs would be taken to capture the field and pedagogy instructional experiences and students’ photos would only be used for education and professional development purposes.
Partnership project. IRB required that all participants be informed about the significance of the evaluation both verbally and in writing. Since the participants were adults, additional justification was not needed for obtaining IRB approval. KbTUT did not have IRB guidelines, therefore UNL guidelines applied. However, because of the international partnership, the evaluator and project leaders had to be cognizant of potential issues that could result from using the photographs beyond educational and professional development purposes.
Targeting
p h oto g r a p h i c e v e n t s i n n o n f o r m a l e d u c at i o n p r o g r a m s
187
Advantages of Integrating Photography Geoscience Project Program leaders reported a number of advantages of integrating
photography into the grant reports (Rockwell, 2007; Rockwell, Albrecht, Nugent, Kunz, & Prochaska-Cue, 2008). Using photographs validated observations; captured triumphs, progressions, and the spirit of the inquiry process; yielded a data bank of photos for dissemination; and allowed for follow-up data collection processes.
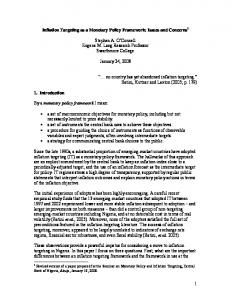
Validated observations. The photo-
graphs validated perceptions and observations about the instructional process by focusing on dimensions such as student and instructor body language. Evidence of student engagement or disengagement was evident from the photographs (Photo 1), suggesting areas where the instruction was effective and where improvements were needed. Photographs also helped describe the role of the instructor at various points in the instructional process, that is, the use of direct instruction, facilitation, group discussion, and scaffolding. Photo 1. Evidence of student engagement in learning.
Captured triumphs, progressions, and spirit of the inquiry process. Student triumphs were captured on camera
when preservice teachers successfully completed an inquiry task in the field or guided middle school students in understanding, for example, how a geyser erupts (Photo 2). It also documented progressions, showing how (a) preservice teachers improved as they made multiple presentations of their mini-lessons to students, (b) students gained a better understanding of the inquiry process while in the field, and (c) instructors used a gradual fading of prompts and scaffolding as they taught inquiry. Pictures depicted students’ activities as they analyzed information, generated possible solutions, carried out a plan, collected evidence, drew conclusions, and shared results (Photo 3). Photos also documented activities instructors used as they led students through steps in the inquiry cycle (Photo 4).
Photo 2. Student triumph.
Yielded a data bank of photos for dissemination. Photography yielded a data
bank for dissemination and publicity purposes: conference presentations, reports to granting agencies, journal articles, project videos, and websites. For example, middleschool student photos were transferred to a CD for the school’s principal.
188
Rockwell
et al. in
American Journal
of
E va lu at i o n 33 (2012)
Provided photos for a photo elicitation followup. The evaluation strategy in the field focused on ob-
serving students and faculty and informally talking with them to explore implementation and acceptance of the new course. Toward the end of data collection, it became evident the photographic data would be greatly strengthened if students reflected on the learning process Photo 3. Students collecting data. and addressed several specific issues the evaluator noted throughout the field experience. Therefore, photo elicitation (Harper, 2002) was used to identify how students felt about learning through inquiry-based science, working in teams, interacting with the faculty and staff, camping, and the overall impact of the experience. Collages of four to nine photographs were compiled to provide visual stimulation for the students to discuss their feelings. Students were randomly assigned to small groups of three or four and spent 1 hr talking about the collages. Probes were used to ensure that each small group discussed the interpersonal conflicts that had emerged throughout the camping experience. Responses were tape recorded. Students were informed they could Photo 4. Instructor teaching class. pause the tape recorder if they so desired. Responses were transcribed verbatim. Photo elicitation gave students a concrete stimulus to reflect upon, helped identify how they felt about the course and the stresses that arose during the camping experience. It reinforced or slightly changed the evaluator’s observations and provided quotes that confirmed observations and conclusions.
Partnership Project
Program leaders reported a number of advantages of integrating photography into the stakeholder report (Rockwell, Rockwell, & Albrecht, 2006). Using photographs validated data from personal interviews and site visits, illustrated different practices researchers and instructors were advocating, illustrated community changes and aspirations for the future, showed unexpected outcomes, and provided a data bank of photos for analysis, presentations, reports, manuscripts, and other future needs.
Validated data from personal interviews and site visits. The photos helped amplify the show and tell as-
pects of the personal interviews. They also documented classroom observations where the teacher was delivering the lecture/activity in another language. They illustrated how teachers who received training in the United States used visuals and interactive teaching methods. Results of various teaching strategies the instructors employed in newly designed courses are illustrated in photographs Photo 5. Student diary. (Photo 5). The photos also captured outcomes of specific objectives. For example, they showed artifacts displayed in one room designated as a research-and-education Textiles Museum, indicating that KbTUT was moving forward to preserve the Tajik heritage.
Targeting
p h oto g r a p h i c e v e n t s i n n o n f o r m a l e d u c at i o n p r o g r a m s
189
Table 1. Market Comparison Product Traditional Market
New Market
Chicken Lying on a table; no refrigeration In a refrigerated case Beef Carcass hanging in open air to cut as needed Cut, packaged, and stored in refrigerated case
Traditional Market
New Market
Illustrated different practices researchers and instructors were advocating. Photos documented
university faculty using laboratory equipment they obtained as a result of the grant; posters and other visuals developed for teaching purposes were on display. They also illustrated newly developed products that food processors will adopt (Photo 6).
Illustrated community changes and aspirations for the future. Photographs taken on site visPhoto 6. Newly developed products.
its displayed how faculty started to translate what they had learned into the community’s marketplace. For example, photos of a traditional and a new market produced a current and future comparison (Table 1).
Showed unexpected outcomes. As faculty and ad-
Photo 7. New registration office.
ministrators spent time at UNL, they observed university procedures that went beyond the objectives in the contracts and grants. For example, the development of a credit-based and more student-centered system at KbTUT created the need for a new registration office (Photo 7).
Provided data bank of photos for analysis, presentations, reports, and manuscripts. Clusters of photos were a rich resource for better understanding outcomes because
the project leader added background information throughout the analysis phase. As the project leader and evaluator discussed the photos, additional outcomes were noted, based on the project leader’s numerous site visits during the 10-year project. Photographs were also integrated into the stakeholder report, providing visual evidence of outcomes that continued to emerge as the grantees used the knowledge and skills they gained.
190
Rockwell
et al. in
American Journal
of
E va lu at i o n 33 (2012)
The data bank of photographs remains on file for future use in presentations, manuscripts, and the classroom. They also serve as a track record for future grants, representing a point in time as KbTUT continues to work to preserve the Tajik heritage and build a stable economy.
Discussion Even though the geoscience and partnership projects dealt with different outcome levels in TOP’s hierarchy, the photographic challenges and advantages were similar. The seven steps were simple to use because each program had outcome-oriented objectives that identified what each program was expected to accomplish. TOP first called for setting the overall social, economic, or environmental target for the programs. Based on this target, additional targets were proposed and described as outcome-oriented objectives. These objectives addressed how photographs would be useful; they provided the context within which photographic events could be identified to address evaluation needs on the program development side (Figure 2). These objectives also supported data analysis; they became the organizational structure for sorting and analyzing the photos. After photographs were sorted appropriately, they helped describe the degree to which targets at each hierarchical level were achieved. Targets were transferred from the program development side to the program performance side where evaluation results determined the degree to which the targets were achieved at each step in the hierarchy and reported as outputs, and immediate, intermediate, or long-term outcomes (Figure 3). On TOP’s performance side, the photographs became powerful additions in the mixedmethod designs and informed the other evaluation strategies. The images gave face validity to evaluator observations. Impressions difficult to easily describe in writing were illustrated; feelings or hunches about a situation were altered, confirmed, or denied. Discussions with program leaders were stimulated and the photographs served as a reliability check for interpreting findings. Knowing the expected outcomes in a given context helped the evaluator understand why a photograph would inform an evaluation question and when photographs needed to be taken to capture appropriate data. Therefore, TOP proved to be a valuable framework for setting photographic targets in the two projects.
Conclusion TOP is useful for establishing photographic targets in nonformal education programs because the program planning and performance sides are mirror images of each other. Employing TOP as a framework to identify photographic events is a two-step process. First, contextual targets are identified at each level in the program-development side and the purpose that photographs will serve is determined. Then a plan is developed to select photographic events that will provide data for the specific contextual targets. Identifying photographic opportunities depends on specific program evaluation needs as well as on the context of the program. General questions to address at each of the seven levels in the hierarchy are: Activities—Will photographs help: • capture nonverbal behaviors of participants, both educators and learners? • verify hunches or feelings about how an educational strategy works or fails? • explore what is working in a program-delivery process? • look at participation and interaction patterns?
Targeting
p h oto g r a p h i c e v e n t s i n n o n f o r m a l e d u c at i o n p r o g r a m s
191
Figure 2. Setting targets in program development (Rockwell & Bennett, 2004).
Figure 3. Assessing the degree to which targets are reached (Rockwell & Bennett, 2004).
Participation and Reactions—Will photographs help: • observe how extensively and intensively engaged participants become in the activity or learning process? • explore participants’ feelings about events and gather more information after an event? • explain the results of other qualitative data? • design additional evaluation processes to better understand findings if needed? Knowledge, Attitude, Skills, and Aspirations (KASA)—Will photographs help: • explain quantitative results testing knowledge and/or assessing attitudes changed? • show participants’ learning and skill development over time?
192
Rockwell
et al. in
American Journal
of
E va lu at i o n 33 (2012)
• illustrate participant involvement in experiential learning processes? • capture role-plays, posters, charts, or other visual activities illustrating knowledge participants acquired? • design additional evaluation processes to better understand if and how participants expect to make changes? Practice Change—Will photographs help: • illustrate new or different practices researchers and instructors are advocating? • show participants implementing new or different practices? • document past, present, or anticipated future practices relative to the educational experience? Social, Economic, and Environmental changes (SEE)—Will photographs help: • show new or different practices being implemented in a community? • show new products or activities in a community? • identify unexpected community outcomes? We believe that photographs can tell an important story in strengthening nonformal education programs as they are developed and tested, and outcome narratives are documented. In two case studies, TOP proved to be an efficient, systematic framework for informing and enhancing other evaluation strategies. Indeed, targeting photographic events using TOP may, over time, help evaluators address challenges posed by the subjectivity of photography and possible biases of the photographer in the research process.
Acknowledgments — The authors would like to thank the persons who gave both oral and written input at the presentation and encouraged them to publish the conclusions. Finally, the authors would also like to thank the reviewers of earlier versions of this article. Their comments, suggestions, and insights helped shape the final article. A PowerPoint at the 2008 conference of the American Evaluation Association in Denver, Colorado (Rockwell, Albrecht, Nugent, Kunz, & Prochaska-Cue) inspired the authors to complete this article. The Geoscience Project was a National Science Foundation grant which included money for evaluation. The case study was one evaluation method included in a multiple method evaluation design. The evaluator’s (i.e., Dr. Kay Rockwell) expenses to accompany the group and collect the data were covered by the grant. Dr. Rockwell was on faculty at the University of Nebraska–Lincoln (UNL) when the data were collected but retired before the reports were written. She analyzed the data and completed the reports without financial compensation after she retired. The Partnership Project was funded through USDA and USAID funds. The USDA Liaison requested follow-up on the 10-year partnership to identify outcomes in Tajikistan. The evaluator’s (i.e., Dr. Kay Rockwell) expenses to collect data in Tajikistan (along with an assistant’s expenses) were covered by a special onetime grant. Dr. Rockwell was on faculty at the University of Nebraska (UNL) when the negotiations started and agreed to do the outcome evaluation. She collected the data, analyzed it, and completed the reports without financial compensation after she retired. The other three authors are on the faculty at UNL and completed their work on the project as part of their UNL assignments.
Targeting
p h oto g r a p h i c e v e n t s i n n o n f o r m a l e d u c at i o n p r o g r a m s
193
References Albrecht, J. A., Prochaska-Cue, K., Rockwell, S. K., & Pulatov, P. A. (2010, December). Introducing extension/ outreach education in Tajikistan. Journal of Extension, 48, Article 6FEA8. Retrieved from http://www.joe.org/joe Becker, J. (1979). Do photographs tell the truth. In T. D. Cook & C. S. Reichardt (Eds.), Qualitative and quantitative methods in evaluation research. Beverly Hills, CA: Sage. Bellman, B. L., & Jules-Rosette, B. (1977). A paradigm for looking: Cross-cultural research with visual media. Norwood, NJ: Ablex. Bessell, A. G., Deese, W. B., & Medina, A. L. (2007). Photolanguage: How a picture can inspire a thousand words. American Journal of Evaluation, 28, 558-569. Collier, J. Jr., & Collier, M. (1986). Visual anthropology: Photography as a research method. Albuquerque: University of New Mexico Press. Fetterman, D. M. (2010). Ethnography: Step by step (3rd ed.). Thousand Oaks, CA: Sage. Fitzpatrick, J. (2000). Dialogue with David Fetterman. American Journal of Evaluation, 21, 242-260. Harper, D. (2002). Talking about pictures: A case for photo elicitation. Visual Studies, 17, 13-26. Heider, K. G. (1976). Ethnographic film. Austin: University of Texas Press. Hurtworth, R., & Sweeney, M. (1995). The use of the visual image in a variety of Australian evaluations. Evaluation Practice, 16, 153-164. Jordan, S., Adams, R., Pawley, A., & Radcliffe, D. (2009, October). The affordances of photo elicitation as a research and pedagogical tool. Proceedings of the frontiers in education conference. San Antonio, TX. Kuehn, D., & Thompson, M. (2007). Evaluating extension efforts along Lake Ontario’s eastern shore. Journal of Extension, 45, Article 3RIB5. Retrieved from http://www.joe.org/joe Llewellyn, D. (2002). Inquire within: Implementing inquiry-based science standards. Thousand Oaks, CA: Corwin Press. Penna, R. M., & Phillips, W. J. (2004). Outcome frameworks: An overview for practitioners (1st ed.). Rensselaerville, NY: The Rensselaerville Institute. Pink, S. (2006). Doing visual ethnography: Images, media and representation in research anthropology. Thousand Oaks, CA: Sage. Rockwell, S. K. (2007). Development and implementation of a field-based inquiry-focused geoscience course for pre-service teachers. Lincoln: University of Nebraska, Nebraska Center for Research on Children, Youth, Families & School. Rockwell, S. K., Albrecht, J., Nugent, G., Kunz, G., & Prochaska-Cue, K. (2008, November). Photography enhances evaluation processes and the study’s usability. Paper presented at the annual meeting of the American Evolutions Association, Denver, CO. Rockwell, S. K., & Bennett, C. F. (2004). Targeting outcomes of programs (TOP): A hierarchy for targeting outcomes and evaluating their achievement. Retrieved from http://digitalcommons.unl. edu/aglecfacpub/48 Rockwell, S. K., Rockwell, L. V., & Albrecht, J. (2006). Outcomes from state department grants to build a stable economy in Tajikistan. Retrieved from http://digitalcommons.unl.edu/ aglecfacpub/50 Spiegel, A. N., Bruning, R. H., & Gidding, L. (1999). Using responsive evaluation to evaluate a professional conference. American Journal of Evaluation, 20, 57-67.
194
Rockwell
et al. in
American Journal
of
E va lu at i o n 33 (2012)
Taylor-Powell, E., & Steele, S. (1996). Collecting evaluation data: An overview of sources and methods. Retrieved from http://www.uwex.edu/ces/pdande/evaluation/evaldocs.html Townsend, M. S., Sylva, K., Martin, A., Metz, D., & Wooten-Swanson, P. (2008). Improving readability of an evaluation tool for low-income clients using visual information processing theories. Journal of Nutrition Education Behavior, 40, 181-186. United Nations Educational, Scientific and Cultural Organization. (1991). International standard classification of education ISCED 1997. Paris, France: Author. White, R., Sasser, D., Borgren, R., & Morgan, J. (2009). Photos can inspire a thousand words: Photolanguage as a qualitative evaluation method. Journal of Extension, 47, Article 3IAW1. Retrieved from http://www.joe.org/joe