Using technology-enhanced boundary objects to develop techno-mathematical literacies in manufacturing industry Arthur Bakker1, University of London and FIsme, Utrecht University,
[email protected] Phillip Kent, Richard Noss, Celia Hoyles, London Knowledge Lab, Institute of Education, University of London;
[email protected],
[email protected],
[email protected] Abstract: Due to the ubiquity of IT in workplaces and increasing customer demands, employees need skills that often remain unrecognised in companies. We draw attention to what we call Techno-mathematical Literacies (TmL) – mathematical knowledge that is situated in the work context and mediated by the available technology. We describe a research project in which we identified through workplace ethnography the TmL required in several industrial sectors. Then we carried out design experiments in which we developed learning opportunities for particular samples of employees. These learning opportunities included technologyenhanced boundary objects (TEBOs) – computer tools that were reconfigurations of symbolic mathematical artefacts that employees use at work but where the underlying mathematical models are mostly unknown and generally poorly understood. In this paper we give examples from manufacturing industry.
1 Introduction There has been a radical shift in the mathematical skills required in modern workplaces, which is only slowly being recognised by employers and educators. In the research project that we describe here, Techno-mathematical Literacies in the Workplace (www.lkl.ac.uk/technomaths), we explored the nature of this shift and developed novel forms of learning intervention to assist employees in developing their mathematical skills. There has been much discussion about “skills gaps” for mathematics in workplaces and the non-transferability of school mathematics. We have argued, on the basis of previous research (e.g., Hoyles, Wolf, Molyneux-Hodgson, & Kent, 2002; Noss, Pozzi & Hoyles, 1999) that there is a need to characterise more precisely the nature of mathematics used in the workplace, and the essential characteristics of the knowledge required in work that is increasingly information technology-mediated. With the ubiquity of IT in many industries, employees now require Techno-mathematical Literacies, mastery of mathematical knowledge that is shaped by the systems that govern their work (Bakker, Hoyles, Kent, & Noss, 2006). We discovered in the sample of manufacturing sectors that we studied, which represent the range of manufacturing from “low-tech” to “high-tech”, that employees often lack these critical skills, and companies struggle to improve them because standard training of mathematical skills that follows the “decontexualised” approach of formal education does not suffice. The research set out to characterise and develop the Techno-mathematical Literacies (TmL) needed for effective practice in workplaces. Common trends in manufacturing are towards high levels of automation and an increasing focus on flexible response to customer needs. This puts a particular stress on skills of employees at the “intermediate” level (i.e. roughly at the level of high-school qualifications, or employment-based equivalents – above basic qualifications but below graduate level), typical roles being senior technical operators on the shop floor or first-level supervisory managers (sometimes called shift leaders). For such employees the new ways of working involve them extensively in communicating with mathematically expressed information in the form of computer input and output, production statistics, statistical analyses of processes, and other paper or computerbased documents that contain information expressed symbolically. The aim of the first research phase was to elaborate the nature of the mathematical skills required by these employees, and to understand how TmL are needed to reason with symbolic information and integrate it into decision-making and communication. In our observations of workplaces, we adopted an explicit mathematical focus from the outset, and sought to identify artefacts used in workplaces which involve symbolic representations of the mathematical relationships inherent in workplace processes. We found that such artefacts were generally intended to communicate between different communities — such as between the manufacturing shop floor, middle and senior managers, and process/systems engineers. Intermediate level employees were often pivotal in such communications. Yet the artefacts often failed in their communicative function. We investigated in detail how these artefacts did or (more often) did not function as communicative devices. This focus, and our desire to enhance as well as understand TmL,
led us to take the notion of a boundary object as an orienting concept for our research. Boundary objects are artefacts that exist in several communities of practice and satisfy the informational requirements of each (Bowker & Star, 1999). In our research we not only identified the TmL required by employees, but also designed learning opportunities that would support employees in developing the appropriate TmL – the aim of the second research phase. One of the key means of support for learning were what we call technology-enhanced boundary objects (TEBOs), which were intended to improve communication in a workplace situation by introducing new software-based forms of mediation for the mathematically expressed knowledge. In the following we first characterise TEBOs and our research methods. We then present the project’s findings in manufacturing industry. Finally we discuss some potential implications for training in workplaces.
2 Technology-enhanced boundary objects Knowledge is problematic in organisations because it is both a critical resource for process improvement and a barrier between the “communities of practice” (cf., Wenger, 1998) or “activity systems” (Engeström, 1999) within an organisation, such as the managers, shift leaders, operators and engineers in a manufacturing context. Knowledge being both a necessity and a challenge, “knowledge boundaries” (Carlile, 2002) are interesting places for research. Star and Griesemer (1989) introduced the notion of boundary object as an analytical focus for understanding communication within and between organisations. Many other researchers have since drawn on this concept, and identified several examples: classifications, scientific categories and standards (Bowker & Star, 1999); cause maps, narrative maps, models, schemes (Boland & Tenkasi, 1995); medical claim forms processed through the different departments of an insurance company (Wenger, 1998). We are especially interested in boundary objects that support engagement with mathematical knowledge, and have found it most productive to develop these in connection with workplace symbolic artefacts that fail to catalyse communication, that is, fail to be boundary objects (for an example see Kent, Noss, Guile, Hoyles, & Bakker, 2007). The issue we focus on here is that one typically needs to re-represent mathematical knowledge so it can be engaged with by employees from different communities, since employees at intermediate level generally lack fluency with standard algebraic symbolisms. Our approach is to reconfigure artefacts from the workplace as computer tools, which we call technology-enhanced boundary objects (TEBO) provided they meet a few criteria. The criteria we define for the computer tools to function as TEBOs are partially derived from the definition of boundary object: they should be used in different communities and satisfy informational needs of each. Measures of successful use were: continued use in company training courses, trainees’ positive feedback about effects on their workplace practice, and dissemination of the tools by companies to other user communities with whom we have not engaged. In designing the TEBOs, we have deployed several design principles. First we identified symbolic artefacts that were, from our perspective, intended to be boundary objects in the workplace but turned out to be problematic due to employees’ lack of understanding of the mathematics behind them. Next we re-represented them appropriately so they could assist us in revealing the underlying mathematical models on which they were based. Hence design principle 1 is: re-represent familiar artefacts in order to reveal relevant mathematical structures to employees. We adopted a broadly constructionist approach to the learning opportunities (see, e.g., Harel & Papert, 1991), which involves participants building and manipulating computational representations of mathematical ideas, and requiring them to express their own ideas through the use of appropriate tools. Design principle 2 can be summarised as: use software tools in ways that require participants simultaneously to construct or reconfigure symbolic artefacts and negotiate the meanings around them, and to map these back onto familiar practices. A third design principle is to co-design with experts from the communities involved (such as managers, trainers, and engineers). Without their knowledge of the workplace’s contingencies the tools will most likely fail to have sustained impact on practice. The TEBO tools developed in the research are accessible at the project website (www.lkl.ac.uk/technomaths/tools).
3 Research methods We undertook our research in collaboration with companies, employer federations and vocational training organisations in four manufacturing and service sectors in the UK: Financial Services, Pharmaceuticals Manufacturing, Packaging and Automotive Manufacturing. In each sector, we visited three to four companies for ethnographic investigation, comprising typically 5 to 10 persondays of site visits, in order to identify and characterise the TmL needed to function effectively in each workplace. Methods used included work-shadowing, analyses of documentation and semi-structured
interviews with managers and a wide range of employees. We progressively focused on probing the meanings held by different groups involved in the work process for the symbolic inputs and outputs of IT systems that were intended as boundary objects. We also joined team meetings and process improvement teams in manufacturing. In the second research phase, we carried out iterative design-based research (Cobb, Confrey, diSessa, Lehrer, & Schauble, 2003) with our employer-partners to design learning opportunities and develop TEBOs aimed at developing the TmL identified in the first phase. This research phase on learning opportunities involved two or three companies in each sector, comprising typically 10 to 15 person-days of site visits. All the tools could be accessed through a web browser to ensure maximum availability in workplace settings. The learning opportunities were embedded in activity sequences largely derived from authentic episodes recorded in Phase 1 or reported by employer-partners. The tools and activities aimed to allow exploration and discussion of the interconnections between the different inputs and outputs within the normally invisible mathematical models. The effectiveness of our approach to TmL development was assessed through follow-up interviews with participants (face-to-face, telephone and email) and continuing communication with employer-partners to assess impact in workplace practices. The design-based approach, with its iterative cycles of collaborative design, testing and revision also led us to more nuanced understandings of TmL and their use in the workplace, since employees' interactions with our software tools provided further data about their appreciation of underlying models. In evaluating and validating our research, we made use of data from diverse sources. These include: workplace artefacts such as graphs, charts and financial statements sent to customers; audio and occasionally video recordings of workplace observations and interviews; email trails with codesigners; evaluation forms; questionnaires. We sought to triangulate different views of the same workplace activity, through the perspectives of employees at different levels of a company, as well as consulting independent experts in the industry sectors concerned, in order to guard against biased observations.
4 Results of the research: two examples Our research in manufacturing developed along two themes, both connected to the drive for greater quality and productivity in manufacturing processes: modelling the manufacturing process (4.1), and statistical process control (4.2). We provide two examples for illustrative purposes.
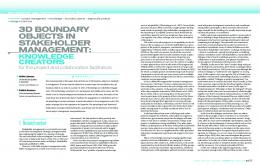
Figure 1. A screen-shot of part of the computer control system for the film production process
4.1 Modelling manufacturing processes In a packaging factory making plastic film by an extrusion process, we investigated how the computer control and monitor system served as a boundary object between managers, engineers and shopfloor machine operators. The extrusion process is complex, involving about twenty steps: the plastic starts from raw granules, is melted to form a tube (about 350 micrometres thick), which travels through several stages as a flat “tape” and is then extruded (stretched) at different temperatures and tensions (that need to be very precisely controlled), becoming thinner at each stage until the desired thickness is reached (e.g., 19 micrometres, called “gauge” in Figure 1). The most sensitive stage of the extrusion process is at what is known as “the bubble” – where the tape is inflated with compressed air so that it expands by a factor of about 25. In Figure 1, this bubble is represented by the white shape in
the centre. The white “thread” shows the flow of the film through various production stages, with temperatures, pressures, etc. displayed, terminating in the bubble. Each extrusion line is controlled by a computer system that monitors and records numerous process parameters – typical display screens (see Figure 1) present “flow diagrams” representing actual quantities and flows such as the temperatures and pressures at different points in the line. The computer system records all these process data and stores them as historical data for several months (see Figure 2). These historical records are accessible to all, although our ethnography (Noss et al., 2007) indicated that just one or two intermediate level employees (the senior shopfloor operators and the line managers) engaged with these as a way of making sense of what the process had been doing; and there was no official encouragement from senior management to do this. The process engineer working in this area was however personally convinced that if shopfloor employees were able to engage with this data, the result would be to have a much improved model of the process; this would lead to more effective operator control of the process and much more efficient production for the company.
Figure 2. graphs of the “historical” data. Several graphs are displayed on a single scale: there are eight different scales implicit on the y-axis. Time frame on x axis is 5 hours. In the first research phase we identified the following TmL: understanding systematic measurement, data collection and display; appreciation of the complex effects of changing variables on the production system as a whole; being able to identify key variables and relationships in the work flow; and reading and interpreting time series data, graphs and charts, some of which are standard and some idiosyncratic and company-specific. We also noted the need for employees to be able to control the process for target mean and minimal variation, and to communicate about these values with other employees and with management. Finally, we identified a need for employees to appreciate the role of invisible factors – such as the cost of raw materials and selling price of the product – in determining the target mean and variation of the physical film, none of which were evident in the computergenerated data available. The TEBO we co-designed with one of the process engineers was a software simulation of the production process of making plastic film by extrusion (see Figure 3). To reduce the complexity, just the start and end parts of the process are modelled, but the format of the real systems is imitated (cf., Figures 1 and 2). Numbers in the white boxes are inputs or parameters that the user can modify. The goal is to achieve stable running of the process with film gauge (thickness) at a required target. It is crucial not to make changes that “burst the bubble” on the right (this in practice stops the production process for about an hour). The graphs in the middle show historical data for 9 variables: the top set are inputs or parameters for the start of the process, the bottom set are for the end part of the process; on each graph, an appropriate scale appears when a given variable is selected.
We designed learning activities concerned with real events where inputs and control parameters in the process have to be changed by the machine operators and outputs interpreted. For example, if one part of the process machinery is broken or missing, how can the parameters be adjusted to compensate for this and keep the process running? Employees were invited to predict and test outcomes and thus come to appreciate aspects of the mathematical relationships embedded in the process. Initially we introduced these activities to employees, but the engineer of this production area quickly came to do the training herself.
Figure 3. Software tool to model the production of plastic film by extrusion The employees and engineer who co-developed the TEBO with us were very positive about the learning opportunities. The engineer: “If every operator and shift leader went through training using the tool there would be a base-line level of understanding that we risk not getting with the observational style training we currently use.” There were also unexpected payoffs like the following, which exemplifies what successful boundary objects may achieve. The engineer further told us: I think the tool also helps identify people’s strengths and weaknesses not only in terms of filmmaking process understanding but also logical problem solving ability. I didn't expect this. After going through the training activities with him, I now know far more about William and the way he thinks about things than I knew before. Speaking as someone who hates open-ended tasks, I'm pleased I can now give them all to William! The engineer’s surprise here was at the extent of William’s knowledge of the process, which he had never made evident on the shopfloor (“he does not say much, does his job and goes home”), and which was inevitably (because of the workplace culture) something he lacked words to express, but could display in working with the simulation. She was also pleased with the extent to which he was able to apply a logical problem-solving approach to dealing with the process problems posed in the simulated activities – one of these involved dealing with a speed restriction on a motor in one part of the process (“which he solved almost without thinking about it ”).
4.2 Statistical Process Control (SPC) SPC is a set of techniques widely used in workplaces as part of process improvement activities (Oakland, 2003; Pyzdek, 2001). Using such techniques requires many employees to interpret and communicate one-number process measures, which we have observed to be challenging in terms of mathematical and contextual knowledge required. In several car factories we investigated how “process capability indices” were used and trained, and found that the typical introduction of such measures deploys statistical and algebraic symbolism as well as laborious manual calculations that seemed to hinder employees’ understanding of the underlying mathematical relationships. Working in partnership with company trainers, we developed tools and activities to enhance existing training and shopfloor practice. In the first research phase (see also Hoyles, Bakker, Kent, & Noss, 2007) we identified the following TmL: understanding systematic measurement, data collection and display; appreciation of the complex effects of changing variables on the production system as a whole; being able to identify key variables and relationships in the work flow; reading and interpreting time series data, graphs and
charts; distinguishing mean from target and specification and control limits; knowing about the relation between data and measures and process and model; understanding and reducing variation, and appreciating the basis of process capability indices and how they are calculated. The main putative boundary object we focused on was the SPC chart as filled in and used on the shop floor; see Figure 4 for an example.
Figure 4. Example of an SPC chart, an intended boundary object We developed three TEBOs (two are displayed in Figures 5 and 6) that comprised simulations to make the statistical concepts used in SPC training courses more understandable for intermediatelevel employees by a) simulating the physical experiments that trainees did to generate sample process data, so that after doing them manually they were able to generate much larger data sets in the software, making statistical patterns and trends easier to perceive, and b) allowing direct manipulation of capability measures with visual feedback, alongside the algebraic formulae that are quoted to trainees but, unsurprisingly, barely understood.
Figure 5. Re-configuration of the SPC chart and simulation of shove ha’penny game The first tool (Figure 5) provides a context for the process capability indices Cp and Cpk by demonstrating how they can be used in practice to improve a process; in this “process improvement” version of the British pub game of shove ha’penny, a ruler is attached to a flat board and is used to flick coins along it. The simulation allows the user to see repeatedly generate trials of 50 ‘flicks’, plotting where the coin stops each time on the SPC Chart. The player attempts to improve the process
by altering several key process parameters. Two other tools model Cp and Cpk (Figure 6 just shows the Cpk tool), measures for how well a process is under control and meeting required targets. They turned out to be a visual and interactive representation to help employees understand how these measures depend on the statistical behaviour of physical data and the imposed human specification of targets. The accompanying learning activities were derived from the company training courses or designed to stimulate exploration of key mathematical concepts, and expose misunderstandings around basic, but difficult, concepts of statistical mean and process target, control limit (derived from data) and process specification (set by external concerns and constraints) and the normality of the distribution – not as decontextualised statistical concepts but in relation to production processes.
Figure 6. Software tool which models Cpk, a process capability index – re-represented to make it easier for employees to engage with the underlying mathematical relationships The software tools were highly appreciated by many managers, engineers, trainers and employees. Even after the end of the research project we kept hearing stories about international meetings at which they had been demonstrated, how they facilitated communication between company engineers and managers or suppliers, and how they had enhanced training courses. Based on the feedback, we feel confident that we can consider that these tools satisfy the criteria for TEBOs.
5 Discussion and implications The need for Techno-mathematical Literacies (TmL) is most evident in workplaces that are involved in changes in working practices. However, even in sites where the need for change is recognised and supported, we did not find that the need for TmL is sufficiently recognised throughout a company. Long-established preconceptions about mathematics are deeply ingrained, both in the world of work and the world of education. One way these reveal themselves is where employers complain about “poor numeracy skills” in practices, such as financial services, where the need for employees to do arithmetic hardly exists due to the total computerisation of processes. A central challenge for skills development is to educate both employees and managers about the mathematical models and relationships that actually matter but are rendered invisible by IT within workplaces. The skills gap of techno-mathematical literacies needs to be systematically addressed by employers – we think by working together with educators. It needs commitment of time and resources on the part of employers not only to come to terms with the need for this new kind of mathematical understanding, but also to develop new pedagogical approaches for training, so as to make TmL more visible and available for exploration and development. The major skills deficit at issue is the understanding of systems, not the ability to calculate. Whilst calculation and basic arithmetic remain of subsidiary importance our research suggests they are insufficient. Of far greater importance is a conceptual grasp of how, for example, process improvement works, how graphs and spreadsheets may highlight relationships, and how systematic data may be used with powerful, predictive tools to control and improve processes. The methodology of collaborative design involving researchers and employer-partners has received rather little attention in research in the workplace. It seems this is partly due to such research
falling between several more established domains of research: on the one hand sociological and economic studies of employment, skills and labour markets, which tend towards general conceptions of knowledge and skills rather than specific, technical knowledge domains such as mathematics; and on the other hand educational research in mathematics or science learning which have well-established methods of intervention (in classrooms) and collaborative work with users (teachers) but have been dominantly focused in formal education. It is undoubtedly a challenge for all participants in multidisciplinary collaborative research who have to strive continually to develop a common discourse. Yet our research points to its considerable potential, not only in bringing together the range of expertise essential to address technical skills gaps, but also by offering a way to sustain change in practice as employers gradually take control of what began as a researchers-led intervention supported by technology-enhanced boundary objects.
Endnote (1) The research reported out here was carried out at the University of London; the first author is currently working at the Freudenthal Institute for Science and Mathematics, Utrecht University.
References Bakker, A., Hoyles, C., Kent, P., & Noss, R. (2006). Improving work processes by making the invisible visible. Journal of Education and Work, 19, 343-361. Boland, R. J., & Tenkasi, R. V. Perspective making and perspective taking in communities of knowing. Organization Science, 6, 350-372. Bowker, G. C., & Star, S. L. (1999). Sorting things out. Classification and its consequences. Cambridge, MA: MIT Press. Carlile, P. R. (2002). A pragmatic view of knowledge and boundaries: Boundary objects in new product development. Organization Science, 13, 442-455. Cobb, P., Confrey, J., diSessa, A. A., Lehrer, R., & Schauble, L. (2003). Design experiments in educational research. Educational Researcher, 32, 9-13. Engeström, Y. (1999). Expansive visibilization of work: An activity-theoretical perspective. Computer Supported Cooperative Work, 8, 63-93. Harel, I., & Papert, S. (Eds.). (1991). Constructionism. Norwood, NJ: Ablex Publishing. Hoyles, C., Bakker, A., Kent, P., & Noss, R. (2007). Attributing meanings to representations of data: The case of statistical process control. Mathematical Thinking and Learning, 9, 331-360. Hoyles, C. Wolf, A., Molyneux-Hodgson, S. & Kent, P. (2002). Mathematical skills in the workplace. London: The Science, Technology and Mathematics Council. Kent, P., Noss, R., Guile, D., Hoyles, C., & Bakker, A. (2007). Characterizing the use of mathematical knowledge in boundary-crossing situations at work. Mind, Culture, and Activity, 14, 64-82. Noss, R., Bakker, A., Hoyles, C., & Kent, P. (2007). Situating graphs as workplace knowledge. Educational Studies in Mathematics, 65, 367 - 384. Noss, R., Pozzi, S., Hoyles, C. (1999). Touching epistemologies: Statistics in practice. Educational Studies in Mathematics, 40, 25-51; Oakland, J. S. (2003). Statistical process control (5th ed.). Amsterdam: Butterworth-Heinemann. Pyzdek, T. (2001). The Six Sigma handbook. New York: McGraw-Hill. Star, S. L., & Griesemer, J. (1989). Institutional ecology, 'translations,' and boundary objects: Amateurs and professionals in Berkeley's Museum of Vertebrate Zoology, 1907-1939. Social Studies of Science, 19, 387-420. Wenger, E. (1998). Communities of practice: Learning, meaning, and identity. Cambridge: Cambridge University Press.
Acknowledgements We gratefully acknowledge funding of the research by the United Kingdom Economic and Social Research Council’s Teaching and Learning Research Programme [www.tlrp.org], grant number L13925-0119. The first author is currently supported by the Netherlands Organisation for Scientific Research under grant number 411-06-205.