Using the correlation dimension to detect non-linear dynamics: Evidence from the Athens Stock Exchange
David Chappell University of Sheffield & Theodore Panagiotidis Loughborough University
Abstract : The standardised residuals from GARCH models fitted to three stock indices of the Athens Stock Exchange are examined for evidence of chaotic behaviour. In each case the correlation dimension is calculated for a range of embedding dimensions. The results do not support the hypothesis of chaotic behaviour; it appears that each set of residuals is iid. Key words: Non-linear Dynamics, Stock Indices, Chaos, Correlation Dimension
Corresponding author: Professor David Chappell Department of Economics University of Sheffield 9, Mappin Street Sheffield S1 4DT, UK Email:
[email protected] Tel +44 (0)114 222 3417 Fax +44 (0)114 222 3458
INTRODUCTION A large body of literature has accumulated over the past three decades concerning the validity of the weak-form efficient markets hypothesis (EMH) in financial economics. The weak-form of the EMH postulates that successive oneperiod stock returns are independent and identically distributed (iid), i.e. the price levels resemble a random walk. At the same time it is well known that stock returns are characterised by volatility clustering. Additionally we usually observe large returns to be followed by large returns and small returns to be followed by small returns, leading to contiguous periods of volatility and stability. Although most of the empirical tests of the efficient markets hypothesis are based on linear models, interest in nonlinear processes has experienced a tremendous rate of development over the last few years (for an excellent review see Barnett and Serletis 2000). In this paper, we will examine how the introduction of the single European currency has affected earlier claims in the literature that the Athens Stock Exchange (ASE) is characterised by deterministic chaos as the ASE is in the process of becoming a fully developed capital market1. A limited number of studies have appeared in the literature providing empirical results for the ASE (for a review see Panagiotidis 2003). None has tested for the presence of nonlinear dynamics (other than GARCH) after the introduction of the common currency. Siriopoulos (1996) used monthly observations of the ASE General Index from 1974:1 to 1994:6. Using the BDS test statistic and the correlation dimension, it was concluded that a GARCH model could not explain the nonlinearities of the series that might be generated by “semi-chaotic behaviour”. Barkoulas and Travlos (1998) used daily observations of the ASE30, the 30 most
1
marketable stocks, from January 1981 to December 1990. Models including an AR(p) and a GARCH (1,1) were employed and diagnostic tools such as BDS, correlation dimension and Kolmogorov entropy were estimated. They concluded that “the BDS test detects remaining unspecified hidden structure in the Greek stock returns” but “ do not find evidence in support of a chaotic structure in the Athens Stock Exchange”. Niarchos and Alexakis (1998) followed a different methodology to test the EMH in the Athens Stock exchange. They used error correction models and compared the speed of adjustment. Their evidence rejected the EMH. More recently, Apergis and Eleptheriou (2001) examined market volatility using daily observations of the ASE General Index for the period January 1990 to July 1999. They compared different GARCH models based on the log likelihood and concluded that “the presence of persistence in volatility clustering implies inefficiency of the ASE market”. Lastly, Siourounis (2002) employs GARCH type models and tests for their validity using a data set of daily closings of the ASE General Index for the period of 4th January 1988 until 30th October 1998. The Ljung-Box test statistic is employed as a diagnostic tool and it was found that “the GARCH(1,1) and LGARCH(1,1) models can explain quite satisfactorily the dependencies of the first and second moments”.
CORRELATION DIMENSION Grassberger and Procaccia (1983) suggested the correlation dimension as a tool for distinguishing random from chaotic time series. To briefly discuss this, let us start with the 1-dimensional series,
{xt } nt =1 ,
and from this form the sequence of
N = n − m + 1 m-dimensional vectors X s = {x s , x s +1 ,...., x s + m−1}ns=−1m+1 . The selected
1
In July 2000 Morgan Stanley announced the change in the classification of the MSCI Greece Index from an emerging to a developed market index with effect from the 1st of June 2001 (see http://www.msci.com/pressreleases/archive/pr000731.html).
2
value of m is called the embedding dimension and each Xs is known as an m-history of the series { x t } t =1 . This converts the original scalar series into a shorter series of N (mn
dimensional) vectors with overlapping entries. Assuming that the true, but unknown, system which generated { x t } t =1 is n
θ-dimensional and provided that m
≥ 2θ +1, then the set of m-histories recreates the dynamics of the data generation process and can be used to analyse the dynamics of the system - see Takens (1981). The correlation dimension is based on the correlation function (or correlation integral), C ( N , m, ε ) =
2 # {( s, t ) | 1 ≤ s, t ≤ N } , where # denotes the number of N ( N − 1)
log(C ( N , m, ε ) . ε →0 log(ε )
elements in the set. The correlation dimension is defined as DCm = lim
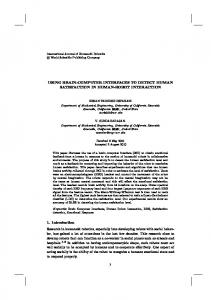
In practice, one estimates D cm for m = 1, 2, 3,….,k for k no larger than around 10. If, as m increases, D cm continues to rise then this is symptomatic of a stochastic system. If, however, the data are generated by a deterministic process (consistent with chaotic behaviour), then D cm will reach a finite limit at some relatively small m. The correlation dimension can therefore be used to distinguish true stochastic processes from deterministic chaos (which may be low-dimensional or high-dimensional). Figure 1 illustrates the theoretical relationship between log(C ( N , m, ε ) and
log(ε ) (see Chappell & Eldridge, 1977). For a ≤ log(ε ) ≤ b , ε is ‘too small’ and very few m-histories lie with a distance ε of each other. For log(ε ) > c , ε is ‘too large’ and all m-histories will lie within a distance ε of each other. For b < log(ε ) < c ,
C ( N , m, ε ) increases as m increases; C ( N , m, ε ) is the slope of the line for
b < log(ε ) < c . This slope will increase initially as m is increased
3
Figure 1: Theoretical relationship between log(C ( N , m, ε )) and log(ε )
log(C ( N , m, ε ))
c
d
a b log(ε )
0
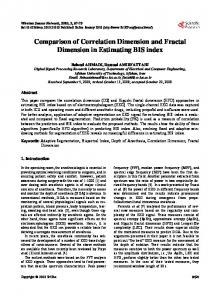
Figure 2 shows the theoretical relationship between DCm and m for a purely random series and a possibly chaotic series (Chappell & Eldridge, 1997).
Figure 2: Theoretical relationship between D Cm and m for a purely random series and a possibly chaotic series .
D Cm Random
Possibly chaotic: Necessary condition
m 0
4
While the correlation dimension measure is therefore potentially very useful in testing for chaos, the sampling properties of the correlation dimension are, unfortunately, unknown. As Barnett et al (1997, pp. 306) put it “if the only source of stochasticity is observational noise in the data, and if that noise is slight, then it is possible to filter the noise out of the data and use the correlation dimension test deterministically. However, if the economic structure that generated the data contains a stochastic disturbance within equations, the correlation dimension is stochastic and its derived distribution is important in producing reliable inference”. Moreover, if the correlation dimension is very large as in the case of highdimensional chaos, it will be very difficult to estimate it without an enormous amount of data. In this regard, Ruelle (1990) argues that a chaotic series can only be distinguished if it has a correlation dimension well below 2log10 N, where N is the size of the data set, suggesting that with economic time series the correlation dimension can only distinguish low-dimensional chaos from high-dimensional stochastic processes - see also Grassberger and Procaccia (1983) for more details. This paper will investigate the following conflicting claims.
Panagiotidis
(2003) used a battery of tests which signalled that the standardised residuals of the preferred GARCH models are iid processes. However, this does not exclude the case of deterministic chaos (looks random, but isn’t). On the other hand, there are claims in the literature (see Barkoulas and Travlos 1998, and Siriopoulos 1996)) that the ASE is being determined by chaotic dynamics. To proceed, the standardised residuals from the estimated GARCH models2 in Panagiotidis (2003) are examined and the correlation dimension is calculated for a range of embedding dimensions. As mentioned above, if the data under consideration contain a detectable non-linear deterministic component, the correlation dimension should increase with
5
increasing values of the embedding dimension. However, this should level off at some point and remain constant for all further values of the embedding dimension (see figure 2). On the other hand, if the true data generating process is purely random, then we would expect the correlation dimension always to increase with the embedding dimension. The outcome is presented in Figures 3, 4 and 5. In each of these, the embedding dimension is on the horizontal axis and the correlation dimension is on the vertical axis and the calculations were carried out using a program by Sprott (1998). It is clear in each of these figures that the correlation dimension keeps on increasing as a function of the embedding dimension and there is no sign that this levels off at some point in any of the series. Consequently, we could argue that there is no evidence to suggest that any form of chaotic non-linear deterministic process is present in the standardised residuals of the preferred GARCH models for the three indices. This finding further reinforces our argument that the series under investigation are iid.
CONCLUSIONS In this paper, we have examined the claim that there is chaotic behaviour in the ASE . We feel that this was an interesting exercise since this stock market has recently joined the Euro zone. To sum up, we argued against the chaos hypothesis in the case of the ASE. Firstly, there are theoretical reasons, which are explained in Lalley (1999). Lalley discusses the restricted number of cases where it is impossible to recover the original time series when there is an added noise component. Secondly, on an empirical level, the correlation dimension failed to provide any evidence in favour of chaotic dynamics.
2
The three estimated equations are reproduced in the appendix.
6
Figure 3: Correlation Dimension for the standardised residuals of the preferred GARCH model of the ASE ─ FTSE
Correlation Dimension - FTSE20 7 6 5 4 3 2 1 0 1
2
3
4
5
6
7
8
9
10
20 Figure 4: Correlation Dimension for the standardised residuals of the preferred GARCH model of the ASE ─ FTSE Mid 40
Correlation Dimension - FTSE Mid 40 7 6 5 4 3 2 1 0 1
2
3
4
5
6
7
7
8
9
10
Figure 5: Correlation Dimension for the standardised residuals of the preferred GARCH model of the ASE ─ FTSE Small Cap Index
Correlation Dimension - FTSE Small Cap 7 6 5 4 3 2 1 0 1
2
3
4
5
6
7
8
9
10
REFERENCES Apergis, N. and Eleptheriou, S. (2001), Stock Returns and Volatility: Evidence from the Athens Stock Exchange, Journal of Economics and Finance, 25, 50-61.
Barkoulas, J. and Travlos, N. (1998), Chaos in an emerging capital market? The case of the Athens Stock Exchange, Applied Financial Economics, 8, 231-243.
Barnet, W.A., A.R. Gallant, M.J. Hinich, J.A. Jungeilges, D.T. Caplan, and M.J. Jensen (1997), A single-blind controlled competition amongst tests for nonlinearity and chaos, Journal of Econometrics, 82, 157-92.
Barnett, W.A and Serletis, A. (2000), Martingales, nonlinearity and chaos, Journal of Economics Dynamics and Control, 24, 703-24.
Chappell, D., and Eldridge, R.M. (1997), Nonlinear characteristics of the Sterling/ECU exchange rate: 1984-1992, The European Journal of Finance, 3, 159-182.
8
Grassberger, P. and Procaccia, I. (1983), Measuring the Strangeness of Strange Attractors, Physica, 90, 189-208.
Lalley, S.P. (1999), Beneath the noise, chaos, The Annals of statistics, 27, 2, 461-479.
Panagiotidis T. (2003), Market Efficiency and the Euro: The case of the Athens Stock Exchange, Discussion paper 03-08, Department of Economics and Finance, Brunel University.
Ruelle, D., (1990), Deterministic Chaos: The Science and the Fiction, Proc. R.Soc. London A 427 (1873), 241-248.
Siourounis, G. (2002), Modelling volatility and testing for efficiency in emerging capital markets: the case of the Athens stock exchange, Applied Financial Economics, 12, 47-55.
Siriopoulos, C. (1996), Investigating the behaviour of mature and emerging capital markets, Indian Journal of Quantitative Economics, 11, 1, 76-98.
Sprott, J.C. (1998), Chaos Data Analyzer, Professional Version 2.1, University of Wisconsin at Madison, Madison, WI 53706, USA.
9
APPENDIX The three estimated equations from Panagiotidis (2003) are given below. Data are daily returns for the three stock indices, calculated from daily closing prices, and the sample period is from 1st June 2000 to 31st December 2002. Rt is the daily return, σ t2 the conditional variance and ε t2−1 the lagged squared residual. Numbers in parentheses are the corresponding t statistics. It is the standardised residuals from each of these equations for which correlation dimensions are calculated, and illustrated in Figures 3 – 5 in the main text3.
1. The ASE FTSE 20 Index
RtASEFTSE 20 = − 0.0006355 + 0.314054 σ ( 2.32 )
(1.67 )
σ t2 = 0.000339 + 0.16374 ε t2−1 + 0.7033 σ t2−1 (3.54 )
(5.73)
(12.88)
2. The ASE FTSE Mid 40 Index 40 RtASEFTSEMID 40 = −0.004866+ 0.1226 RtASEFTSEMID + 0.21473σ −1 (2.54)
(2.92)
(1.79)
σ t2 = 0.0000714+ 0.122 εt2−1 + 0.862σ t2−1 (2.33)
(6.84)
(46.01)
3. The ASE FTSE Small Cap Index
RtASEFTSESMALLCAP = −0.0001725+ 0.1387 RtASEFTSESMALLCAP −1 (2.2)
(2.34)
σt2 = 0.0000183+ 0.1521εt2−1 + 0.7983σt2−1 (2.11)
(5.82)
(18.78)
3
For more information on the indices and their composition http://www.ase.gr http://www.ftse.com . The data are available free from http://www.enet.gr/finance/finance.jsp .
10
and