VALIDATING MODELLED DEEP DRAINAGE ESTIMATES FOR THE QUEENSLAND. MURRAY-DARLING BASIN. J.S. OwensA, P.E. TolmieA and D.M. SilburnA.
ISCO 2004 - 13th International Soil Conservation Organisation Conference – Brisbane, July 2004 Conserving Soil and Water for Society: Sharing Solutions
VALIDATING MODELLED DEEP DRAINAGE ESTIMATES FOR THE QUEENSLAND MURRAY-DARLING BASIN J.S. OwensA, P.E. TolmieA and D.M. SilburnA A Agricultural Production Systems Research Unit (APSRU); Queensland Department of Natural Resources, Mines & Energy; Toowoomba, Australia.
Abstract Accelerated rates of drainage below the root zone can lead to rising water tables, which may in turn lead to land and stream salinity. Estimating rates of deep drainage is an important part of predicting salinity risk. Water balance modelling is widely used to estimate deep drainage. However, model outputs of deep drainage have rarely been validated in the past because of a lack of data. Estimates of deep drainage are now available for the Queensland Murray Darling Basin from several sources. This paper presents preliminary validation of modelled deep drainage against these data. Two daily water balance models, GRASP and PERFECT, were used for different soils and land uses, using ‘default’ parameter values. Relationships of modelled water excess (runoff plus drainage) and average annual rainfall were similar to published relationships (Zhang et al. 2001), although modelled estimates give much greater differentiation between soils. Modelled drainage rates were of a similar order of magnitude to estimates determined from a transient chloride mass balance approach for native vegetation and cropping sites, and for a detailed catchment study. This improves confidence in drainage modelling, which is used to assess salinity risk in areas where measurement is impractical. Additional Keywords: salinity, water balance, chloride balance, runoff Introduction Drainage of water below the root zone (described as deep drainage) can lead to rising water tables and lateral transfer of water and salt, which may in turn lead to land and/or stream salinity, through mobilisation of salts in the regolith. The measurement or estimation of deep drainage is therefore an important factor in predicting salinity. Water balance modelling is one of the techniques widely used to estimate deep drainage. These water balance models are useful for exploring the effect of climate, soil, land use and management practice on deep drainage. Water balance models such as PERFECT and GRASP have been developed and used in Queensland for several decades. These models have been validated against measured runoff, soil water, yield and cover data in grazing and cropping systems (e.g. Littleboy et al. 1989, 1992, Silburn and Freebairn 1992, Day et al. 1997, Owens et al. 2003). However, there is little previous research on deep drainage in the Queensland Murray-Darling Basin (QMDB) and hence model outputs of deep drainage have been poorly validated. Tolmie et al. (2003) have recently provided long term estimates of deep drainage for several soils and land uses in the QMDB using transient chloride mass balance. Sites were either long-term trial sites where crop, soil water and sometimes runoff measurements were available, or on-farm paired (native vegetation, crop) sites. The aim of the current study was to validate modeled estimates of deep drainage occurring under a range of land uses and soil types in the QMDB. This will provide more confidence in using soil water balance models for drainage estimation to feed into salinity risk models. Drainage estimates from other methods combined with measured field data will increase confidence in modeled drainage rates. Materials and Methods The study area is the northern component of Australia’s largest drainage system, the Murray-Darling Basin (Map 1). The modelling tools used were PERFECT (Littleboy et al. 1989) to represent cropping, and GRASP (Littleboy and McKeon 1997) to represent native pastures and trees. Data sources Sources of deep drainage estimates for different soils and land uses in the Queensland Murray-Darling Basin were: 1. General trends (Zhang et al. 2001) 2. Drainage estimates using soil chloride (Cl) methods (Tolmie et al. 2003) 3. Measured data at experimental sites Paper No. 742
page 1
ISCO 2004 - 13th International Soil Conservation Organisation Conference – Brisbane, July 2004 Conserving Soil and Water for Society: Sharing Solutions
Zhang et al. (2001) collated results from 250 catchments worldwide, which showed good relationships between long-term average actual evapotranspiration (ET) and rainfall for two vegetation classes - forest and herbaceous plants. Static models built from these data are referred to in the literature as the Zhang curves. The transient chloride mass balance approach of estimating drainage compares time series or paired site chloride concentration profiles to infer the rate of water movement below the root zone (Tolmie et al. 2003).
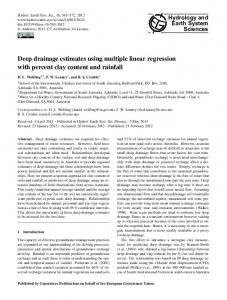
Map 1. Queensland Murray Darling Basin (QMDB).
Modelled estimates of deep drainage for different soils and land uses in the QMDB To obtain general trends of drainage across the QMDB, GRASP and PERFECT were run from 1900 to 2001, for 38 locations for 17 soils and 7 land uses. This covered most common combinations within the QMDB. The models were previously validated against hydrologic data across northern Australia (e.g. Littleboy et al. 1989, 1992, Silburn and Freebairn 1992, Day et al. 1997, Owens et al. 2003) but not for drainage. The drainage estimates from the matrix of model runs are based on representative soil profiles. As such, the drainage estimates have not been comprehensively validated at each location. However, results do indicate in relative terms the impacts of rainfall, soil type and land use on drainage. Results from this ‘best bet’ modelling (carried out before the drainage data were available) were compared, without calibration, with general trends (Zhang curves) and with drainage estimates obtained using the chloride method. Site specific modeling at Greenmount Water balance modelling was also tested in more detail at a site with long term cropping and water balance data, and an average drainage estimate for 1977-1996 from chloride (Tolmie et al. 2003). The runoff trial at Greenmount was established in 1976 on a black cracking clay soil or Vertosol (Freebairn and Wockner 1986). Runoff and soil erosion was previously modelled using data for 1976 to 1983 (Littleboy et al. 1989, 1992, Silburn and Freebairn 1992). Here the PERFECT model was run for the wheat-fallow treatment using measured soil, crop and management data from 1976 to 1996. Crop growth parameters were adjusted against measured crop yield, but otherwise parameters were measured (e.g. plant available water capacity, PAWC) or from previous modelling studies (i.e. for runoff, hydraulic conductivity and soil evaporation). The site was also modelled with general crop parameters and planting and tillage dates as used in the generic matrix of model runs, to see if acceptable results could be obtained without using detailed information like farm operations dates (eg planting, tillage and burning). Results and Discussion General trends across the QMDB Long-term annual average ET and water excess (runoff plus drainage) derived using the GRASP model for native vegetation are in agreement, on average, with the Zhang model for forests (Figure 1). Long-term annual average ET and water excess derived using the PERFECT model for winter cropping agree, on average, with the Zhang curve for herbaceous plants (Figure 2). Keating et al. (2002) found similar results using APSIM for a red Earth at sites across the Murray Darling Basin.
Paper No. 742
page 2
ISCO 2004 - 13th International Soil Conservation Organisation Conference – Brisbane, July 2004 Conserving Soil and Water for Society: Sharing Solutions
(a)
(b) Zhang ET curve (forests)
1000 800 600 400 200 0 0
500
1000
Black Vertosol
350 Annual average water excess (mm)
Annual average evapotranspiration (mm
Grey Vertosol
400
1200
Water excess curve for forests (from Zhang)
300
Brow n Vertosol Red Vertosol Black Dermosol
250
Brow n Dermosol Red Dermosol
200
Red Kandasol Tenosol
150
Yellow Sodosol
100
Grey Sodosol Black Sodosol
50
Brow n Sodosol Red Sodosol
0 0
1500
500
1000
1500
Red Chromosol
Annual average rainfall (mm)
Annual average rainfall (mm)
Rudosol
Red Ferrosol
Figure 1. Predictions of average ET and water excess for native vegetation for 38 locations and 17 soils compared with the Zhang ET curve (forests).
700
Grey Vertosol
700
Zhang ET curve (herbaceous plants)
600 500 400 300 200 100 (a) 0 0
500
1000
Annual average rainfall (mm)
1500
Black Vertosol
Water Excess Curve (from Zhang)
600 Annual average water excess (mm)
Annual average evapotranspiration (mm
800
Brow n Vertosol Red Vertosol
500
Black Dermosol Brow n Dermosol
400
Red Dermosol Red Kandasol
300
Tenosol Yellow Sodosol
200
Grey Sodosol Black Sodosol
100
Brow n Sodosol
(b) 0 0
500
1000
Annual average rainfall (mm)
1500
Red Sodosol Rudosol Red Chromosol Red Ferrosol
Figure 2. Predictions of average ET and water excess for winter cropping for 38 locations and 17 soils compared with the Zhang ET curve (herbaceous plants). This is an independent validation of the GRASP and PERFECT models against observed data summarised by the Zhang curves. For each soil, average ET and water excess are related to annual average rainfall, following a curve similar to those of Zhang. However, there is considerable variation in water excess between soils due to soil properties. An extreme case is the Rudosol (shallow/skeletal soil) (Figure 1) where ET is considerably less, and the water excess is considerably greater, than the generalised curve. Soil water holding capacity is so low that larger rainfall events cannot be stored (for later use by ET) and become runoff and/or drainage. Water balance modelling for such soils is based on 8 years of measured hydrologic data (Owens et al. 2003). Both average runoff and drainage increase as rainfall increases, with fairly consistent relationships for any particular soil (Figure 3). However, there are large differences between soils. The Tenosol (modelled here as a sandy soil) has the lowest runoff and highest drainage. The Kandosol and Ferrosol follow similar trends though with somewhat more runoff and less drainage. In contrast, Sodosols and Dermosols have the highest runoff and lower, but not the lowest, drainage, due to their low-moderate PAWC and lower subsoil permeability. Vertosols (cracking clays) have about average runoff but low drainage compared with the other soils, due to their high PAWC. The Rudosol has high drainage and about average runoff and thus has high total excess water, similar to the Tenosol.
Paper No. 742
page 3
ISCO 2004 - 13th International Soil Conservation Organisation Conference – Brisbane, July 2004 Conserving Soil and Water for Society: Sharing Solutions
400
300
Grey Vertosol
(b) Annual average drainage (mm)
Annual average runoff (mm)
(a) 250 200 150 100 50
Black Vertosol
350
Brow n Vertosol Red Vertosol
300
Black Dermosol Brow n Dermosol
250
Red Dermosol
200
Red Kandasol Tenosol
150
Yellow Sodosol Grey Sodosol
100
Black Sodosol
50
Brow n Sodosol Red Sodosol
0
0 0
200
400
600
800
Rudosol
0
1000
200
400
600
800
1000
Annual average rainfall (mm)
Annual average rainfall (mm)
Red Chromosol Red Ferrosol
Figure 3. Average annual runoff and drainage for winter cropping for 38 locations and 17 soils in QMDB. Thus there are quite large differences between some soils, in excess water in some cases, and in runoff and drainage partitioning, though on average they follow the Zhang curves. These differences occur because we have parametised the PAWC, runoff and drainage of these soils differently, based on what is known about them. Comparison against transient chloride mass balance method Tolmie et al. (2003) estimated drainage using soil chloride (Cl) for sites in the QMDB (Figure 4). To allow comparison and approach a long-term average, sites with 20-70 yrs cropping history that were dominantly under winter cropping-summer fallow and conventional tillage were selected. Long-term drainage modelling for these sites were selected from the generic matrix of model runs (without calibration) for a ‘most like’ soil. Modelled drainage compares favourably with estimates from the Cl method, in the same order of magnitude (Figure 4). Modelled drainage is higher than the Cl drainage at higher rainfall sites. One of these ‘outlier’ sites was modelled in detail (next section). When actual soil properties were used, modelled drainage was similar to drainage from Cl (‘♦ Greenmount (site modelling)’ in Figure 4). The soil chosen from the matrix in this case was simply not ‘alike’ enough. 25
Annual drainage (mm/y
20 All soils (Cl method) Native vegetation (Cl method)
15
All sites (modelling) Greenmount (generic modelling)
10 Greenmount (site modelling) Linear (All soils (Cl method))
5
0 400
500
600
700
800
Annual rainfall (mm/yr)
Figure 4. Drainage (at 1.5 m) related to average annual rainfall for long-term winter crop sites using the soil chloride method (Tolmie et al. 2003) and modelling.
Paper No. 742
page 4
ISCO 2004 - 13th International Soil Conservation Organisation Conference – Brisbane, July 2004 Conserving Soil and Water for Society: Sharing Solutions
Under native vegetation, Tolmie et al. (2003) found drainage rates were typically low (e.g.