Table 21: The radial, local and total PPFs for the HEU core . ..... reactors, and their power mostly ranges from nearly zero for critical assemblies ...... Length - 600 m .... an overall length of 55.50 cm and inner and outer diameters of 3.63 and 3.73 ... out of the 11 SFE fuel rods of the C-ring with 5 fresh LEU fuel rods [16][34].
VALIDATION AND BENCHMARKING OF THE DETERMINISTIC DIFFUSION METHOD FOR THE NEUTRONIC CALCULATIONS OF THERMAL RESEARCH REACTORS By Ahmed Salah El-Din Ahmed Shama B.Sc., Metallurgy and Materials Science and Engineering, Faculty of Petroleum and Mining Engineering, Suez Canal University, Suez, Egypt A Thesis Submitted to the Department of Engineering Mathematics and Physics, Faculty of Engineering, Cairo University, Giza, Egypt in Partial Fulfillment of the Requirements for the Degree of MASTER OF SCIENCE in ENGINEERING PHYSICS
FACULTY OF ENGINEERING, CAIRO UNIVERSITY GIZA, EGYPT 2011
VALIDATION AND BENCHMARKING OF THE DETERMINISTIC DIFFUSION METHOD FOR THE NEUTRONIC CALCULATIONS OF THERMAL RESEARCH REACTORS By Ahmed Salah El-Din Ahmed Shama B.Sc., Metallurgy and Materials Science and Engineering, Faculty of Petroleum and Mining Engineering, Suez Canal University, Suez, Egypt A Thesis Submitted to the Department of Engineering Mathematics and Physics, Faculty of Engineering, Cairo University, Giza, Egypt in Partial Fulfillment of the Requirements for the Degree of MASTER OF SCIENCE in ENGINEERING PHYSICS Under the Supervision of;
Prof. Dr. Hamdy Mahmoud Hussein
Prof. Dr. Esmat Hanim Ali Amin
Professor of Engineering Physics, Engineering Mathematics and Physics Department, Faculty of Engineering, Cairo University, Giza, Egypt
Professor of Reactor Safety Analysis, National Center of Nuclear Safety and Radiation Control, Atomic Energy Authority, Cairo, Egypt
FACULTY OF ENGINEERING, CAIRO UNIVERSITY GIZA, EGYPT 2011 II
اﻟﺘﺤﻘﻖ واﻟﻤﻘﺎرﻧﺔ اﻟﻤﻌﯿﺎرﯾﺔ ﻟﻄﺮﯾﻘﺔ اﻹﻧﺘﺸﺎر اﻟﺘﺤﺪﯾﺪﯾﺔ ﻟﻠﺤﺴﺎﺑﺎت اﻟﻨﯿﻮﺗﺮوﻧﯿﺔ ﻟﻤﻔﺎﻋﻼت اﻷﺑﺤﺎث اﻟﺤﺮارﯾﺔ إﻋﺪاد أﺣﻤﺪ ﺻﻼح اﻟﺪﯾﻦ أﺣﻤﺪ ﺷﻤﺎ )ﺑﻜﺎﻟﻮرﯾﻮس ھﻨﺪﺳﺔ وﻋﻠﻮم اﻟﻔﻠﺰات واﻟﻤﻮاد – ﺟﺎﻣﻌﺔ ﻗﻨﺎة اﻟﺴﻮﯾﺲ( رﺳﺎﻟﺔ ﻣﻘﺪﻣﺔ إﻟﻰ ﻗﺴﻢ اﻟﺮﯾﺎﺿﯿﺎت و اﻟﻔﯿﺰﯾﻘﺎ اﻟﮭﻨﺪﺳﯿﺔ -ﻛﻠﯿﺔ اﻟﮭﻨﺪﺳﺔ ،ﺟﺎﻣﻌﺔ اﻟﻘﺎھﺮة ﻛﺠﺰء ﻣﻦ ﻣﺘﻄﻠﺒﺎت اﻟﺤﺼﻮل ﻋﻠﻰ درﺟﺔ اﻟﻤﺎﺟﺴﺘﯿﺮ ﻓﻲ اﻟﻔﯿﺰﯾﻘﺎ اﻟﮭﻨﺪﺳﯿﺔ ﺗﺤﺖ إﺷﺮاف
اﻷﺳﺘﺎذ اﻟﺪﻛﺘﻮر /ﺣﻤﺪي ﻣﺤﻤﻮد ﺣﺴﯿﻦ
اﻷﺳﺘﺎذة اﻟﺪﻛﺘﻮرة /ﻋﺼﻤﺖ ھﺎﻧﻢ ﻋﻠﻲ أﻣﯿﻦ
أﺳﺘﺎذ ﺑﻘﺴﻢ اﻟﺮﯾﺎﺿﯿﺎت و اﻟﻔﯿﺰﯾﻘﺎ اﻟﮭﻨﺪﺳﯿﺔ - -ﺟﺎﻣﻌﺔ اﻟﻘﺎھﺮة ﻛﻠﯿﺔ اﻟﮭﻨﺪﺳﺔ
أﺳﺘﺎذ أﻣﺎن اﻟﻤﻔﺎﻋﻼت -اﻟﻤﺮﻛﺰ اﻟﻘﻮﻣﻲ ﻟﻸﻣﺎن اﻟﻨﻮوي و اﻟﺮﻗﺎﺑﺔ اﻹﺷﻌﺎﻋﯿﺔ- ھﯿﺌﺔ اﻟﻄﺎﻗﺔ اﻟﺬرﯾﺔ
ﻛﻠﯿﺔ اﻟﮭﻨﺪﺳﺔ ،ﺟﺎﻣﻌﺔ اﻟﻘﺎھﺮة اﻟﺠﯿﺰة ،ﺟﻤﮭﻮرﯾﺔ ﻣﺼﺮ اﻟﻌﺮﺑﯿﺔ ٢٠١١
CONTENTS LIST OF FIGURES ....................................................................................... VIII LIST OF ABBREVIATIONS ............................................................................ X LIST OF SYMBOLS ..................................................................................... XIII ACKNOWLEDGEMENTS ........................................................................... XIV SUMMERY .................................................................................................... XV CHAPTER 1: INTRODUCTION .................................................................... 1 1.1 Introduction to Research Reactors ................................................................ 1 1.2 Introduction to Neutronic Calculations......................................................... 3 1.3 Summery of Previous Work.......................................................................... 4 1.4 Objective of the Current Study ..................................................................... 7 1.5 Current Study Layout .................................................................................... 7 1.6 Thesis Organization ...................................................................................... 9 CHAPTER 2: NEUTRONIC CALCULATIONS ........................................ 10 2.1 Approaches to the Neutronic Calculations ................................................. 10 2.2 The Deterministic vs. the Probabilistic Approaches ................................... 11 2.3 The Computational Analysis Tools ............................................................ 16 2.3.1 The Lattice and Cell Analysis Code WIMS ....................................... 16 2.3.1.1 The WIMSD Version .................................................................. 18 2.3.2 The WIMSD Libraries ........................................................................ 19 2.3.2.1 The WIMSD-IAEA-69 Library .................................................. 20 2.3.3 Core Analysis Code CITVAP v3.1 (CITATION–II).......................... 23 2.3.4 The Monte Carlo Codes ...................................................................... 24 CHAPTER 3: BENCHMARK CASE STUDIES ......................................... 25 3.1 Introduction ................................................................................................. 25 3.2 The IAEA 10 MW Benchmark Reactor - Neutronics Bench-mark Calculations - .................................................................................................... 25 3.3 The MTR IAEA 10 MW Benchmark Reactor - Safety-Related Benchmark Calculations - .................................................................................................... 30 III
3.4 The TRX and BAPL Standard Benchmark Lattices ................................... 32 3.5 The TRR-1/M1 Reactor Description .......................................................... 33 CHAPTER 4: CALCULATIONAL METHODOLOGIES ........................ 37 4.1 Introduction ................................................................................................. 37 4.2 Calculational Route Selection ..................................................................... 37 4.3 Specification of the Calculational Route .................................................... 40 4.4 Steps of the Neutronics Calculations Route................................................ 40 4.5 Calculational Techniques ............................................................................ 44 4.5.1 The Neutronics and Safety-Related Benchmark Calculations............ 44 4.5.2 Benchmark Calculations – TRX and BAPL Benchmark Lattices – ... 48 4.5.3 The Neutronic Calculations of the TRR-1/M1 Research Reactor ..... 49 4.5.3.1 Application of the WIMSD-5B Cell Calculations Code ............ 49 4.5.3.2 Application of the CITVAP v3.1 Core Calculations Code......... 50 CHAPTER 5: RESULTS AND DISCUSSIONS .......................................... 55 5.1 Introduction ................................................................................................. 55 5.2 The Benchmark Calculations ...................................................................... 55 5.2.1 The Neutronics Benchmark Calculations ........................................... 56 5.2.1.1 Isotopic Densities Variations ...................................................... 56 5.2.1.2 The Cell Constants of the U-235, U-238, Water, and Graphite . 60 5.2.1.3 The Infinite Multiplication Factors ............................................. 62 5.2.1.4 The Reactivities and the Effective Multiplications Factors ........ 63 5.2.1.5 The Neutron Flux Distributions .................................................. 68 5.2.2 The Safety Related Benchmark Calculations ..................................... 80 5.2.2.1 Isothermal Reactivity Feedback Coefficients ............................. 80 5.2.2.2 The Power defect of Reactivity................................................... 87 5.2.2.3 The Radial and Local Power Peaking Factors ............................ 88 5.2.2.4 The Worth of the Control Rods .................................................. 90 5.2.2.4.1 The Fully-Inserted Control Rods ........................................ 90 5.2.2.4.2 The Partially-Inserted Control Rods ................................... 93 5.2.3 The Integral Parameters of TRX and BAPL Benchmark Lattices........... 94
IV
5.3 The In-core Nuclear Characteristics of the TRIGA Mark-III TRR-1/M1 Research Reactor............................................................................................... 97 5.3.1 The Reactivities Calculations of the TRR-1/M1 Research Reactor ........ 97 5.3.2 The Neutron Flux Distribution of the TRR-1/M1 Research Reactor .... 101 5.3.3 The Power Density Results
CHAPTER 6: CONCLUSIONS .................................................................. 103 REFERENCES .............................................................................................. 111
V
LIST OF TABLES Table 1: Major historical developments of the WIMS Libraries . ................... 21 Table 2: Energy group structure for the WIMS library.................................... 22 Table 3: Specifications of the neutronics benchmark Problem . ...................... 26 Table 4: Specifications of the safety-related benchmark problem . ................. 30 Table 5: Specifications of the TRX-1 and -2 benchmark lattices . .................. 32 Table 6: Specifications of the BAPL-1, -2 and -3 benchmark lattices ............ 32 Table 7: The upper and lower boundaries for the energy groups spectra. ....... 48 Table 8: Control rods working positions of the TRR-1/M1 3rd core ............... 52 Table 9: The microscopic absorption and fission cross sections of the U-235 and U-235 isotopes at the 93% enrichment (HEU) . ........................................ 60 Table 10: The microscopic absorption and fission cross sections of the U-235 and U-235 isotopes at the 20% enrichment (LEU) . ......................................... 60 Table 11: The cell constants of the water and graphite reflectors ................... 61 Table 12: The effective multiplication factors - the current WIMSD5B/CITVAP v3.1 and the reference INTERATOM MONSTRA/IAMADY and ANL EPRI-CELL/DIF2D results . ................................................................... 64 Table 13: The effective multiplication factors - the current WIMSD5B/CITVAP v3.1 and the ANL 2D diffusion and 3D Monte Carlo results . ... 65 Table 14: The fresh cores excess reactivities for the three enrichments as as compared to the INTERATON and ANL results . ........................................... 65 Table 15: The reactivities loss (Δk and Δρ) by a burnup step of 5% burnup as compared to the INTERATON and ANL results . ........................................... 65 Table 16: Comparison of reactivity differences (Δk) by enrichment reduction as compared to the INTERATON and ANL results . ....................................... 66 Table 17: The current CITVAP v3.1 results of the neutron flux problems and the deviations from the reference ANL DIF2D results .................................... 69 Table 18: The neutron flux differences in the flux trap and the core upon enrichments reduction and the deviations from the reference ANL DIF2D results ............................................................................................................... 69
VI
Table 19: Isothermal reactivity coefficients . ................................................... 82 Table 20: The power defect of reactivity for the HEU and LEU cores . ......... 88 Table 21: The radial, local and total PPFs for the HEU core . ......................... 89 Table 22: The worths of the control rods for the fresh cores at the HEU and LEU enrichments. ............................................................................................. 92 Table 23: The worths of the control rods for the BOC equilibrium cores at the HEU and LEU enrichments. ............................................................................. 92 Table 24: The Integral Parameters of the TRX and BAPL benchmark lattices. ........................................................................................................................... 96 Table 25: The 1st core reactivity results. .......................................................... 99 Table 26: The 2nd core reactivity results. ......................................................... 99 Table 27: The 3rd core reactivity results. ........................................................ 100 Table 28: The maximum and average thermal and epithermal neutron fluxes for the five and seven energy groups calculations. ......................................... 102 Table 29: The Power Density Results of the 3rd core of the TRR-1/M1........ 102
VII
LIST OF FIGURES Figure 1: The BOC burnup distribution in (%) burnup . ................................. 28 Figure 2: The BOC and EOC burnup distributions in (%) burnup . ................ 29 Figure 3: The general geometry of the TRX and BAPL benchmark lattices. . 33 Figure 4: Midplane cross sectional cut through the 1st core of the TRR-1/M1 research reactor . ............................................................................................... 36 Figure 5: The fuel rods and the control rods different positions: fully inserted and fully withdrawn. ......................................................................................... 35 Figure 6: Calculational scheme for the neutronic and safety-related calculations........................................................................................................ 43 Figure 7: The half cell slab geometry used for generation of the SFE cell constants. ........................................................................................................... 46 Figure 8: The SFE geometry and dimensions, and the three zones used to represent each SFE element in the core calculation code. ................................ 47 Figure 9: The CFE Models used in the core calculation step; follower model and absorber blades model. ............................................................................... 47 Figure 10: The hexagonal model used for the SFE and LEU cell. .................. 52 Figure 11: The slab model used for; Aluminum, Graphite, and the water reflector. ............................................................................................................ 52 Figure 12: The CITVAP TRR-1/M1 reactor model for core #2. ..................... 53 Figure 13: The CITVAP TRR-1/M1 reactor model for core #3. ..................... 53 Figure 14: Isotopic densities of the Pu-239 isotope vs. percent burnup for the current WIMSD-5B and the ref. ANL EPRI-CEL results . .............................. 58 Figure 15: Isotopic densities of the Pu-241 isotope vs. percent burnup for the current WIMSD-5B and the ref. ANL EPRI-CEL results . .............................. 58 Figure 16: Isotopic densities of the Xe-135 isotope vs. percent burnup for the current WIMSD-5B and the ref. ANL EPRI-CEL results . .............................. 59 Figure 17: Isotopic densities of the Sm-149 isotope vs. percent burnup for the current WIMSD-5B and the ref. ANL EPRI-CEL results . .............................. 59 Figure 18: The infinite multiplication factors (k∞) vs. percent burnup. ........... 62 Figure 19: The BOC midplane flux ratios ϕf20/ ϕf93 along the X-Axis. ........... 70 Figure 20: The BOC midplane flux ratios ϕth20/ ϕth93 along the X-Axis. ......... 71
VIII
Figure 21: The BOC midplane flux ratios ϕth45/ ϕth93 along the X-Axis. ......... 71 Figure 22: The 93% enrichment midplane flux at BOC along the X-Axis. .... 73 Figure 23: The 93% enrichment midplane flux at EOL along the X-Axis. ..... 73 Figure 24: The 93% enrichment midplane flux at BOC along the Y-Axis. .... 74 Figure 25: The 93% enrichment midplane flux at EOL along the Y-Axis. ..... 74 Figure 26: The midplane flux ratios ϕ45%/ ϕ93% at BOC along the X-Axis. ..... 75 Figure 27: The midplane flux ratios ϕ45%/ ϕ93% at EOL along the X-Axis. ..... 75 Figure 28: The midplane flux ratios ϕ45%/ ϕ93% at BOC along the Y-Axis. ..... 76 Figure 29: The midplane flux ratios ϕ45%/ ϕ93% at EOL along the Y-Axis. ..... 76 Figure 30: The midplane flux ratios ϕ20%/ ϕ93% at BOC along the X-Axis. ..... 77 Figure 31: The midplane flux ratios ϕ20%/ ϕ93% at EOL along the X-Axis. ..... 77 Figure 32: The midplane flux ratios ϕ20%/ ϕ93% at BOC along the Y-Axis. ..... 78 Figure 33: The midplane flux ratios ϕ20%/ ϕ93% at EOL along the Y-Axis. ..... 78 Figure 34: Isothermal reactivity feedback for changes in water temp. only.... 83 Figure 35: Isothermal reactivity feedback for changes in water density only. 83 Figure 36: Isothermal reactivity feedback for changes in the whole core void fraction only. ..................................................................................................... 84 Figure 37: Isothermal reactivity feedback for changes in water temp. and density. .............................................................................................................. 84 Figure 38: Isothermal reactivity feedback for changes in fuel temp. only. ..... 85 Figure 39: The differential control rods worth for the BOC equilibrium core as compared to the ANL results . .......................................................................... 93 Figure 40: The integral control rods worth for the BOC equilibrium core as compared to the ANL results . .......................................................................... 94 Figure 41: The axial distribution of the thermal and epithermal flux in the central thimble for the five and seven energy groups calculations. ................ 101 Figure 42: The midplane flux ratios ϕf20/ ϕf93, ϕth45/ ϕth93, and ϕth20/ ϕth93 for the BOC along the X-axis. .................................................................................... 106 Figure 43: The Integral Parameters of the TRX and BAPL benchmark lattices. ......................................................................................................................... 109
IX
LIST OF ABBREVIATIONS AEEW: The Atomic Energy Establishment of Winfrith AERE: The Atomic Energy Research Establishment of Bangladesh ANL: The US Argonne National Laboratory ATR: Advanced Test Reactor BAPL: The US Bettis Atomic Power Laboratory BOC: Begin Of Cycle CELL: Cell Transport Code CENDL: The Chinese Evaluated Nuclear Data library CFE: Control Fuel Element CITATION: Nuclear Reactor Core Analysis Code CITVAP: Updated Version of the CITATION-II Code CR: Control Rod CT: Central Thimble DIF2D : The Diffusion Code Utilized by the ANL DSN : The Discrete Ordinate Method of the WIMSD Code EOC: End Of Cycle ENDF/B: The US Evaluated Nuclear Data Files Version B ENDL: Evaluated Nuclear Data Library EPRI-CELL : The Cell Code Utilized by the ANL ETRR-2: The Egypt Second Research Reactor FPDs: Full Power Days FE: Fuel Element FRG : The Federal Republic of Germany GA: The General Atomics Co. HEU: High Enrichment Uranium HXS: Cross-Sections Handler IAEA: The International Atomic Energy Agency IAMADY : The Diffusion Code Utilized by the ITERATOM INVAP: Argentian Technology Base Company IP: Irradiation Position ITERATOM: The FRG Internationale Atomreaktorbau GmbH
X
JEF: The Joint Evaluated File of the NEA Data Bank JEFF: The Joint Evaluated Fission and Fusion File of the NEA Data Bank JENDL: The Japanese Evaluated Nuclear Data Library LANL: The US Los Alamos National Laboratory LEU: Low Enrichment Uranium LFP: Lumped Fission Product - Stated with or without Xe-135 and Sm-149 isotopes MCBEND: A General Radiation Transport Monte Carlo Code MCNP: A General Monte Carlo N-Particle Transport Code MEU: Medium Enrichment Uranium MONK: A Monte Carlo Nuclear Criticality and Reactor Physics Code MONSTRA : The Diffusion Code Utilized by INTERATOM MTR: Materials Testing Reactor MTR_PC: INVAP’s Package for the Neutronic Calculations of the MTR Reactors MWD : Mega-Watt Day - Burnup Unit MXS / XS: Neutron Macroscopic / Microscopic Cross-Sections ND: Neutron Detector NDT: Non-Destructive Testing NJOY: Evaluated Nuclear Data Processing System PARR-1: The Pakistan Research Reactor-1 pcm: Percent Milli-Rho - Reactivity unit POS_WIMS: WIMS Post-Processor PPF: Power Peaking Factor REU: Reduced Enrichment Uranium RERTR: The US Reduced Enrichment for Research and Test Reactors SAR: Safety Analysis Report SFE: Standard Fuel Element SM: The Shut-Down Margin SRAC: The Standard Reactor Analysis System TECDOC: Technical Document of the IAEA TRIGA: Popular research reactors; Training, Research, Isotopes, General Atomics
XI
TRIGAP: TRIGA Reactor Deterministic Modeling Package TRR-1/M1: The Thai Research Reactor-1/Modification-1 TINT: The Thai Institute of Nuclear Technology UKAEA : The United Kingdom Atomic Energy Agency WIMS81 / WIMS86: The 1981 / 1986 versions of the WIMS Nuclear Data Libraries. WIMSD: The Winfrith Improved Multi-group Scheme Code Version D WIMSD-5B: Version 5B of the WIMSD code of the NEA Data Bank WLUP-69 or WIMSD-IAEA-69: The 69-Group WIMS Library of the WIMS Library Update Project
XII
LIST OF SYMBOLS keff: The Effective Multiplication Factor k∞: The Infinite Multiplication Factor ρ238: The Ratio of Epithermal to Thermal U-238 Capture Reaction Rate δ235: The Ratio of Epithermal to Thermal U-235 Fission Reaction Rate δ238: The Ratio of U-238 Fission to U-235 Fission Reaction Rate C*: The Ratio of U-238 Capture to U-235 Fission Reaction Rate ρ : The Reactor Reactivity Δρ : The Reactivity Difference ¢ : Cent; Reactivity Unit $ : Dollar; Reactivity Unit αx : The Reactivity Feedback Coefficient σx : The Microscopic Cross-Section βeff : The Effective Delayed Neutron fraction Σx : The Macroscopic Cross-Section D : The Diffusion Coefficient ν : The Reproduction Factor ±σ : The Standard Deviation Φ : The Neutron Flux T : Temperature
XIII
Summery
SUMMERY The goal of this study is to assess the suitability and the accuracy validation and benchmarking - of the deterministic diffusion method for the computational analysis of the neutronic and safety-related parameters of a typical Material Test Reactors (MTR) using the calculational route WIMSD5B/CITVAP v3.1, along with the WIMS library update project nuclear data library WIMSD-IAEA-69. The approach to this goal has been achieved in two steps: neutronics and safety-related benchmark studies and neutronics study and safety analysis of the TRR-1/M1 TRIGA Mark-III research reactor. The INVAP MTR_PC v3.0 computer package was used in the current study for evaluating the required lattice, cell, or core parameters. First, the WIMS working nuclear data library WIMSD-IAEA-69 along with the lattice transport calculations code WIMSD-5B are used to generate the cell constants for each material in the reactor in condensed energy spectra, mainly of five neutron energy groups: two fast, two epi-thermal, and one thermal group. Second, the cell constants were homogenized and prepared in MXS libraries in the CITATION format using intermediate codes: POS_WIMS and HXS. Third, the diffusion-depletion core calculations code CITVAP v3.1 was used in 3D geometry for evaluation of the reactivities and solving for the neutron flux eigen-value problems. The results of the neutronics benchmark studies are mainly core reactivities and neutron flux distributions. The results of the safety-related benchmark studies are the isothermal reactivity feedback coefficients, PPFs, and the worth of the CRs. The results of the TRX and BAPL benchmarks are the integral parameters: keff, ρ238, δ235, δ238, and C*. The results of the TRR-1/M1 neutronic study are mainly reactivities, neutron flux distributions, PPFs, and the worth of the CRs. XV
Summery
With few exceptions, the neutronics and safety-related benchmark results are in-line and in very good agreement with the reference ANL and INTERATOM results. Few deviations from the reference results were encountered - like the water density reactivity coefficient and the worth of the control rods - which were attributed to: the differences in the nuclear data libraries, the calculational models, specially, the use of 3D geometries, and also the solution tactics of the utilized numerical codes. For the TRX and BAPL systems, the results show a satisfactory matching with the references and the experimental values. The primary scope of studying the TRR-1/M1 reactor is to benchmark the pre-scribed calculational route using five energy groups spectrum for the neutronic calculations of such reactors. Currently, the selected route is benchmarked for MTR reactors utilizing standard MTR fuel, but the neutronic calculations of the reactors utilizing TRIGA-type fuels are traditionally performed using the diffusion method with seven or more energy groups or using the continuous energy Monte Carlo method, for accurate evaluation of the reactor neutronic parameters. Upon comparison of the results with previous calculations and experimental results, general good agreement with acceptable deviations from the references was en-countered; moreover, the five energy groups results showed more conformity with the references than the seven energy groups results in terms of reactivities and the worth of the CRs. The neutron fluxes and the PPFs results are not benchmarked, even they correspond to results of other reactors of the same type. Generally, the currently utilized deterministic diffusion calculational route; WIMSD-IAEA-69/WIMSD-5B/CITVAP v3.1, is well tested and assessed as a suitable, reliable, and accurate tool for the neutronic calculations and safety analysis of the MTR-type thermal research reactors utilizing standard MTR fuel or the TRIGA type fuel using the prescribed modeling techniques, and a neutron energy spectrum of five energy groups with one thermal group.
XVI
Chapter 1: Introduction
CHAPTER 1: INTRODUCTION
1.1 Introduction to Research Reactors Nuclear research reactors are mainly neutrons factories, in which the sole purposes are to generate and utilize neutron flux and ionizing radiation of sufficient intensity for research, testing and other different applications, and in contrast to the nuclear power reactor that are mainly used for generation of electrical power [46]. The research reactors are small as compared to the power reactors, and their power mostly ranges from nearly zero for critical assemblies up to 100 MWth. When compared with a typical power reactor of 3000 MWth (i.e. 1000 MWe), the total power of all research reactors in the world is a little over 3000 MWth [9] [46] [47]. Research reactors are simple and operates far beyond the physical constraints usually found in power reactor - operating temp., coolant flow rates, … etc -, even they have very high power density. Like power reactors, research reactors require sufficient amount of fissile materials - typically U-235 isotope - to achieve considerable excess reactivity, even the required fuel is far less than that of power reactors, and consequently yields less fission products, but the required fuel is usually of higher enrichments up to 20% and even 93% for unconverted research reactors, as compared to 3-5% enrichment for most power reactors [46]. Also, research reactors require coolant, moderator for neutrons moderation - except for the very few fast research reactor -, and reflectors for neutron economy. The research reactors possess many interesting and increasingly applications like: nuclear power related research, physics and material science research, radio-isotopes production, material and fuel testing, neutron beam research, neutron activation analysis, neutron radiography and NDT, neutron capture therapy, training and education ... etc [60] [46]. The power level of the
1
Chapter 1: Introduction
research reactor and the maximum available neutron flux will deter-mine the applications of the reactor. By December 2010, there were 259 active research reactors in the world [47], of which: 241 reactor are in operation, 14 reactor are in temporary shutdown, and 4 reactors are planned or under construction, distributed all over 60 state of the IAEA member states. There are many kinds of research reactors, and the more common: the pool or the tank type and the TRIGA-type reactors. The formers comprise over 100 research reactor, and their cores are cluster of fuel elements sitting in a large pool of water, and the fuel elements are often of the MTR-type that are encased plate-shaped fuel meats. Among the fuel elements are control rods and empty channels for experiments. Water serves as coolant, moderator and reflector, usually besides the graphite and beryllium reflectors [9] [46]. The later TRIGA reactor is the most widely used non-power nuclear reactor in the world, due to the inherited safety features, wide capabilities, economy of operation … etc., with 66 installed units allover the world [15]. The core consists of cylindrical fuel elements with stainless steel or aluminum clad enclosing low-enriched uranium-zirconium-hydride UZrH fuel-moderator rods. The core sits in a pool of water and is cooled, moderated, and reflected by water too, besides graphite or beryllium as reflectors. TRIGAs are routinely operated at steady state power levels from ~0.1 to 16 MWth or in pulsed modes with peak powers - during a few millisecond pulse - of up to 25,000 MWth, and a peak thermal neutron flux ~1017 neutron.cm-2.sec-1. The unique properties of the UZrH fuel-moderator such as the very large (~10-4 Δk/k per °C) and very prompt negative temp. coefficient, the usual prompt Doppler effect of U-238 in the LEU fuel, and the metallurgical stability of the fuel - design operating temperature of up to 750 °C - have enabled such diverse capabilities of the TRIGA reactors [9] [15].
2
Chapter 1: Introduction
1.2 Introduction to Neutronic Calculations The neutronic calculations are necessary to evaluate the neutronics, safetyrelated and design parameters of research reactors, and hence, ensuring the safe operation and the proper utilization of research reactors [57] [58]. The neutronic calculations are performed in the design, licensing, commissioning or the operational phases with major applications in: reactor physics calculations, criticality problems, safety analysis, core conversion feasibility studies, fuel management and burnup studies. In general, the approach to the solution of the problem is achieved numerically using computer codes designed explicitly for such purposes as the analytical solutions for such comp-licated systems is not feasible [12]. The neutronic calculations rely on modeling the physical system here, the research reactor - with a computer program that is encoded with the solution tactics of the math-ematical models that represent the physical system. Different possible choices are available on performing the neutronic calculations: the choice of the basic nuclear data sets - ENDF, JEF, JEFF, CENDL… etc; the selection of the calculational methods - the probabilistic Monte Carlo, the deterministic transport, and the analytical methods; and the computer modeling codes - MCNP, MONK, WIMS, SRAC, TRIGAP… etc. The selection of the calculational route is usually based on the availability of the nuclear data sets and codes, the resultant and the required accuracies of the results, the applications, computer storage and processing … etc. Typically, as a first step in the neutronic calculations, standardized benchmark problems for well defined reactor conditions are chosen and studied [61], with the purpose of obtaining a qualitative and quantitative indications of the reliability and accuracy of the calculational and modeling methods, numerical codes, and cross-section data sets, respectively. Once the benchmarked calculational route is established, the neutronic calculations are performed with more assurance and reliability on the results - as stated, mostly in safety analysis, fuel management, and core conversion studies. Safety 3
Chapter 1: Introduction
analysis is a field in which the main purposes are to evaluate certain safetyrelated reactor parameters such as: the worth of the control rods, SMs, reactivity feed back coefficient, PPFs, … etc, during a broad range of operating conditions and postulated initiating events, and assuring that these parameters shall meet certain jurisdictional, design, or licensing requirements [49]. Fuel management is a field in which the in-core fuel elements arrangement, fuel shuffling patterns, and cycle lengths are evaluated to meet with the highest utilization of the research reactor in terms of the neutron flux in the irradiation facilities and the discharge burnup without violating safety-related parameters. Core conversion is a field in which research reactors utilizing HEU fuels are assessed for conversion into using LEU fuels - to answer: 1) Is the conversion possible using currently qualified fuels?; 2) What is the minimum uranium density required to meet certain constraints?; 3) what are the resultant penalties in reactor parameters, if exist?, This field has emerged from the increasingly proliferation potentials of HEU fuel cycles, and research reactors around the world are being converted increasingly [61] [44]. The resultant core properties are usually degraded in terms of flux-per-unit-power, neutron economy, discharge burnup, without increasing the reactor power, core redesign, or using higher density uranium fuel [2].
1.3 Summery of Previous Work Previous neutronics and safety-related studies on MTR research reactors utilizing standard MTR plate-type fuel and TRIGA-type fuels were performed by different authors using the currently utilized calculational route, essentially using the same CITATION code for core calculations, but using different: cell codes, cell constants, cross-sections data sets, or number of energy groups. The neutronic calculations of the MTR research reactors utilizing standard platetype fuels are accurately being performed using the diffusion method with five or more energy groups [13] [6] [1] [2], while for reactors utilizing TRIGA-type
4
Chapter 1: Introduction
fuels, they are performed using the continuous energy Monte Carlo method or the diffusion method using seven or more energy groups with three or more thermal groups for accurate prediction of the neutronic parameters [32] [52] [37] [16] [28] [48] [65]. Lee et al. [37], Lee et al. [38], and Yook et al. [69] have studied the neutronic and safety parameters of the shut-down Korean TRIGA Mark-III reactor using 2D models of the CITATION code and seven energy groups cell constants of the GA Co., and showed the adequacy and accurateness of the utilized methodology - specially the selection of seven energy groups with four thermal groups, En < 1.125 eV - for modeling and representation of the TRIGA MARK-III reactor through comparison of the results with experimental and design values - initial criticality, temp. coefficients, flux and power distributions. Moreover, the later have examined the burnup-dependant variation of reactivity, time-dependant change of Xe-135, and the worth of the rotary specimen rack. Sarker et al. [48] have performed a neutronic analysis on the 3 MW TRIGA Mark-II research reactor at the AERE using the JENDL-3.2 ENDL, and calculational route CELL-CITATION of the SRAC code, at seven energy groups and compared: the excess reactivity, flux distributions, and PPFs with previous: WIMS-CITATION, MCNP, and SAR values, which showed reasonable agreements. Also, Uddin et al. [65] have performed a neutronic analysis on the same reactor using the route NJOY-WIMS-CITATION, based on the CENDL-2.2 and JEFF-3.1.1 ENDLs, and the same modeling methodology, and calculated: the Keff, flux distributions, and the PPFs, which showed good agreements with each other, experimental and SAR values, and MCNP results. That indicated that the two calculational routes, tools, modeling methods, cross-section libraries are validated and powerful for the analysis of the TRIGA reactors.
5
Chapter 1: Introduction
Enany et al. [13] have studied the neutronic and safety parameters of the ETRR-2 research reactor for the first core up to the third core using the route WIMS-CITATION and the ENDF/B ENDL in twelve energy group, and evaluated: the worth of the control plates, excess reactivities, and SMs. Validation of the calculational models and the associated libraries for representing the MTR plate-type reactor has been achieved through comparison of the results with the experimental values. Also, Barsowm et al. [6] have performed fuel management study through following-up the fuel loading of the same reactor starting from the first core up to the fourth core, and verified the neutronic safety criteria for all reactor cycles by evaluating: SMs, excess reactivities, control rod worth, and power distribution. The later have used the same calculational route in five energy groups and found good agreements with the experimental values, too. Ahmed [1] has studied the effect of utilizing different ENDLs - ENDF/BVI.8, JENDL-3.2, … and the WIMS81 library - on the reactor physics parameters of the PARR-1 MTR-type research reactor. Studies of the reactivities, the neutron energy spectrums and fuel cycle analysis were carried out using the route WIMS-CITATION at five energy groups. The results showed good agreements with the experimental values, and that the new ENDLs based libraries would yield more accurate results than the older WIMS libraries. Also, Ahmed [2] has performed a simulation study to assess the feasibility of utilizing higher density fuels in the same reactor for enhancing its performance using also the same route. The results showed that higher performance in terms of fuel cycle length, fuel burnup, neutron fluxes at the Irrad. sites could be attained by utilizing the new higher density fuels.
6
Chapter 1: Introduction
1.4 Objective of the Current Study Currently, the widely-used deterministic diffusion calculational route:
WIMSD-IAEA-69 working nuclear data library [3]; WIMSD-5B lattice and cell transport calculations code [35] [20]; CITVAP v3.1 diffusion core calculations code [14] [66], is to be benchmarked for evaluating a qualitative and quantitative measures of its reliability and accuracy for calculating neutronics and safety related parameters of the MTR research reactors. Benchmarking will be achieved through: the widest available set of theoretical benchmark problems of the IAEA TECDOC for research reactors core conversion, experimental lattice benchmarks of the BAPL lab., and realistic core problem of a TRIGA reactor - the TRR-1/M1 reactor. The selected numerical codes are available, and the utilized methodology and models will be detailed enough to be reproducible, and so, once this objective is achieved; a reliable, validated, and benchmarked calculational route is in-hand for subsequent neutronic studies and safety analysis of the MTR-type research reactors utilizing standard MTR plate-type dispersion fuel - HEU or LEU - and the LEU TRIGA-type fuels.
1.5 Current Study Layout As stated in section 1.3, MTR reactors utilizing plate-type fuels are routinely modeled using the diffusion method with five energy groups, but application of the same method in reactors utilizing the TRIGA-type fuels requires seven or more energy groups, if the Monte Carlo method is not applicable. In the current study, the pre-stated diffusion calculational route is to be used for the neutronic calculations and safety analysis of both reactor types using mainly five energy groups, and as stated in section 1.4, the objective will be to assess this selection.
7
Chapter 1: Introduction
As stated, the current study is a validation study for the neutronic calculations route WLUP/WIMS/CITATION. Different benchmarks were selected for achieving the stated objective: lattice benchmarks, neutronic benchmark studies, safety-related benchmark studies, and in-core neutronic and safety-related study of a realistic core. The 1st benchmark problem is the TRX and BAPL benchmark lattices of the Bettis Atomic Power Laboratory (BAPL), Westinghouse, USA [25] [23]. The 2nd and 3rd benchmarks are the IAEA 10 MW benchmark reactor and the associated neutronics and safety-related benchmarks that were specified at the Consultants Meeting on "Preparation of a programme on Research Reactor Core Conversions to Use LEU instead of HEU", IAEA, June 19-22, 1979 in Vienna, Austria for an idealized 10 MW MTR, plate-type reactor of 93%, 45%, and 20% enrichments [61] [63]. The 3rd benchmark problem is the in-core neutronic and safety-related parameters of the 2 MW TRIGA Mark-III Thai Research Reactor TRR-1/M1 of the Thailand Institute of Nuclear Technology [47]. The selected deterministic diffusion approach for the specified benchmarks is widely used in the neutronic calculations of the MTR-type reactors, and serves as a rapid and accurate modeling tool for evaluating neutronic and safety related parameters, burnup calculations, fuel management, and core conversion studies. Through this approach, a working nuclear data library - namely, WIMSD-IAEA-69 [3] - is used along with a cell transport calculational code namely, WIMSD-5B [35] - to evaluate the lattice or cell constants for each material or region in the reactor in selected condensed energy spectrums macroscopic absorption cross sections Σag, production cross sections νΣfg, scattering matrix, and the diffusion coefficients -, then these cell constants are prepared in macroscopic cross-sections libraries (MXS), which are then used along with the reactor geometry description in a core diffusion calculational code - namely, CITVAP v3.1 [66] - to evaluate the neutronic or safety-related reactor parameters of interest. The utilized numerical codes are available with the MTR_PC v3.0 computer package of the INVAP [67].
8
Chapter 1: Introduction
The neutronics and safety-related benchmark results were compared basically with the corresponding results of the ANL and INTERATOM and those of the TRX and BAPL benchmarks were compared with experimental values and previous WIMS and Monte Carlo results using other ENDLs. The TRR-1/M1 realistic core results were compared against experimental values and reference results of the TINT and ANL using the TRIGAP and MCNP codes respectively.
1.6 Thesis Organization Chapter-2 presents a background of neutronic calculations and the broadly used deterministic and probabilistic approaches, also specification of the utilized numerical codes and the nuclear data library. Chapter-3 is a specification of the utilized lattices and reactors: TRX and BAPL benchmark lattices, the IAEA 10 MW benchmark reactor, and the TRR-1/M1 TRIGA Mark-III reactors. Also specifications of the calculated parameters and the conditions under which the calculations were performed. Chapter-4 presents how the lattice, cell, and core models of the different benchmarks were constructed, also presents a layout of the calculational scheme. Chapter-5 presents the results of the benchmark calculations - the cell and the 3D core neutronic and safety-related parameters of the IAEA 10 MW reactors, the lattice integral parameters of the TRX and BAPL benchmarks, and finally the in-core nuclear characteristic of the TRR-1/M1 research reactor as compared to previous evaluations or experimental values for the sole of benchmarking the proposed calculational route. Chapter-6 presents discussion and the main conclusions of the presented work in this thesis as originated from the stated objectives, also recommendations for future studies.
9
Chapter 2: Neutronic Calculations
CHAPTER 2: NEUTRONIC CALCULATIONS
2.1 Approaches to the Neutronic Calculations The neutronic calculations are necessary to evaluate the neutronics, safety and design parameters of research reactors, and hence, to assure the safe operation and the proper utilization of the research reactors. As stated in section 1.2, the neutronic calculations are performed in the design, licensing, commissioning or the operational phases within the major fields of: reactor physics calculations, criticality problems, safety analysis, core conversion studies, fuel management, shielding, dosimetry, and general radiation transport applications … etc [57] [58]. The solution of the problem can be theoretically attacked through different approaches, but in fact the analytical solution can not be obtained for such systems, even for particular simple and less complex systems [12]. In general, the approach to the solution is achieved numerically using computer programs designed explicitly for such purpose. The neutronic calculations rely on modeling the physical system - namely, the research reactor - using computer programs that are encoded with the solution tactics of the mathematical models that represent the physical system - the neutron transport problems. In principle, the inputs to such programs will be: the nuclear data evaluated through experimental, empirical or theoretical approaches - the ENDLs -; the specific case details including description of the geometry of the problem and the distribution of the properties of interest within these geometries, like the material type and the isotopic densities; the user pre-selected variables; the problem size; and the solution techniques … etc.
10
Chapter 2: Neutronic Calculations
Basically, the numerical solutions rely on discretization of the variables upon which the mathematical representation of the physical nature of the system are dependent, for example, the spatial and energy discretization of the neutron diffusion equation as in equation 2a [7] [26] [39]. Discretization of the variables is inherited in the nature of the numerical solutions, and is nothing but an approximation in the technique, and actually, there are other forms of approximations that may be required: homo-genization of materials, the use of broad energy groups cross-sections libraries and further condensation of energy groups, restriction to two or even one dimension, and approximation of geometries [19] [43]. Usually, the degree of approximations in energy spectra or space required will depend on the selected approach - probabilistic or deterministic -, and the utilized numerical codes; the availability of storage and processing facilities; and in some cases will depend on the core or fuel under study itself. The accuracy and the reliability of the results depend on: the selected approach, the approximations performed - the proper modeling and selection of the approximated parameters - and also on the reliability of the input nuclear data sets.
2.2 The Deterministic vs. the Probabilistic Approaches The problems of neutronics calculations and safety analysis of research reactors are performed using two different approaches: the probabilistic and the deterministic approaches, or more specifically: the Monte Carlo methods and the Deterministic Transport methods, which generally rely on encoded mathematical models that deal directly with the neutron transport, which is the governing the physical phenomenon on thermal research reactors under study [12]. Both of the approaches are very different in the way the problem is solved or presented and also in the solution itself.
11
Chapter 2: Neutronic Calculations
The Monte Carlo methods are high statistical treatments in which the problem of neutron transport is solved by simulating individually millions of neutron histories throughout their entire life from some source to their terminal category - absorption, escape, … etc., and recording some aspects of the neutrons average behavior. The average behavior of particles in the physical system is then inferred from the average behavior of the simulated particles, hence, these neutron histories leads to the final results of the problem, e.g. the neutron fluxes and reaction rates. The accuracy of this statistical method statistical uncertainties - is dependent on the number of neutron histories studied, [20] [36]. In the deterministic transport methods, with the most common of which is the discrete ordinates method, the transport equation is solved for the average particle behavior. In comparison with the Monte Carlo methods, which simulate the integral transport equation, the discrete ordinates method solve the integro-differential transport equation as stated in equations 2 and 1, respectively [7] [26] [12] [39] [50]. In fact, these equations are two different forms of the same equation, and if one is solved, the other is solved [36]. In addition, other deterministic codes that uses the diffusion theory approximation - CITATION code - solves the multi-group diffusion equations, as stated in equation 3 [14] [12] [42] [50]. Equation 1: The neutron transport equation, the “integro-differential” equation; n ˆ n n (r , E, ˆ ,t ) t t ˆ ' dE' ' E' E, ˆ ' ˆ ) n ( r , E', ˆ ',t ) s (r , E, ˆ ,t ). d s 4π
0
Where: υ is the neutron speed, E is the neutron energy, ˆ is the neutron direction, Σt is the total cross-section, Σs (E’→E, ˆ ’→ ˆ ) is the scattering cross-section from E’ and ˆ ’ into E and ˆ , n (r , E, ˆ ,t ) is the angular neutron density, s (r , E, ˆ ,t ) is the source term, and the independent variables: r = x,y,z; E; ˆ = θ,ϕ; t. The fission source term for prompt neutrons; s f (r , E, ˆ ,t ) is
12
Chapter 2: Neutronic Calculations
included in the source term s (r , E, ˆ ,t ) - where, and χ(E) is the fission spectrum, Σf is the fission cross-section and (r , E, ˆ ,t ) is the angular neutron flux -, and is defined as;
s f (r , E, ˆ ,t )
(E ) ˆ' d 4π 4
0
dE' ' )f ' ) (r , E, ˆ ,t ).
Equation 2: The neutron transport equation, “integral form”;
c
(r , E ) d 3 r' T (r , r ' , E ) dE' s r ', E' E ) (r ', E' ) S (r ', E )
T (r , r' , E )
0
exp
rr '
0
rr' , E ds s r s rr' 2 4 r r '
Where, T(r,r’,E) is the un-collided flux at r of energy E from a unit point source at r’ of the same energy E, which is known as the transport or firstflight kernel. Equation 3: The multigroup neutron diffusion equations; 1 g .D g tg g (r , t ) g t
G
sg'g g' g g' 1
G
g' 1
g'
fg' g' S g'
Where: Σsg’g is the group-transfer cross-section, Sg is the source term, that gives the rate at which source neutrons appear in group g, .Dg is the leakage from group g within the diffusion approximation, Dg is the diffusion coefficient, νg' is the average number of fission neutrons released in a fission Eg -1
reaction induced by a neutron in group g’, g r ,t Eg dE r , E,t is the group neutron fluxes, ϕ(r,E,t) is the energy and space-dependant neutron flux, G is the total number of groups or the number of coupled diffusion equations, Σfg’ is the fission cross-section characterizing a group g’, Σtg is the total crosssection for group g, χg is the probability that a fission neutron will be born with an energy in group g.
13
Chapter 2: Neutronic Calculations
The Deterministic methods are not subjected to the statistical uncertainties of the Monte Carlo methods, and through which the solutions are the unique eigen-values that results from the numerical solutions of the mathematical representations of the physical system, like the neutron transport equation and the neutron diffusion equation - the diffusion theory approximation of the neutron transport theory [19]. Although Monte Carlo methods - like criticality codes MCNP and MONK - are recognized for providing accurate presentation of the problem and accurate solutions, they are still computer intensive to provide a full range of solutions for reactor performance or transient analysis for burn up and fuel management routines where variations in many parameters such as temp. and densities must be considered, yet there is still a central role in these types of analysis for the deterministic methods such as those applied in the widely used WIMS cell calculations code - and latterly core analysis code [54] [29]. Latterly with the advent of high computing powers and cheaper computing facilities, the Monte Carlo techniques are taking an increasing share. Also, of the main differences between the probabilistic and the deterministic approaches, are the input nuclear data form, which is the point wise cross sections for the Monte Carlo technique - the fine group structure which is not a multigroup representation, rather, the cross sections are given as histograms rather than as continuous curves, which are named the Monte Carlo format libraries [29] [56]. The Monte Carlo codes do not access the evaluated data directly from the ENDF format, rather, these data must first be processed using a cross section processing code into the code format, like the ACE format for the MCNP code [36]. Contrary for the deter-ministic methods, the working libraries consist of the group average cross sections available from the cross sections processing codes [3] - like the widely used NJOY cross-section processing code - that generate group averages cross sections from the point wise evaluated nuclear data files - the point-wise energy dependant crosssection data in the ENDF-6 format, contained in the evaluated nuclear data files - ENDF, JEF, JENDL, … etc, or their equivalent functional form with
14
Chapter 2: Neutronic Calculations
appropriate parametric values [21] [40]. The broad group structures used for the deterministic codes like the WIMS86 and WLUP-69 working nuclear data libraries, and named the broad group library format [29] [56]. Also the deterministic treatment requires geometrical approximations or reduction of dimensions to 2D or even 1D, in contrast to the probabilistic treatment, in which the very accurate aspects of the physical data and the geometrical details can be used [20] [36], and so the Monte Carlo methods are well suited to solving complicated three-dimensional, time-dependent problems that can not be modeled by computer codes that use deterministic methods. Other forms of the approximations used in the deterministic methods is in the energy, through the use of energy groups and averaging of variable over the discrete energy ranges - broad group cross-sections libraries, which are necessary for the complicated dependence of neutron cross section on energy, and it is necessary to average them in some way over discrete energy ranges, and in the present case into WIMS nuclear data libraries. Typical example of approximations in the numerical solutions of the transport equation by the DSN method: discretization of the energy dependence (E) and (E’) of the fission spectrum, cross sections, fluxes, and source in the usual multigroup approximation; discretization of the angular variable Ω and the angular dependence (Ω) of the scattering cross section, fluxes, and source in the discrete ordinates approximation. Representation of the angular dependence (Ω→ Ω’) by the standard orthogonal Legendre polynomial expansion. The spatial operator and the spatial dependence (r) of the fluxes, cross sections, and source are discretized in the finite difference approximation.
15
Chapter 2: Neutronic Calculations
2.3 The Computational Analysis Tools For evaluation of the required neutronics and safety-related parameters in the current study, various numerical codes were employed: the transport lattice and cell calculations code, WIMSD-5B; and the CITATION multigroup diffusion core analysis code, CITVAP v3.1; also the WIMS nuclear data library, WIMSD-IAEA-69. The following parts contain descriptions of the numerical codes and the utilized library, also a brief description of other WIMS popular versions - mainly WIMSE versions - and the popular Monte Carlo codes MONK and MCNP.
2.3.1 The Lattice and Cell Analysis Code WIMS WIMS, the Winfrith Improved Multigroup Scheme, has been developed in the twenty century sixties for modeling of thermal reactor lattices - BWR, PWR, HTR, CANDU, RMBK, SGHWR, … etc. –, [5] [11], and by time improvements and sophistications of the code have been added. WIMS is developed by the Atomic Energy Establishment of Winfrith (AEE Winfrith), which is currently the AEA Technology [5]. The main versions of the WIMS code are the WIMSD, WIMSE, and LWRWIMS versions. All versions of WIMS use a WIMS library - a broad energy groups library, normally in 69 groups and containing equivalent data, and hence the main difference between versions is of the geometrical capabilities. The first WIMSD version dates back to 1964 [5], it is a very popular and accessible code with flexible capability for a wide variety of applications, and because of its sound theoretical basis and free availability, WIMSD is still prob-ably the most widely used cell and lattice physics code in the world [19] [29] [30]. WIMS is used for homogeneous, slab, cylindrical pincell, and cluster lattice cell calculations. The first WIMSE version dates back to 16
Chapter 2: Neutronic Calculations
1969 [4], which is developed for difficulties with the HTR fuels, and it is flexible, more sophisticated, and a modular program. WIMSE can handle 2D and 3D geometries - global reactor calculations - and the later WIMS7 incorporates the Monte Carlo module MONK5W with its general geometrical capabilities in the solution of the neutron flux problem, and hence it combined the both of the deterministic and Monte Carlo reactor physics methods [19]. Recent versions of WIMSE ends with WIMS9 as of 2002 and WIMS10 as of 2008 [29] [41]. LWRWIMS is a single program of bounded modules that is used for Light Water Reactors (PWR, BWR, and clusters of pins in x-y geometry) [20] [11]. WIMS can be used at the cell level as a lattice code to generate libraries of cell constants for the core codes, or to perform the complex core calculations entirely [20] [29]. The WIMS codes are used mainly for; bench-marking, experimental analysis, reactor fuel management, criticality work, and power reactor assessment. For experimental analysis, reaction rates in specific nuclides for critical lattices are evaluated, which represent an appropriate feedback in constructing the nuclear data libraries, which is used extensively in validation of data, codes, and methods. For criticality work, WIMS is usually used in association with Monte Carlo methods for rapid evaluation of temp. effects, m/f ratio, enrichments, … etc., which is not feasible with the Monte Carlo methods and the associated statistical uncertainties. Criticality calculations are frequently per-formed using multiple methods to reassure inputs and results, as criticality clearance is frequently based on multiple calculations. For power reactor assessment and whole core calculations, for which the deterministic methods are the most appropriate and used extensively in such applications, WIMS codes are used for calculation of the flux; power distribution, and hence fuel depletion; reactivities; reactivity coefficients; actinides and fission products inventory; poison burnout; xenon and other fission products transients, and as a lattice cell code in generation of the cross-
17
Chapter 2: Neutronic Calculations
section libraries used by subsequent whole core codes in fuel management and simulation studies [19] [20] [29] [41]. The options available in the latest WIMS versions are: 1. 1D or 2D or Spectrum Calculation Collision Probability method 2. 1D or 2D Sn Discrete Ordinate method 3. 1D or 2D Characteristics method 4. 3D Diffusion Theory method 5. 3D Monte Carlo method 6. 3D Hybrid Monte Carlo method
2.3.1.1 The WIMSD Version The Winfrith Improved Multigroup Scheme version-D WIMSD–5B, is a general lattice cell program; a deterministic computational code that perform reactor physics lattice and cell calculations [68], which uses the transport theory to calculate flux as a function of energy and space in the cell. The WIMS code solves the energy and space dependent Neutron BOCtzmann Trans-port equation numerically in 1D [29], with energy and spatial discretization - the broad energy groups and finite difference approximations respectively - for geometries; homogeneous, slab array, rod clusters and finite cylinders [5] [45]. The code incorporates a free format input and use its own working nuclear data library format, currently on the research the WIMSDIAEA-69 Library. The available WIMS-D5 version is used mainly for thermal reactor lattice and cell calculations [5]. WIMSD-5B version of the code was released from Winfrith in 1998 for distribution by the OECD/NEA Data Bank [68]. The code performs the transport calculations in two steps [45] [20]: first, the preliminary spectrum calculations, in which WIMS first calculates spectra -
18
Chapter 2: Neutronic Calculations
the energy groups dependant flux - for few spatial regions in the full number of energy groups of its library, then uses these spectra to condense the basic cross sections into few groups - condensation spectra or vectors for fuel, can, coolant, and moderator, and this step is carried out using the collision probability method. Second, main transport calculations, in which a few group calculation is carried out using a much more detailed spatial representation, and the resulting fluxes are then expanded using the spectra of the previous calculations, so that the reaction rates at each spatial point can be evaluated, in this step there is an option to use either the collision probability methods or the discrete ordinate method WDSN. The WIMSD-5B main inputs are: the cell description including the cell geometry, mesh size, bucklings, material composition, the main routine calculational method, number of groups and groups structure, the power rating, and the edit data specification [17]. The program burnup dependant outputs are: the infinite multiplication factor k∞, the effective multiplication factor keff for a given buckling, and a summery of events in each region of the cell; the reaction rates for specific nuclides, the neutron fluxes, and the few group cell constants - diffusion coefficients, macroscopic absorption and production cross sections, and the scattering matrix [20]. The macroscopic cross sections are tabulated vs. burn up to take into account the burnup dependence of the fissile and fission products concentration - Sm-149 and Xe-135. The resultant macroscopic crosssection libraries are usually been generated and tabulated vs. what are known as dependices; fuel temperature, moderator temperature and density, fuel burnup level, … etc, that correspond to various cross-sections affecting parameters.
2.3.2 The WIMSD Libraries The WIMS library associated with the WIMS/D-4 package is the 1981 library; WIMS81 library, generated in the UK using evaluated nuclear data
19
Chapter 2: Neutronic Calculations
from the early sixties. The later version, WIMS-D5 has important improvement with the inclusion of the 1986 WIMS library; WIMS86 library. Halsall has summarized several compelling justifications for the modifications to the 1986 library [18], but generally, all these libraries are based on very old nuclear data files as clear from table 1. The 1986 WIMS library is based on 1970’s differential data - the UKAEA ENDL, mainly from the 1981 library, JEF-1 ENDL, and a number of integral adjustments [21]. Major historical developments in the WIMS libraries are given in table 1 [11] [3]. The WIMS libraries are generated in the WIMS standard multi-group format -group average cross sections - using cross-section processing codes NJOY, GALAXY … etc., from the point-wise energy dependant cross-section data - in the ENDF-6 format, contained in the ENDLs - ENDF, JEF, JENDL … etc [21] [40]. The WIMS library mainly contains the energy group boundaries, list of nuclides, resonance tabulations, the 2200 m/s cross-sections, the resonance integrals, the fission spectrum, the P1 scattering matrices, burn-up library details, including fuel and fission product burn-up chains, fission product yields, and energy release data [59].
2.3.2.1 The WIMSD-IAEA-69 Library The main weakness of the WIMS-D package is the multi-group constants library, which is based on very old data that dates back to the sixties [11; 3]. The WIMS-D Library Update Project (WLUP) was initiated in the early 1990ies, supported by the International Atomic Energy Agency (IAEA) with a primary objective of producing an updated WIMS-D multigroup data library, i.e., to improve the performance of WIMS-D code and the reactor lattice calculations. The working libraries are generated through processing of the new and revised data available in the recent versions of the ENDLs: ENDF/B-VI.8, JENDL-3.2, JEF-2.2, CENDL-3, and FOND-2.2.
20
Chapter 2: Neutronic Calculations
Table 1: Major historical developments of the WIMS Libraries [11] [3]. Year
UK Evaluated Data
1964
UKNDL
1981
UKNDL
1986
JEF1
Oct. 1986
JEF1.1
1990
JEF2.1
1993
WLUP Dec. 2003
Other Format Major Data Choice
Processing
Remarks
The UKNDL probably GALAXY3 contained the best consistent UKNDL PIXIE nuclear data in the world at GENEX/SDR this time. Fewer new evaluations in the GALAXY UKNDL isotopes than UKNDL ENDF/B-IV MURAL ENDE/B-IV. ENDF/B-IV QA improved. Only secondary isotopes and standards available from ENDF/B-V. JEF1 contains selection of the Parts of NJOY 6/83 best data from ENDF/B-IV, ENDF-5 ENDF/B-V ENDF/B-V, JENDL-2, ENEA, KEDAK, etc. UKNDL for some parts of Hf evaluations. Improvements to JEF1 due to ENDF-5 NJOY87 experiences in processing. ENDF/B-VI New European evaluations ENDF-6 NJOY89 JENDL-3 UK evaluations U238.
JEF2.2 ENDF/B-VI Access to all 3 libraries + (Revision 2) ENDF-6 NJOY89.62W further coordinated JENDL3.1 evaluation. EFF ENDF/B-VI.8 NJOY97.0 ENDF/BAVRFBY/ Description of the WLUP JENDL-3.2 VI.7 WILLIE/NRSC/ libraries is given in section JEF-2.2/ ENDF-6 JENDL/D2.4.1. ENDF/WIMSIE/ CENDL-3 99 XnWlup FOND-2.2
The WIMSD-IAEA libraries has many advantages over the older libraries: updated through the use of the new and revised ENDLs; the old libraries contains artificial adjustments in contrast to the precise definitions in the WIMSD-IAEA libraries; well tested and benchmarked with more than 200 cases for different systems and combinations of fuels, moderators and geometries; also increase in the total number of materials, moderators, fission products, burnable absorbers, resonant materials … etc. The original WIMS-D structure is used, with 14 fast groups (9.118 keV < Ef < 10 MeV), 13 resonance groups (4 eV < ERes < 9.118 keV), and 42 thermal groups (0 eV < ETh < 4 eV). Table 2 lists the boundaries of energy groups (Emax), [21] [3].
21
Chapter 2: Neutronic Calculations
The main parameters of the library are: the transport cross section tr,g, the absorption cross section ’a,g, the resonance integrals, the potential cross section p, the slowing down power per unit lethargy (s/), fission neutron production cross section (f )g, fission cross section f,g, fission product yields, burnup and decay chain data, fission spectrum, and P1 scattering matrix ’s1,gh for the moderators: Hydrogen, Deuterium, Carbon … etc [3]. Table 2: Energy group structure for the WIMS library, [3]. Fast Groups
Resonance Groups
Group
Emax (MeV)
Group
Emax (eV)
1 2 3 4 5 6 7 8 9 10 11 12 13 14
10.00000 6.06550 3.67900 2.23100 1.35300 0.82100 0.50000 0.30250 0.18300 0.11100 0.06734 0.04085 0.02478 0.01503
15 16 17 18 19 20 21 22 23 24 25 26 27
9118.000 5530.000 3519.100 2239.450 1425.100 906.899 367.263 148.729 75.501 48.052 27.700 15.968 9.877
22
Thermal Groups Group Emax (eV) Group 28 29 30 31 32 33 34 35 36 37 38 39 40 41 42 43 44 45 46 47 48
4.000 3.300 2.600 2.100 1.500 1.300 1.150 1.123 1.097 1.071 1.045 1.020 0.996 0.972 0.950 0.910 0.850 0.780 0.625 0.500 0.400
49 50 51 52 53 54 55 56 57 58 59 60 61 62 63 64 65 66 67 68 69
Emax (eV) 0.350 0.320 0.300 0.280 0.250 0.220 0.180 0.140 0.100 0.080 0.067 0.058 0.050 0.042 0.035 0.030 0.025 0.020 0.015 0.010 0.005
Chapter 2: Neutronic Calculations
2.3.3 Core Analysis Code CITVAP v3.1 (CITATION–II) The CITATION code solves zero, one, two or three spatial dimensions multi-group diffusion equations - the diffusion theory approximation of the neutron transport theory - with arbitrary group-to-group scattering [14]. The CITATION treats XYZ, θRZ, hexagonal-Z, and triagonal-Z geometries using the finite difference representation of the neutron diffusion theory explicitly in space and time. The inputs are the geometrical description of the reactor: geometry selection, zones definition, and mesh size; and the multigroup cell averaged constants for each spatial zone specified, which are tabulated as either micro- or macroscopic cross-section libraries, and for the multi-cycle analysis the BOC burnup distribution and the fuel management routine. The results of the criticality calculations and the solution of the neutron flux eigen-value problems - using the direct iteration method - are the effective multiplication factor keff or the nuclide densities required for a critical system and the energy and spatial dist-ribution of the neutron flux, also the zone average fluxes and burnup. CITVAP v3.1, the deterministic numerical code used in the research for the reactor calculations, is an enlarged and improved version of the original and well known CITATION–II code, developed by the INVAP’s Nuclear Engineering Division [66]. CITVAP preserves all the calculational capabilities of CITATION with programming modifications for implementations on PCs, graphical interface, and a free format input. CITVAP performs burnup dependent calculations for depletion problems, fuel managements for multicycle analysis, control rod displacement, criticality calculations and criticality search - adjusting fuel loading, search for equilibrium cores, and interruption of calc-ulations under given conditions, i.e. fuel elements replacement when the core excess reactivity is lower than a given value, also the program has the capability to use the nuclear data as microscopic or macroscopic cross sections libraries.
23
Chapter 2: Neutronic Calculations
2.3.4 The Monte Carlo Codes The Monte Carlo codes has the ability to model any physical arrangement of fissile and neutron absorbing materials, and for interest, thermal reactors. The Monte Carlo codes can perform the whole core burn up and criticality calculations in small reactors, as these codes includes a microscopic burnup capability. Monte Carlo codes are used to calculate the flux at a given point through the transport solution, by simulating individually millions of neutron histories throughout their entire life from some source to a terminal category, and this flux is used to determine the reaction rates of the materials, which are then used to calculate the new material composition by solving the depletion equations [58] [20] [29] [41]. Some of the widely used Monte Carlo codes: MONK, which is primarily used for the solution of nuclear criticality and reactor physics problems [55], with major features such as hyperfine energy nuclear data libraries, continuous energy collision modeling, accuracy, efficiency, and confidence. The MCBEND is a general purpose radiation transport package that can calculate neutron, gamma-ray and electron transport in sub-critical systems [58]. MCNP is a general purpose Monte Carlo N-Particle code that can be used for neutron, photon, electron, or coupled neutron/photon/electron transport, including the capability to calculate eigen-values for critical systems. In the neutronic studies, the Monte Carlo code is used mainly in the criticality and depletion calculations [24]. Point-wise cross-section data libraries are used as pre-stated in section 2.2. The MCNP code package has the associated nuclear data tables, and of interest in neutronic calculations, the neutron interaction data [36]; continuous energy neutron interaction data and discrete reaction neutron interaction data.
24
Chapter 3: Benchmark Case Studies
CHAPTER 3: BENCHMARK CASE STUDIES
3.1 Introduction This chapter contains the specifications of the case studies: the IAEA 10 MW benchmark reactor used for the neutronics and the safety-related benchmark studies; the IAEA TRX and BAPL standard benchmark lattices; and the TRIGA Mark-III Thai research reactor TRR-1/M1; also all the specifications under which the calculations were performed: burnup distributions, control rods pattern, … etc.
3.2 The IAEA 10 MW Benchmark Reactor - Neutronics Benchmark Calculations The benchmark problems were specified at the consultants meeting on "Preparation of a programme on Research Reactor Core Conversions to Use LEU instead of HEU" [31], which are addressed for the neutronics studies and safety analysis of plate type research reactors for enrichments: 93%, 45%, and 20%. The specifications of the benchmark problems are given in table 3 and figures 3 and 4, also the arrangements of the fuel plates in the SFEs and CFEs are shown in figures 1 and 2. “Briefly, they correspond to a 10 MW, 6x5 element core reflected by a graphite row on two opposite sides, and surrounded by water. The standard MTR-elements contains 23 fuel plates. The enrichments considered are 93%, 45%, and 20%, and each of these correspond to a U-235 content of 280, 320, and 390 gm per element, respectively. The calculations were to be carried out with Xe-equilibrium and for various burnup conditions. The main data to be calculated were the absolute reactivities keff as well as the subsequent reactivity differences and the flux distributions.” [31] [61].
25
Chapter 3: Benchmark Case Studies
Figures 3 and 4 show cross sectional cuts thought the core indicating the burn-up distribution for the full and quarter cores respectively, also the BOC and EOC burnup distributions, which represent a 5% burnup step. Water reflector around the core with the indicated dimensions in the X-Y plane and 8 cm for the Z-axis are used to represent the boundary at which the neutron flux goes to zero. The problem specified is for XY dimensions only, but the current neutronics and safety-related benchmark calculations were run for the XYZ dimensions, for benchmarking this modified routine. Table 3: Specifications of the neutronics benchmark Problem [61]. Aim: Comparison of the different calculation methods and cross-section data sets used in different laboratories. Only limited conclusions can be drawn for real cores conversion problems. Specifications for the Methodical Benchmark-Problem Data and Specifications Agreed Upon: Active Core Height 600 mm Extrapolation Length 80 mm (the cosine-shaped flux goes to zero)(Z-axis only) X-Y Calculations only (for the reference ANL and INTERATOM, but currently 3D XYZ calculations are performed) Space at the grid plate per fuel element 77 mm x 81 mm Fuel elements, as shown in figures 1 and 2: - Fuel elements cross-section: 76 mm x 80.5 mm including support plate / 76 mm x 80.0 mm without support plate - Meat dimensions: 63 mm x 0.51 mm x 600 mm - Aluminum-canning with ρAl = 2.7 g·cm-3 - Thickness of support plate 4.75 mm; ρAl = 2.7 g·cm-3 - No. of fuel plates per fuel element: 23 identical plates, each 1.27 mm thick - No. of fuel plates per control element: 17 identical plates, each 1.27 mm thick
26
Chapter 3: Benchmark Case Studies
-
Identification of the remaining plate positions of the control element: 4 plates of pure aluminum ρAl = 2.7 g·cm-3, each 1.27 mm thick in the position of the first, the third, the twenty-first, and the twenty-third standard plate position; water gaps between the two aluminum plates.
-
Specifications of the different fuels (UAlx-Al Fuel) for HEU, MEU, LEU corresponding to the previous definitions:
HEU: Enrichment 93 w/o (weight %) U-235 - 280 g U-235 per fuel element, which corresponds to 12.174 g U-235 per each fuel plate - 21 w/o of uranium in the UAlx-Al - only U-235 and U-238 in the fresh fuel MEU: Enrichment 45 w/o U-235 - 320 g U-235 per fuel element (23 plates) - 40 w/o of uranium in the UAlx-Al - only U-235 and U-238 in the fresh fuel LEU: Enrichment 20 w/o U-235 - 390 g U-235 per fuel element (23 plates) - 72 w/o of uranium in the UAlx-Al - only U-235 and U-238 in the fresh fuel -
Total power: 10 MWth (power buildup by 3.1 x 10¹⁰ fission/Joule)
-
Xenon-State: Homogeneous Xenon content corresponding to average-power-density
Results - keff; fluxes and flux ratios along the two symmetry-axes of the core in three groups and for begin of cycle (BOC) and end of cycle (EOL), respectively. -
ϕthermal ϕepithermal ϕfast
0 eV < En < 0.625 eV 0.625 eV < En < 5.531 keV En > 5.531 keV
27
Chapter 3: Benchmark Case Studies
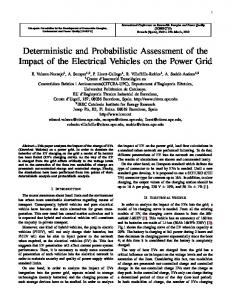
Figure 1: Cross-section in the XY plane showing half of the SFE.
Figure 2: Cross-section in the XY plane showing half of the CFE, and the position of the absorber blade and the two guide plates.
28
Chapter 3: Benchmark Case Studies
Figure 3: The BOC burnup distribution in (%) burnup [61].
Figure 4: The BOC and EOC burnup distributions in (%) burnup [61].
29
Chapter 3: Benchmark Case Studies
3.3 The MTR IAEA 10 MW Benchmark Reactor - SafetyRelated Benchmark Calculations The second part of the benchmark calculations is the safety-related benchmark problem. First, the current study will be concerned only with a limited number of specifications as prescribed in table 4, which are entirely static calculations: reactivity feedback coefficients, power peaking factors, and control rods worth. The reactor description is the same as that in table 3, which is used in the neutronics benchmark calculations [61], except for a change in the description of the central flux trap as in table 4 [63]. Table 4: Specifications of the safety-related benchmark problem [63]. Aim: Compare different calculational methods used in various research centers. Reactor Description - 10 MW Reactor used for neutronics benchmark calculations in IAEA - TECDOC-233 (1980) [TEC-DOC, 233]. Change in Description - Replace water in central flux trap with a 77 mm x 81 mm block of aluminum containing a square hole 50 mm on each side containing water in order to compute more realistic radial and local power peaking factors for the limiting standard fuel element. Cores - HEU (93%), MEU (45%) - optional -, and LEU (20%). Burnup Status of Cores - BOC, based on equal % burnup. Static Calculations: 1. Isothermal Reactivity Feedback Coefficients: - a) Change of Water Temperature Only - 38°C, 50°C, 75°C, 100°C. - b) Change of Water Density Only - 0.993, 0.988, 0.975, 0.958 g/cm3. - c) Change of Fuel Temperature Only - 38°C, 50°C, 75°C, 100°C, 200°C. - d) Core Void Coefficient - Change Water Density Only - 10%, 20% Void.
30
Chapter 3: Benchmark Case Studies
2. Radial and Local Power Peaking Factors In HEU BOC Core: - a). Replace burned HEU CFE-1 with fresh HEU CFE and fresh LEU CFE. - b). Replace burned HEU SFE-1 with fresh HEU SFE and fresh LEU SFE. - c). Note reactivity changes for each case. 3. Control Rod Worths - a). Reactivity worth of four fully-inserted control rods with Ag/In/Cd absorber in HEU core. - b). Repeat a) with B4C absorber using natural boron. - c). Repeat a) with Hafnium absorber. - d). Repeat a), b), and c) for LEU core. Control Rod Geometry, as shown in figures 1 and 2: Fork-Type with blades fitting into guides described in IAEA - TECDOC-233 benchmark problem. - 600 m Length Thickness - 3.18 mm; 3.1 mm-thick absorber with a 0.04 mm layer of nickel on each surface of Ag/In/Cd and B4C blades. - 3.1 mm-thick absorber for Hf blades (no nickel layer). Width - 66 mm Absorber Materials i). Ag/In/Cd 80.5 w/o Ag, 14.6 w/o In, 4.9 w/o Cd Density of Ag-In-Cd : 9.32 g/cm3. Densities of Ag = 7.50 g/cm3, In = 1.36 g/cm3, Cd = 0.46 g/cm3, Ni = 8.90 g/cm3. ii). Boron Carbide (B4C) Density of B4C = 2.52 g/cm3. iii). Hafnium Density of Hf = 13.3 g/cm3.
31
Chapter 3: Benchmark Case Studies
3.4 The TRX and BAPL Standard Benchmark Lattices Two types of thermal benchmark lattices of the Bettis Atomic Power Laboratory (BAPL), Westinghouse, USA, were analyzed: the H2O-moderated uranium metal lattices TRX-1 and TRX-2 - UME-LW-BAPL-TRX - [22] and the H2O-moderated uranium oxide critical lattices BAPL-UO2-1, BAPL-UO2-2 and BAPL-UO2-3 - UO2-LW-BAPL-TRX - [25]. The TRX-1 and TRX-2 benchmark lattices are light water moderated uranium metal critical lattices, with 1.3 wt% enriched uranium metal rods with diameters of 0.9830 cm arranged in triangular arrays as in figure 5 [8][22][3]. The BAPL-1, 2 and 3 benchmark lattices are light water moderated uranium oxide critical lattices, with 1.311 wt% enriched uranium oxide rods with diameters of 0.9728 cm arranged in triangular arrays as in figure 3 [8][25][3]. Tables 5 and 6 include the specifications of the TRX-1 and -2 benchmark lattices and the BAPL-1, -2, and -3 standard benchmark lattices, respectively. Table 5: Specifications of the TRX-1 and -2 benchmark lattices [8][22]. Outer Radius (cm) Isotope Concentration ( x 1024 atoms/cm3 ) 0.4915 U-235 6.2530 x 10‒4 U-238 4.7205 x 10‒2 Void 0.5042 Clad 0.5753 Al 6.025 x 10‒2 a 1 Moderator H 6.676 x 10‒2 16 O 3.338 x 10‒2 a lattices spacing of 1.8060 cm and 2.1740 cm, and buckling of 57.00 54.69 respectively for the TRX-1 and TRX-2, in triangular arrays. Region Fuel
Table 6: Specifications of the BAPL-1, -2 and -3 benchmark lattices [8][25]. Outer Radius (cm) Isotope Concentration ( x 1024 atoms/cm3 ) 0.4864 U-235 3.1120 x 10‒4 U-238 2.3127 x 10‒2 Void 0.5042 Clad 0.5753 Al 6.025 x 10‒2 a 1 Moderator H 6.676 x 10‒2 16 O 3.338 x 10‒2 a lattices spacing of 1.5578 cm, 1.6523 cm and 1.8057 cm, and buckling of 32.59, 35.47 and 34.22 for the BALP-1, -2, and -3 respectively, in triangular arrays. Region Fuel
32
Chapter 3: Benchmark Case Studies
Figure 5: The general geometry of the TRX and BAPL benchmark lattices.
3.5 The TRR-1/M1 Reactor Description The Thai Research Reactor-1/Modification-1 is a TRIGA Mark III research reactor, which is designed and supplied by the General Atomics Co. and operated by Thailand Institute of Nuclear Technology [53][47]. The reactor is a pool-typed reactor with a movable core that is light water cooled, moderated by light water and Zirconium-Hydride ZrH and reflected by water and graphite [53][34][47]. The reactor fuel is the LEU TRIGA Uranium-Zirconium-Hydride (UZrH1.6) fuel-moderator fuel rods, which are stacked circularly in hexagonal rings [53] that are labeled; B, C, D, E, F, and G ring, outwardly from the center thimble (CT) [34]. The reactor is multipurpose with a steady state operation up to 2 MWth that is typically used for production of radioisotope, neutron beam experiments and reactor physics experiments [53][34][47]. The reactor has a max in-core thermal and fast flux of 3.1x10¹³ and 1.8x10¹³ respectively [47]. Since the initial criticality of the TRR-1/M1 on November 7, 1977, the whole core was composed of fuel rods of 8.5% w/o uranium load and 20% w/o U-235 enrichment (SFE). Since 1980, with an objective of improving the useful lifetime of the fuel elements, the burned standard fuel elements are gradually core-by-core replaced by fresh 20% w/o uranium load and 20% w/o 33
Chapter 3: Benchmark Case Studies
U-235 enrichment fuel elements (LEU) with a neutron poison of 0.47 wt % erbium, resulting in mixed cores [53][34][16]. Three configurations of the Thai research reactor TRR-1/M1 are analyzed: 1. Core #1; consists of 96 FRs (SFE), 16 IPs, 3 NDs, 1 CT, 4 fuel-follower CR, and 1 air-follower TR, as shown in figure 7 [34]. 2. Core #2; consists of 95 FRs (SFE), 5 FRs (LEU), 12 IPs, 3 NDs, 1 CT, 4 fuel-follower CRs, and 1 air-follower TR, as shown in figure 8 [34]. 3. Core #3; consists of 67 FRs (SFE), 38 FRs (LEU), 7 IPs, 3 NDs, 1 CT, and 5 fuel-follower CRs, as shown in figure 9 [16]. The core has a hexagonal shape with a diameter of ~ 55 cm and active height of 38.1 cm. The rod-type reactor elements are stacked circularly in hexagons, which are positioned in aluminum racks, and all the reactor elements are submerged in the light water reflector and coolant which has an effective temperature of 312 °K for the 1st and 2nd cores and 300 °K for the 3rd core. The fuel elements - SFE and LEU - are rods that have a tubing shape with an overall length of 55.50 cm and inner and outer diameters of 3.63 and 3.73 cm respectively. The outer cladding tube is stainless steel tube SS304 that surrounds a cylinder of U-ZrH1.6 fuel in the 38.10 cm central part and 8.7 cm long graphite plugs at the top and bottom of each rod [16]. There are two types of fuel elements which are 20% w/o U-235 enriched; SFE and LEU that are 8.5% and 20% w/o uranium load that correspond to uranium densities of 0.49 gm/cm3 and 1.27 gm/cm3 respectively. The effective fuel temperature for the 1st and 2nd cores is 628 °K and for the 3rd core is 700 °K. The control rods are composed of a boron carbide - B4C - neutron absorber part followed by a fuel zone - SFE - except for the transient rod in the 1st and 2nd cores, in which it is air-follower. The absorber zone is above the fueled zone, and upon control rod complete insertion, the fueled part is out of the core
34
Chapter 3: Benchmark Case Studies
and the absorber part levels with the active core length, and for the complete with-drawal, the fueled part levels with the active core length and serves as additional fuel rod as shown in figure 6. The control rods resemble a SS304 tube - aluminum for the air-follower transient rod of the 1st and 2nd cores - of the same diameters as that of the fuel rods with the length of the absorber part and the fueled part of 38.1 cm for each. The temperatures of the control rod non-fuel materials were set equal to the moderator temperatures [16][34]. The central thimble, neutron detectors, and irradiation positions have the same dimensions as that of the fuel rods with the same cladding material SS304. For the 1st and 2nd cores, they were modeled as water filled tubes, and as voided tubes for the 3rd core [16][34]. The 1st and the 3rd core are modeled as fresh cores with no burned fuel elements. The 2nd core has an equilibrium burnup distribution, which is equivalent to the 1st core EOC burnup distribution upon the completion of a burnup cycle of 61.23 MWD and replacement of 5 out of the 11 SFE fuel rods of the C-ring with 5 fresh LEU fuel rods [16][34]. Figure 6: The FRs and the CRs: fully inserted and fully withdrawn.
35
Chapter 3: Benchmark Case Studies
Figure 7: Midplane cross-section cut through the TRR-1/M1 1st core [34].
Figure 8: Midplane cross-section cut through the TRR-1/M1 2nd core [34].
Figure 9 : Midplane cross-section cut through the TRR-1/M1 3rd core [16].
36
Chapter 4: Calculational Methodologies
CHAPTER 4: CALCULATIONAL METHODOLOGIES
4.1 Introduction This chapter presents the current research methodology, starting with the selection of the deterministic calculational route, the choice of the computational analysis tools, the application of each code in the calculations, and finally with specifications of the solution techniques and the selected parameters for each case study - the benchmarks and the realistic core problem.
4.2 Calculational Route Selection Once the objectives are established, the requirements that determine the data collection and processing tools will be envisioned, and the case studies required to achieve these objectives can be selected. As will be discussed in this chapter, the selected computational analysis tools are: the WIMSD-5B code, the CITVAP v3.1 code, and the WIMSD-IAEA-69 library, also the selected case studies as discussed in chapter 3 are: the IAEA 10 MW benchmark reactor, the TRX and BAPL benchmark lattices, and the TRR-1/M1 TRIGA research reactor. These selections are based on the stated objective, which is to validate and benchmark the deterministic diffusion method for the neutronic calculations and safety analysis of the MTR research reactors utilizing the standard plate type fuel and the TRIGA type fuel. In evaluating the neutronics and the safety-related parameters of research reactors using the neutronics calculations technique, two different approaches are possible: the deterministic and probabilistic approaches. The second chapter contains a brief comparison between the capabilities of both the deterministic
37
Chapter 4: Calculational Methodologies
and probabilistic approaches in the neutronics studies, clarifying the merits and demerits of each approach. Careful analysis with certain parameters in mind will help in the choice of the calculational approach to be used: the complexity of the problems under investigation, the required degree of accuracy of the results, and the global trends in doing such studies. The deterministic approach is selected in performing the neutronics studies and the safety-related analysis, which is capable of handling the degree of complexity encountered in such studies with sufficient reliability and accuracy of the final results, also, globally this trend is widely used in the neutronics studies and safety analysis of research reactors, even not to a great extent as it once was, but still taking a leap in extensive and lengthy studies such as fuel managements [54] [29], as previously discussed in chapter 2. In fact, the choice of the deterministic approach as a sufficient and appropriate calculational approach in performing the neutronics studies and the safety analysis of research reactors will be under test through the current benchmarking and validation study, in which the process of assessment and validation will be run through comparisons of the results with reference reported calculations and experimental values. As to be latterly discussed in this chapter; the study contains: cell-level calculations for generation of the cell constants of each material or region in the core under different spectra, lattice calculations for the TRX and BAPL benchmarks for generation of the lattice integral parameters, and 3D core-level calculations, which are criticality calculations, neutron flux eigen-value problems and burn-up studies. Based on this breakdown of the calculations, the specification of case studies and benchmarks as stated in chapter 3, and the previously used tools in performing such studies as discussed in chapter 1 [1] [2] [6] [13] [37] [38] [48] [65] [69], will be the determinant in the selection of the numerical analysis tools to be used in the current validation and benchmarking studies.
38
Chapter 4: Calculational Methodologies
The cornerstones in the calculational process are: the nuclear data library, the lattice and cell calculations code, and the core calculations code. The selected nuclear data library is the WIMSD-IAEA-69 library. By referring to section 2.4.1 which lists the advantages of using such library, and briefly restated: it is an updated, well tested, and benchmarked WIMSD compatible multigroup nuclear data library with an increased number of materials, fission products, ... etc, and that will help improve the performance of WIMSD code and the reactor lattice calculations by enabling the usage of the most recent ENDLs for research reactors calculations [3]. The selected lattice and cell analysis code is the WIMSD-5B code. Even higher versions with more capabilities in cell-level or even core-level calculations are released like the WIMSE, WIMS7, … etc [19], the used version is available, completely sufficient and accurate for the lattice and cell calculations, and it will be used only at the cell-level calculations for generation of the cell constants and another code will be used at the core-level calculations. Of the advantages of the WIMSD code, is that it is: popular, accessible, the most widely used, and versatile software package with sound theoretical basis for the lattice and cell calculations of the thermal research reactors [4][19]. The selected core calculations code is the CITVAP v3.1 code, which is capable of performing the required core-level neutronics calculations and safety analysis, including the criticality calculations, neutron flux eigen-value problems and burn-up studies using the MXS libraries generated using the WIMSD code at the cell-level calculations [66][14]. The computational analysis tools are selected based on envisions of the studied parameters, the required accuracies of the results, and the degrees of complexity encountered, which are all based on the stated objectives and the case studies under investigation, also the selection is based on the current trends in performing such neutronics studies and safety analysis, also the availability has been a factor in the route selection procedure. The appropriateness of such selections will be under test through detailed comparisons against reported reference calculations and experimental evaluations.
39
Chapter 4: Calculational Methodologies
4.3 Specification of the Calculational Route The deterministic diffusion calculational route WIMSD-5B [35] / CITVAP v3.1 [66] along with the WIMSD-IAEA-69 nuclear data library [3], which are available with the MTR_PC v3.0 computer package [67] is used in the current study for performing: lattice calculations, cell calculations, and core calculations, for evaluation of the lattice and cell constants and the reactor neutronics and safety-related parameters.
4.4 Steps of the Neutronics Calculations Route In the current research, neutronics studies and safety analysis of thermal research reactors of the MTR type are performed based on the diffusion theory approximation of the neutron transport - the deterministic diffusion method, also analysis of selected IAEA benchmark lattices using a transport based code. The traditional way of analyzing a thermal research reactor is done in three steps, [19][29][43]: 1. Working Library Generation 2. Cell or Lattice Calculations - cell constants generation or lattice analysis 3. Core Calculations - criticality, neutron flux, and depletion problems The first step is the working libraries generation, which is not performed in the current study due to the already available nuclear data library; here the WIMSD-IAEA-69 library. The original data of the WIMSD library are evaluated using the cross section processing code NJOY97 from the evaluated nuclear data files: ENDF/B–VI, JENDL–3.2, JEF–2.2, … etc. The evaluated nuclear data files tabulate the microscopic cross sections in a point wise form versus energy for each isotope of interest or as the equivalent functional form of the cross sections with appropriate parametric values in the ENDF-6 format. 40
Chapter 4: Calculational Methodologies
The nuclear data inputs for the cell transport code to be used later have to be group dependent average cross section - broad energy group format. The output of the first step is the working nuclear data library in the WIMS format WIMSD-IAEA-69 nuclear data library [3][40]. The second step in the neutronic calculations is the lattice or cell calculations, which is performed using the cell transport code WIMSD–5B; a program that solves the energy and space dependent neutron transport equation numerically with energy and spatial discretization using the working nuclear data library and the input cell/cells description that sufficiently and accurately represent each material or region in the core under different spectra. This step involves the usage of the post processor codes POS_WIMS for further homogenization of the materials or regions and condensation of the energy spectra, and the HXS program for handling cross sections and preparation of the MXS libraries in the CITATION format. The results of this step are the infinite multiplication factor k∞, the effective multiplication factor keff for a given input geometrical buckling, and the cell constants: diffusion coefficients, absorption MXSs, production MXSs, and the scattering matrix, and later after the application of the HXS, the MXSs libraries in the CITATION format. The results of the cell calculation step are tabulated in MXS libraries against reactor parameters, know as Dependices: burnup, temperature, coolant density, … etc [20][17][43]. The third step is the core calculations - criticality calculations, neutron flux eigen-value problems, and depletion problems, in which the deterministic numerical code CITVAP is used - CITVAP is an improved version of the well know CITATION-II, which is a program that solve the finite difference representation of the neutron diffusion theory - the diffusion approximation of the neutron transport theory, through the multigroup neutron diffusion equations [14][66]. Core calculations are performed using libraries of MXSs generated from the cell-level calculations and prepared in the CITATION
41
Chapter 4: Calculational Methodologies
format using the HXS program. A sufficient number of cells for the cell calculations are required in order to build libraries with suitable range of Depedices and to obtain rapid calculations [43]. The inputs for this steps are: the prepared MXSs libraries, the reactor geometry specification and zones definition, and the burnup distribution or the BOC state file from previous cycles for the multicycle problems. The results of this step are the effective multiplication factor keff, the PPFs, the neutron flux distribution, the power distribution; hence, depletion and burnup distributions can be evaluated . In the current research the calculational route starts from the second step, as actually a working nuclear data library is already available and in hand; the WIMSD-IAEA-69 library. The calculational line contains cell calculations for the cell constants generation, lattice analysis, and core calculations; criticality calculations, neutron flux eigen-value problems, and depletion problems. The calculational scheme described in figure 10, indicates the deterministic calculational line that is used in the current research, clarifying each step: working library generation, cell calculations, and core calculations, and the code/codes used at each step with the inputs and outputs for each code.
42
Chapter 4: Calculational Methodologies
Working Library Generation
Evaluated Nuclear Data Files
ENDF/B-VI, JENDL-3.2, JEF-2.2, … etc.
Cross Section Processing Code
NJOY-97
Working Nuclear Data Library
WIMSD-IAEA-69
Inputs
● k∞
Lattice Cell Calculations
● Cell Constants: - Diffusion Coefficients - Absorption MXS - Fission MXS - Scattering matrix
Cell Analysis Code
WIMSD-5B
Cell Geometry, Material Specs, Solution Methods,
Energy Spectra, … etc.
POS_WIMS 2.0
Homogenization & Condensation Structure
HXS 4.1
Macroscopic Cross Section Libraries
Input Data;
Core Calculations
Output File ● keff ● Neutron Flux Distribution ● Power Distribution
Core Analysis Code
CITVAP v3.1
● Power Peaking Factors
Reactor Geometry, Zone Definition, Burnup Distribution, Control Rods Pattern, Fuel Management Routine, ... etc.
State File EOC Core Burnup Distribution
Fuel Management Routine
Figure 10: Calculational scheme for the neutronics and safety-related benchmark calculations.
43
Chapter 4: Calculational Methodologies
4.5 Calculational Techniques In general, different calculational techniques are adapted in each part of the study - the benchmark calculations and the real core problem - for generation of the cell constants through different cell types that in total represent the reactor and sufficiently generate the cell constants for each material in the reactors at different spectra, also for calculation of the integral parameters of the TRX and BAPL benchmark lattices, and for core calculations, which are commonly 3D calculations, that represent different reactor core arrangements and statuses.
4.5.1 The Neutronics and Safety-Related Benchmark Calculations The general cell transport code WIMSD-5B along with the WIMS nuclear data library WIMSD-IAEA-69 are used to generate the homogenized cell constants: the diffusion coefficients and the macroscopic cross sections, for all the materials or regions in the core in the condensed energy spectra and as a function in burn-up when required. The cell constants are generated either at the condensed spectrum directly, or generated at the full spectrum of a 69 group structure, then using the post processor code POS_WIMS to condense the cell constants into a condensed energy structure. The condensed energy spectra used in the benchmark calculations is mainly a 5 energy groups spectra with the energy boundaries as described in table 7, except for the case of the control rods worths in which the 10 energy group spectra is used. For the purpose of comparison of the neutron flux distributions, the 3 energy groups spectra specified in the benchmark specification in chapter 3 is used, which is condensed from the 5 energy groups spectra so that the 1st and 2nd groups are the fast group, the 3rd and 4th groups are the epithermal group, and the 5th group is the thermal group.
44
Chapter 4: Calculational Methodologies
For the neutronics and the safety-related benchmark calculations, and after several trials for selection of the different cell types that in total will sufficiently represent all the materials in the reactor under different conditions and spectra, five different cell types were used to generate the cell constants: the 1st cell is used to generate the cell constants for the SFE which is in the slab geometry with four regions including the extra region for all the excess aluminum and water beyond the width of the fuel meat as in shown in figure 11. The first three regions: meat, clad, and water, are homogenized together to form the cell constants of the fueled region in the SFE, and along with the two extra regions form three zones for each fuel element that later are utilized for zone definition in the core calculation scheme, as shown in figure 12. The 2nd cell is used for generation of the cell constants for the CFE, and it is identical to the first cell except for the width of the extra region and the water channel. The 3rd cell is used for generation of the follower or control rod zone cell constants, in which a slab geometry of half of the CFE along with one side of the fork type control rod or the follower. The 4th cell has a cylindrical geometry for generation of the cell constants of: the central and outer irradiation channels, the graphite reflector around the core, and the radial water reflector. The fifth cell has a slab geometry for generation of the cross sections of the axial endbox above and below the core and the axial water reflector. The buckling inputs were specified as 0.00612897 radially and 0.00170873 axially, and were driven as the geometric buckling of a cylinder of height 60 cm and radius 22.72 cm with reflector savings of 8 cm added to the top, bottom and radius of the reactor. The 22.72 cm radius corresponds to the same area as the fuelled region plus the central flux trap. The input power rating used for depletion of the U235 was that of the average plate in the core at each enrichment. The core diffusion code CITVAP v3.1 is used to evaluate the modeled reactors neutronics and safety-related parameters: excess reactivities, effective multiplication factors keff, neutron flux distributions, power distributions, PPFs, … etc, using the prepared 5 energy groups MXS library. Unlike the listed
45
Chapter 4: Calculational Methodologies
research centers, the calculations were done in the 3D geometry with the full cores, and the power were normalized to 10 MW for flux plotting. All fuel and graphite elements have a 15.0 cm Al-H2O axial reflector at each end with 20% Al and 80% H2O volume fractions, followed by 15.0 cm H2O reflector. The SFEs were modeled in the CITVAP code as three zones for each element, one fueled region and two extra regions, as shown in figure 12, while the CFEs were modeled as 5 zones to include the two extra follower zones and as 9 zones for the case of the inserted control rods, as shown in figure 13. The calculational procedures used in the safety-related benchmark calculations are similar to that used in the neutronics calculations, except that the cross sections used for evaluation of the isothermal reactivity feedback coefficients are condensed into 10 energy groups instead of 5 groups, and the rest of calculations are for 5 energy groups, as shown in table 7. The central irradiation channel is replaced with a 7.7 cm x 8.1 cm aluminum block with 5 cm x 5 cm water filled square hole. Figure 11: The half cell model used at the cell-level calculations for generation of the cell constants of the materials within the SFEs and CFEs fueled regions.
46
Chapter 4: Calculational Methodologies
Figure 12: General geometry of the SFE along the XY plane, and the three zones used to represent each SFE in the core-level calculations.
Figure 13: Cross-sectional cuts through the two models that represent CFEs in the core-level calculations: the follower case with 5 zones and the control rods case with 9 zones.
47
Chapter 4: Calculational Methodologies
4.5.2 Benchmark Calculations – TRX and BAPL Benchmark Lattices – The integral parameters of the TRX and BAPL benchmark lattices [10]: TRX-1 and -2; and BAPL-1, -2, and -3 thermal assemblies, were evaluated using the lattice calculations code WIMSD-5B [35], and the WIMS nuclear data library WIMSD-IAEA-69 [3], at five and seven energy groups condensation spectra, as shown in table 7. The main transport calculations are performed using the discrete ordinate method at the two condensation spectra. Table 7: The upper and lower boundaries for the energy groups spectra. Energy Group Epithermal Thermal
E1 E2 E3
Energy Group
Epithermal Thermal
E1 E2 E3 E4 E5
Energy Group
Epithermal
Thermal
E1 E2 E3 E4 E5 E6 E7
Energy Group
Epithermal
Thermal
E1 E2 E3 E4 E5 E6 E7 E8 E9 E10
3 Energy Groups EU EL 10 MeV 5.530 KeV 5.530 KeV 0.625 eV 0.625 eV 0.0 eV 5 Energy Groups EU EL 10 MeV 0.821 MeV 0.821 MeV 5.530 KeV 5.530 KeV 2.1 eV 2.1 eV 0.625 eV 0.625 eV 0.0 eV 7 Energy Groups EU EL 10 MeV 0.500 MeV 0.500 MeV 9.118 KeV 9.118 KeV 1.123 eV 1.123 eV 0.625 eV 0.625 eV 0.140 eV 0.140 eV 0.050 eV 0.050 eV 0.000 eV 10 Energy Groups EU EL 10 MeV 0.821 MeV 0.821 MeV 9.118 KeV 9.118 KeV 5.53 KeV 5.53 KeV 2.1 eV 2.1 eV 1.15 eV 1.15 eV 0.625 eV 0.625 eV 0.400 eV 0.400 eV 0.140 eV 0.140 eV 0.058 eV 0.058 eV 0.000 eV
48
Chapter 4: Calculational Methodologies
4.5.3 The Neutronic Calculations of the TRR-1/M1 Research Reactor Application of the deterministic diffusion method in the neutronic calculations of thermal research reactors is divided into two parts: the preliminary cell calculations step and the core calculations step. Currently, the cell calculation step is performed using the lattice transport code WIMSD-5B along with the WIMSD-IAEA-69 nuclear data library, which are used to generate the condensed and homogenized cell constants for all the materials in the core in the proposed condensed energy spectra: the five and seven energy groups spectra. Afterwards, macroscopic cross sections libraries are prepared, which contain mainly the macroscopic absorption cross sections Σag, production cross sections νΣfg, scattering matrix, and the diffusion coefficients. The MXS libraries are then used in the second step - the core calculations step, in which the tabulated condensed and homogenized cell constants are used in the zones definition. The geometry specification, zones definition, and calculation routine constitute the CITVAP v3.1 inputs, which is used for evaluation of the reactor neutronics and safety-related parameters.
4.5.3.1 Application of the WIMSD-5B Cell Calculations Code The cell constants were generated using three models that sufficiently and accurately represent all the materials in the core under different spectra. The first model is used to evaluate the cell constants of the SFE and LEU fuel elements, which is a hexagonal pin-cell model representing the circular fuel rod, associated clad, and the hexagonal water region around each rod as shown in figure 14. The core is divided in the radial plane into equal hexagons that fit together with no space in-between as shown in figures 16, 17, 18. The cell constants of the fuel rod and the associated clad and water within each hexagon were weighted and averaged together using the weighting flux to give the cell constants of the whole hexagon to be defined later in CITVAP as a distinct
49
Chapter 4: Calculational Methodologies
zone. The second model is used to evaluate the cell constants of the non-fuel material in the core: the irradiation positions, the control rods absorber part, … etc. The second model incorporates the MULTICELL option available in the WIMSD-5B code, in which separate pin-cells were used together for the SFE, LEU - for generation of spectra, control rods, and irradiation channels - water filled or voided. Each cell is composed of a cylindrical annulus of the fuel type SFE or LEU, B4C absorber, water or air according to the cell type, followed by a ring of stainless steel clad, and followed by a hexagonal water zone. The third cell type is used to generate the cell constants of the graphite plugs, aluminum grid and support plates, and the water reflector. The slab model used represent half of the active core height, the top graphite plugs, the aluminum grid and support plates, and the axial water reflector as shown in figure 15. As the neutron spectrum is considered unchanged between the radial and axial water reflectors and also for the aluminum grid and support plates at different locations, the same cell constants were used for each case separately. The macroscopic cross sections libraries were managed by the HXS v4.1 program - available with the MTR_PC v3.0 package - that handled the homogenized and condensed cell constants for each zone in the reactor in the CITATION format that were used in the core calculation step afterwards.
4.5.3.2 Application of the CITVAP v3.1 Core Calculations Code The multigroup diffusion-depletion code CITVAP v3.1 is used in the core calculation step using the prepared five and seven energy groups macroscopic cross sections libraries. The calculations are done using the 3D XYZ geometry representation for the three cores, and using sufficient amount of water reflector axially and radially. The presentation of different zones in the XY plane in the CITVAP code is done by transferring separately each hexagonal containing a fuel rod, control rod, … etc, into an equivalent squared shape zone, and
50
Chapter 4: Calculational Methodologies
conserving the volume ratios. The cell constants of the material within each hexagon were homogenized together while each hexagon was presented separately with no homogenization between different hexagons. Axially, separate zones representing graphite plugs, aluminum plates, and the water reflector were used. The number of mesh points for each zone containing rod was standardized for all the calculations to 10x10 along the XY directions to neutralize all parameters in the calculations. Each fuel element is divided axially into three zones of a central fueled part of and a top and bottom zones for the graphite plugs. The fuel follower control rods are divided axially into four zones, from top to bottom: void zone, boron carbide zone, SFE zone, and water zone. The irradiation channels are composed axially of one void zone. The calculations for the 1st and 2nd cores are run for the completely withdrawn and inserted control rods. The calculations for the 3rd core are run for three different control rods positions; completely withdrawn, completely inserted, and at the working position as illustrated in table 8. The cell constants for the 1st and 3rd cores were evaluated assuming fresh fuel with no burnup. For the 2nd core calculations; the burnup distribution represent the end of a 61.23 MWD cycle burnup distribution of the 1st core and replacement of 5 burned SFE fuel element of the C-ring with 5 fresh LEU fuel elements, as shown in figures 16, 17, and 18.
51
Chapter 4: Calculational Methodologies
Table 8: Control rods working positions of the TRR-1/M1 3rd core [16]. Control Rod No. Position (cm) a 1 (Transient Rod) 1.0 2 9.0 3 18.0 4 36.0 5 27.0 a The length of control rod out of the active length, 0 cm position defines the completely inserted control rod and vice versa.
Figure 14: The hexagonal model used for the SFE and LEU cell.
Figure 15: The slab model used for: Aluminum, Graphite, and the water reflector.
52
Chapter 4: Calculational Methodologies
Figure 16: The Core Model of the TRR-1/M1 1st Core.
Figure 17: The Core Model of the TRR-1/M1 2nd Core.
53
Chapter 4: Calculational Methodologies
Figure 18: The Core Model of the TRR-1/M1 3rd Core.
54
Chapter 5: Results and Discussions
CHAPTER 5: RESULTS AND DISCUSSIONS
5.1 Introduction This chapter contains the results and discussions of the benchmark calculations of the IAEA 10 MW benchmark reactor and the neutronics study of the TRIGA Mark-III Thai Research Reactor TRR-1/M1. The benchmark calculations consist of three parts: the neutronics benchmark studies, the safetyrelated benchmark studies, and the analysis of the integral parameters of the TRX and BAPL thermal benchmark lattices. The TRR-1/M1 neutronic study is the evaluation of the in-core nuclear characteristics of the TRIGA Mark-III Thai Research Reactor TRR-1/M1.
5.2 The Benchmark Calculations The emphasis of the benchmark studies: the neutronics and the safety related studies, are to validate and benchmark the WIMSD-5B/CITVAP v3.1 deterministic diffusion calculational route using the 69 energy groups WLUP nuclear data library, and to find out whether the basic nuclear data sets, computational analysis tools, and the modeling methods are adequate by figuring out qualitative and quantitative measures of the reliability and accuracy of the utilized methodology. The benchmark studies are performed through comparison with experimental data, standard analytical solutions, or against other computer programs for well defined reactor conditions. Currently, the results of the benchmark calculations - the neutronics benchmark studies and the safety-related benchmark studies - were compared with the reported results of the research centers: ANL, INTERATOM, ÖSGAE, CEA, EIR, CNEA, and JAERI [61][62][63]. Generally, the emphasis is on the ANL
55
Chapter 5: Results and Discussions
results, since it is extensive and covered the widest range of calculations. The results of the TRX and BAPL benchmark lattices were compared with reference experimental, deterministic and probabilistic results [10][64][27]. The purpose of benchmarking is to compare the computational methods used with references, and even the utilized IAEA 10 MW benchmark reactor model is similar to generic and realistic plate type MTR research reactors, the focus is on comparison of the results with the references rather than their absolute values, and conclusions corresponding to the feasibility of converting HEU cores to REU cores and the core neutronics and safety related parameters or core performance conclusions for realistic cores should not be drawn [61][62][63].
5.2.1 The Neutronics Benchmark Calculations The results of the neutronics benchmark calculations of the IAEA 10 MW benchmark reactor are mainly absolute reactivities plus reactivity steps and absolute neutron fluxes plus flux ratios for the three enrichments; HEU, MEU, and LEU, moreover, additional neutronics parameters such as isotopic densities and cell constants were presented for comparison with the references.
5.2.1.1 Isotopic Densities Variations The isotopic densities of special isotopes in the fuel meats for the three enrichments were evaluated using the discrete ordinate method - DSN - of WIMSD-5B code and the 69 energy groups WIMSD-IAEA-69 nuclear data library at five energy groups condensation spectrum with the energy groups boundaries as shown in table 7. The isotopic densities were evaluated at 5%, 10%, 25%, 30%, 45% and 50% burnup, which correspond to the burnup
56
Chapter 5: Results and Discussions
distributions of the BOC and EOC cores of the IAEA 10 MW benchmark reactor. The isotopic densities are graphed versus percent burnup for the three enrichments for comparison with the reference ANL EPRI-CELL results using the ENDF/B-IV evaluated nuclear data library [61]. The variation of the isotopic densities of the Pu-239, Pu-241, Sm-149, and Xe-135 isotopes are shown in figures 19, 20, 21, and 22 respectively. For the Pu-239 and Pu-241 isotopes, the variations of the isotopic densities show the same ascending behavior for the current results and the reference ANL results, and generally show good agreements for the three enrichments. The maximum deviations were encountered in the LEU case, and the deviations for the Pu-239 isotope are -3.08% and -3.65% at 25% and 30% burnup, respectively, and for the Pu-241 isotope are 7.03% and 8.53% at 25% and 30% burnup, respectively. The currently evaluated isotopic densities of the Xe-135 isotope are generally lower than that the reference ANL results but show good agreements and are still comparable, and the deviations for the LEU case at the 25% and 30% burnup are -3.32% and -3.24% respectively. For the Sm-149 isotope, the current calculations yielded greater variations when compared with the reference ANL results, specially for the LEU case and higher burup with deviations of 6.22% and 9.42% at the 25% and 30% burnup, respectively. The importance of such deviations of the Sm-149 isotope in the total macroscopic absorption cross sections of the fueled regions is reduced by the fact that the Maxwellian average thermal absorption cross-section - 0.0 eV < Eth < 4.0 eV for the Sm-149 isotope is 47418 barns as compared to 2700580 barns for the Xe-135 isotope as of the UKAEA Nuclear Data Library [21], even the isotopic density of the Sm-149 isotope is lower than that of the Xe-135 isotope by more than ten folds at the BOC and EOC. Both of the Sm-149 and Xe-135 isotopic densities affect the reactivity of the core, and the deviations between the current and the reference ANL results will be reflected on the deviations for the reactivity results, as to be shown later.
57
Chapter 5: Results and Discussions
Figure 19: Isotopic densities of the Pu-239 isotope vs. percent burnup for the current WIMSD-5B and the ref. ANL EPRI-CEL results [61].
Figure 20: Isotopic densities of the Pu-241 isotope vs. percent burnup for the current WIMSD-5B and the ref. ANL EPRI-CEL results [61].
58
Chapter 5: Results and Discussions
Figure 21: Isotopic densities of the Xe-135 isotope vs. percent burnup for the current WIMSD-5B and the ref. ANL EPRI-CEL results [61].
Figure 22: Isotopic densities of the Sm-149 isotope vs. percent burnup for the current WIMSD-5B and the ref. ANL EPRI-CEL results [61].
59
Chapter 5: Results and Discussions
5.2.1.2 The Cell Constants of the U-235, U-238, Water, and Graphite The microscopic absorption and fission cross sections of the U-235 and U238 isotopes were evaluated for the 0% and 50% burnup and for the HEU and LEU enrichments. The microscopic cross sections were evaluated using the pre-stated calculational route at three energy groups spectrum, as in table 7. Comparisons with the reference ANL EPRI-CELL results are presented in tables 9 and 10. The cell constants – diffusion coefficients (D) and absorption MXS (Σa) – of the water and graphite were evaluated at three and five energy groups spectrums, as in table 7, and are presented against the reference ANL EPRI-CELL results in table 11. Table 9: The microscopic absorption and fission cross sections of the U-235 and U-235 isotopes at the 93% enrichment (HEU) [61]. U-235
U-238
Burnup σa σf σa σf Group (%) WIMSD- EPRI- WIMSD- EPRI- WIMSD- EPRI- WIMSD5B CELL 5B CELL 5B CELL 5B 1 1.660 1.727 1.425 1.453 0.333 0.345 0.195 0% 2 38.971 39.236 26.049 25.994 26.551 27.137 0.000 3 428.688 422.841 365.990 360.532 1.795 1.769 0.000 1 1.666 1.727 1.428 1.454 0.332 0.345 0.193 2 39.804 40.263 26.539 26.545 26.679 27.417 0.000 50% 3 468.373 466.486 399.930 398.133 1.940 1.932 0.000
EPRICELL 0.193 0.000 0.000 0.193 0.000 0.000
Table 10: The microscopic absorption and fission cross sections of the U-235 and U-235 isotopes at the 20% enrichment (LEU) [61]. U-235
U-238
Burnup σa σf σa σf Group (%) WIMSD- EPRI- WIMSD- EPRI- WIMSD- EPRI- WIMSD5B CELL 5B CELL 5B CELL 5B 1 1.668 1.729 1.429 1.454 0.331 0.344 0.191 0% 2 37.618 37.845 25.208 25.201 6.317 6.095 0.000 3 401.008 392.606 342.293 334.476 1.693 1.656 0.000 1 1.669 1.730 1.429 1.455 0.331 0.344 0.191 2 38.504 38.968 25.664 25.735 6.376 6.182 0.000 50% 3 437.718 432.191 373.717 368.610 1.828 1.804 0.000
60
EPRICELL 0.191 0.000 0.000 0.191 0.000 0.000
Chapter 5: Results and Discussions
Table 11: The cell constants of the water and graphite reflectors [61]. Water reflector Graphite D Σa D Σa Group WIMSD EPRI WIMSD EPRI WIMSD-5B EPRI-CELL WIMSD-5B EPRI-CELL -5B -CELL -5B -CELL 1 2.091 2.847 5.125E-04 4.361E-04 2.307 2.226 1.170E-04 4.649E-05 2 1.064 0.955 1.110E-05 9.691E-06 1.079 1.027 1.076E-07 0.000E+00 3 0.587 0.584 6.566E-04 6.312E-04 0.873 0.877 7.537E-06 8.239E-06 4 0.446 0.464 3.381E-03 3.459E-03 0.871 0.875 4.399E-05 4.504E-05 5 0.147 0.147 1.871E-02 1.901E-02 0.814 0.842 2.092E-04 2.510E-04
The currently calculated microscopic XS of the U-235 and U-238 isotopes are enrichment and burnup dependant, like the reference ANL results, even it is higher - for the U-235 isotope and 0% burnup - by ~ 1.5% and 2.3 % for the HEU and LEU fuels respectively, which will be reflected on the criticality and neutron flux calculations. Generally, increased burnup results in an increased microscopic XS for both isotopes, mainly due to the softer spectrum that results form the gradually decreasing U-235 content; the thermal flux is gradually increasing by burnup with accompanying increase in the absorption and fission XS of the U-235 and U-238 isotopes. The situation is reversed for the enrichment reduction case, in which the reduced enrichment core has a harder spectrum due to the constant moderating ration and the increased U-235 content, which results in a reduced microscopic XS for the U-235 and U-238 isotopes. The currently calculated cell constants of the water and graphite reflectors show variant levels of deviations as compared to the reference results. The most important, being the absorption MXS of the water reflector at the thermal range which showed a deviation of -1.1% between the current and the reference results. The importance of the light water absorption reactions arises from the considerably high microscopic absorption XS of the bounded hydrogen atoms in the light water molecule as compared to other reflectors such as carbon or heavy water [21], besides, the high thermal flux of the typical MTR thermal research reactors at the water reflector weights its importance. The currently results - based on the MXS for the water reflector - show that the water is a better moderator with a higher MR than the reference results.
61
Chapter 5: Results and Discussions
5.2.1.3 The Infinite Multiplication Factors The infinite multiplication factors (k∞) were evaluated at the five energy groups spectrum for each enrichment case from 0% to 50% burnup and compared with the reference ANL EPRI-CELL results [61], as shown in figure 23. The specific power ratings for each enrichment case are 1386.4, 587.0, and 214.1 MW/Te for the 93%, 45%, and 20% enrichments respectively. Generally, the currently evaluated infinite multiplication factors are higher than that of the reference ANL results, but follow the same descending trend with burn-up. These results are consistent with the previous cell constants and microscopic cross sections evaluations, since the current results yielded higher microscopic fission XS for the U-235 isotopes, and also showed that the water is a better moderator with higher MR. The deviations encountered are 447, 550, and 618 pcm at the 0% burnup for the HEU, MEU, and LEU cases, respectively. Figure 23: The infinite multiplication factors (k∞) vs. percent burnup.
62
Chapter 5: Results and Discussions
5.2.1.4 The Reactivities and the Effective Multiplications Factors The results of the reactivities and reactivities loss are the main parts of the neutronics benchmark studies. The evaluation of the reactivities has been performed by solving for the diffusion theory eigen-values in the 3D space using the deterministic diffusion method, using the multigroup diffusion depletion code CITVAP v3.1. The WIMSD-5B/CITVAP v3.1 deterministic diffusion calculational line has been utilized at a condensation spectrum of five energy groups as stated in table 7. Firstly, the cell calculation steps was performed using the DSN method of the WIMSD-5B lattice calculation code to evaluate the cell constants for all the material within the reactor, followed by preparation of the homogenized and condensed cell constants into MXS libraries. Secondly, the core calculation steps, in which the MXS libraries were utilized in the 3D CITVAP v3.1 multigroup diffusion depletion code for evaluation of the reactivities, where the reactivity is related to the keff as; ρ=
k eff 1 k eff
The current reactivity results were compared with INTERATOM and ANL results of the neutronics benchmark problem [61]. The current reactivity results were evaluated using the 3D representation of the reactor unlike the references, where the reactivities calculations have been performed using the 2D representation - INTERATOM with the MONSTRA/IAMADY and ANL with the EPRI-CELL/DIF2D calculational lines. Table 12 contains the results of the reactivity calculations, which are the effective multiplication factors keff for the three enrichments at different core states and the differences in percent as compared to the reference results of INTERATOM and ANL. Table 13 contains the results of the 3D diffusion calculations with exclusion of the lumped fission products from the calculations - except Xe-135 and Sm-149 isotopes, so as to establish a comparison with the 63
Chapter 5: Results and Discussions
ANL, lumped fission products free, detailed 3D and continuous energy Monte Carlo reactivity results, and in order to make an independent verification of the methods employed and the results obtained, also the table includes the differences between the current and reference ANL Monte Carlo results in terms of the standard deviations. Table 14 contains the fresh cores excess reactivities for the three enrichments and the deviation in the pcm unit for the current calculations as compared to the reference INTERATOM and ANL results. Table 15 contains the reactivities loss by burnup - BOC to EOC which is a 5% burnup step cycle - in terms of Δk and Δρ. Table 16 contains the reactivities differences by enrichment reduction - from HEU 93% to REU 45% and 20% - in terms of Δk. Table 12: The effective multiplication factors - the current WIMSD5B/CITVAP v3.1 and the reference INTERATOM MONSTRA/IAMADY and ANL EPRI-CELL/DIF2D results [61]. Enrichment
93%
45%
20%
a b
Deviation Δkeff a from
keff Core State
Current (WIMS/CIT) b INTERATOM
INTERATOM
ANL
BOC
1.0328
1.0233
1.02957
-0.31%
0.61%
EOC
1.0101
1.0004
1.00656
-0.35%
0.62%
Fresh Fuel
1.1888
1.1834
1.19001
0.10%
0.56%
BOC (Equal MWd)
1.0474
1.0410
1.04684
-0.05%
0.56%
EOC (Equal MWd)
1.0309
1.0238
1.02975
-0.11%
0.58%
BOC (% Burnup)
1.0311
1.0247
1.02987
-0.12%
0.50%
EOC (% Burnup)
1.0108
1.0033
1.00827
-0.25%
0.50%
Fresh Fuel
1.1790
1.1782
1.18441
0.46%
0.53%
BOC (Equal MWd)
1.0599
1.0540
1.06108
0.11%
0.67%
EOC (Equal MWd)
1.0485
1.0419
1.04895
0.04%
0.68%
BOC (% Burnup)
1.0278
1.0213
1.02698
-0.08%
0.56%
EOC (% Burnup)
1.0091
1.0014
1.00670
-0.24%
0.53%
Fresh Fuel
1.1683
1.1683
1.17645
0.70%
0.70%
Deviation = (current results – reference results) / reference results (%). WIMS/CIT stands for the currently WIMSD-5B/CITVAP v3.1 results.
64
ANL
Chapter 5: Results and Discussions
Table 13: The effective multiplication factors - the current WIMSD5B/CITVAP v3.1 and the ANL 2D diffusion and 3D Monte Carlo results [61]. Enrichment
Core State
93%
MONTE CARLO (ANL) DIF2D (ANL)
Current (WIMS/CIT)
keff
±σ b
keff
keff
Rc
Fresh Fuel
1.189
0.0033
1.183 (+1.82)
1.190
-0.30
20%
Fresh Fuel
1.168
0.0033
1.168 (+0.00)
1.176
-2.42
93%*
EOC (% Burnup)
1.045
0.0036
1.034 (+3.06)
1.040
1.39
20%*
EOC (% Burnup)
1.048
0.0034
1.039 (+2.65)
1.044
1.06
20%*
EOC (Equal MWd)
1.072
0.0027
1.068 (+1.48)
1.076
-1.39
a
a
WIMS/CIT stands for the currently WIMSD-5B/CITVAP v3.1 results. The standard deviation of the reference ANL Monte Carlo results. c The deviation in terms of standard deviations = (kMC - kD) / , where kMC and kD are the effective multiplication factors evaluated using the Monte Carlo – reference ANL results – and the current diffusion method, respectively. b
Table 14: The fresh cores excess reactivities for the three enrichments as as compared to the INTERATON and ANL results [61].
a
ρ (pcm)
Enrichment
Core State
93%
Deviation Δ ρ (pcm) a Current From From (WIMS/CIT) INTERATOM ANL
INTERATOM
ANL
Fresh Fuel
15882
15498
15967
86
469
45%
Fresh Fuel
15182
15125
15570
387
445
20%
Fresh Fuel
14406
14406
14999
593
593
Deviation = (current results – reference results).
Table 15: The reactivities loss (Δk and Δρ) by a burnup step of 5% burnup as compared to the INTERATON and ANL results [61]. Enrichment
Equal Burnup INTERATOM
20%
ANL
Current INTERATOM (WIMS/CIT)
ANL
Current (WIMS/CIT)
2.18%
2.24%
2.23%
2175.9
2237.0
2220.3
MWd
1.53%
1.61%
1.63%
1528.1
1613.8
1585.4
%
1.92%
2.08%
2.10%
1947.7
2081.5
2080.1
MWd
1.03%
1.10%
1.14%
1025.8
1101.8
1089.8
%
1.81%
1.94%
1.97%
1803.0
1945.8
1961.6
93% 45%
Δ ρ (pcm)
Δkeff
65
Chapter 5: Results and Discussions
Table 16: Comparison of reactivity differences (Δk) by enrichment reduction as compared to the INTERATON and ANL results [61]. Core State
INTERATOM
ANL
Current (WIMS/CIT)
Enrichment Reduction (93% → 45%) Fresh Fuel BOC EOC
-0.70%
-0.38%
-0.47%
% Burnup
-0.16%
0.13%
0.03%
MWd
1.35%
1.65%
1.68%
% Burnup
0.06%
0.29%
0.17%
MWd
2.00%
2.29%
2.30%
Enrichment Reduction (93% → 20%) -1.47%
-1.09%
-1.14%
% Burnup
-0.47%
-0.20%
-0.25%
MWd
2.48%
2.84%
3.06%
% Burnup
-0.10%
0.10%
0.01%
MWd
3.63%
3.98%
4.21%
Fresh Fuel BOC EOC
From table 12, it is evident that the currently calculated effective multiplication factors using the WIMSD-IAEA-69/WIMSD-5B/CITVAp v3.1 calculational line in the 3D geometry representations, are consistent and in good agreement with the reference INTERATOM MONSTRA/IAMADY and ANL EPRI-CELL/DIF2D results [61]. Generally, the currently evaluated effective multiplication factor are higher than that of ANL with ~ 0.6% and with maximum deviation of 0.7% for the fresh LEU core, and when compared with the INTERATOM results, generally lower deviations were encountered although not at the same trend as that of ANL results, and with a maximum deviation of 0.7% for the fresh LEU core. The comparison of the current deterministic diffusion results and the reference ANL probabilistic Monte Carlo results as presented in table 13, is of a special interest, since it provides an independent verification of the utilized methodology. The calculations were performed by excluding the lumped fission products from the cell calculations, as they were originally excluded from the reference ANL Monte Carlo calculations. The accuracy limit for the
66
Chapter 5: Results and Discussions
effective multiplication factors was limited to three decimal figures for both of the current and the reference ANL calculations. The comparison show lower deviations from the Monte Carlo results in terms of the units of standard deviations, with a maximum deviation of -2.42 for the LEU fresh core. Generally, the current results are more close to the ANL Monte Carlo results than that of the ANL 2D diffusion calculations. The comparison of the fresh cores excess reactivities between the current and the reference ANL and INTERATOM results as shown in table 14, show good agreements with acceptable differences in pcm units. The maximum deviation encountered with the ANL DIF2D results is 593 pcm for the LEU fresh core, and for the INTERATOM IAMADY results, the deviation rises from 86 pcm to 593 pcm from the HEU to LEU fresh cores. Finally, the comparisons between the current 3D diffusion theory eigenvalues solutions and the references ANL and INTERATOM 2D diffusion results through comparing the reactivity loss upon completion of a 5% burnup cycle - and the reactivities differences upon enrichment reductions as presented in tables 15 and 16 respectively, show high consistency and agreement. For the first comparison, the maximum encountered difference is for the 45% enrichment at equal percent burnup of 28.4 pcm between the current the reference ANL results, and 132.4 pcm for the INTERATOM comparison at 45% and equal MWD burnup. The currently higher reactivities results as compared to the reference ANL results are predictable and consistent with the previous cell calculations and the infinite multiplication factor values. Similar to the infinite multiplication factors, the reactivities and the effective multiplication factors are higher than the reference ANL results, since the cell calculations yielded higher microscopic fission XS for the U-235 isotope, and lower macroscopic absorption XS for the water reflector, and in this case the reflector water is a better moderator. 67
Chapter 5: Results and Discussions
5.2.1.5 The Neutron Flux Distributions The second main part of the neutronics benchmark studies is the neutron flux eigen-value problems. The neutron flux distributions are evaluated by solving the neutron flux eigen-value problem using multigroup diffusion depletion code CITVAP v3.1, and using the 3D representation of the core. The neutron flux distributions have been performed for the full core with a normalized power of 10 MW. The average fluxes are the zone averaged fluxed allover the 60 cm active length of the core. The center average flux is the axial flux in the middle of the flux trap averaged over allover the 60 cm active length of the core. the center midplane flux is the flux at the midpoint of the flux trap midplane, which is typically the maximum flux in the flux trap axial cosine shape flux distribution. The calculations have been performed using the five energy groups condensation spectrum as stated in table 7. The notations Φ1 or group 1 refer to the flux from 5.531 KeV to 10 MeV, Φ2 or group 2 refers to the flux from 0.625 eV to 5.531 keV, Φf refers to the flux above 0.625 eV, and Φth or group 3 refers to the flux below 0.625 eV. Table 17 contains the average thermal flux in the flux trap - active length of 60 cm, and in the fueled regions - the fuel containing regions of the SFE and CFE, also the axial centerline average flux of the flux trap - irradiation channel - and the midpoint flux of the flux trap midplane. The percent deviations from the reference ANL 2D results using the DIF2D code are presented in parenthesis. Table 18 contains the currently evaluated neutron fluxes reductions in the flux trap upon enrichment reduction - at equal percent burnup - along with the deviation in percent from the reference ANL DIF2D results [61].
68
Chapter 5: Results and Discussions
Table 17: The current CITVAP v3.1 results of the neutron flux problems and the deviations from the reference ANL DIF2D results [61]. a Core Core State b
Flux Trap
Average Flux
Average Flux
th
th
93% BOC 6.3150E+13 (-0.23) 93% EOC 6.7355E+13 (-0.05) 45% BOC 5.4930E+13 (-0.29) 45% EOC 5.8328E+13 (-0.10) 20% BOC 4.4586E+13 (-0.30) 20% EOC 4.7019E+13 (-0.06) a b
Center Average
Center Midplane
th
2.1833E+14 (+2.29) 2.2528E+14 (+2.40) 2.0861E+14 (+2.56) 2.1478E+14 (+2.69) 1.9561E+14 (+2.86) 2.0089E+14 (+3.03)
th
2.8538E+14 (+3.71) 2.9208E+14 (+3.82) 2.7865E+14 (+4.00) 2.8481E+14 (+4.13) 2.6955E+14 (+4.26) 2.7519E+14 (+4.43)
3.7073E+14 (+2.75) 3.7956E+14 (+2.90) 3.6135E+14 (+2.86) 3.6942E+14 (+3.02) 3.4873E+14 (+2.88) 3.5607E+14 (+3.06)
Deviation = (current results – reference results) / reference results (%). Equal percent burnup for the REU cases.
Table 18: The neutron flux differences in the flux trap and the core upon enrichments reduction and the deviations from the reference ANL DIF2D results [61]. a Core Enrichment Reduction b
Core State
Average Flux
Flux Trap Average Flux Center Average
th
45% BOC 93% → 45% 45% EOL 20% BOC 93% → 20% 20% EOL a b
th
-13.02% (+0.42) -4.45% (-5.36) -13.40% (+0.31) -4.66% (-5.43) -29.40% (+0.16) -10.40% (-4.60) -30.19% (+0.02) -10.82% (-4.80)
th
-2.36% (-10.46) -2.49% (-10.31) -5.55% ( -8.34) -5.78% ( -8.61)
Center Midplane th
-2.53% (-4.00) -2.67% (-3.80) -5.93% (-1.95) -6.19% (-2.21)
Deviation = (current results – reference results) / reference results (%). Equal percent burnup for the REU cases.
Figures 24, 25, and 26 are the midplane neutron flux ratios - with no axial flux averaging - along the X-Axis for the selected flux ratios: ϕf20/ ϕf93, ϕth45/ ϕth93, and ϕth20/ ϕth93 - at the BOC with Xenon-equilibrium for both of the equal percent and equal MWd burnup core states. The comparisons were established with the results of all the research centers - ANL, INTERATOM, ӦSGAE, CEA, EIR, CNEA, and JAERI [61].The core burn up states of equal percent burn are presented by all the contributors, while the equal MWd burnup core states are presented by the reference ANL and INTERATON, and the current 3D CITVAP v3.1 results only. Because of the flux symmetry around the center of the core, the distributions are all limited to half the core only.
69
Chapter 5: Results and Discussions
Figures 27, 28, 29, and 30 are the midplane neutron flux distributions along the X-axis and Y-axis for the 93% enrichment case at the BOC and EOL states. Figures 31, 32, 33, and 34 are the midplane neutron flux ratios along the XAxis and Y-Axis for the 45% enrichment case at the BOC and EOL states and for equal MWd burn up, also figures 35, 36, 37, and 38 are the corresponding midplane neutron flux ratios for the 20% enrichment case. The results are only superimposed on the flux distributions of the reference ANL DIF2D results [61] for the representations clarity. The fluxes are plotted in three groups along the X- and Y-axis, and also here the midplane fluxes are plotted with no axial averaging over the Z-axis. The results of the neutron flux problem as presented in tables 17 are concerned only with the thermal flux and its distribution in the flux trap and the fueled regions of the core, and generally, the current calculations yielded higher flux in the flux trap for all enrichments, but consistent with the reference Figure 24: The BOC midplane flux ratios ϕf20/ ϕf93 along the X-Axis.
70
Chapter 5: Results and Discussions
Figure 25: The BOC midplane flux ratios ϕth20/ ϕth93 along the X-Axis.
Figure 26: The BOC midplane flux ratios ϕth45/ ϕth93 along the X-Axis.
71
Chapter 5: Results and Discussions
ANL DIF2D results with max. deviations of 3.03%, 4.43%, and 3.06 for the flux trap average flux, average centerline flux, and max. midplane flux for the LEU core at the EOC, moreover, the current calculations yielded nearly the same thermal flux in the core fueled regions. The currently higher values of the thermal flux in the flux trap as compared to the ref. ANL results are consistent with the previous results of the cell constants, in which the water possess lower macroscopic absorption XS as compared with the ref. ANL results, and thus the water is a better moderator and tends to pile the neutron flux at the thermal range, also the higher microscopic fission XS for the U-235 isotope tends to depress the thermal flux in the fueled regions and enlarges the fast flux, in other words, yields a harder flux in the fueled regions, with accompanying higher leakage of neutrons from the core into the reflectors and the flux trap. The current calculations yielded lower neutron flux loss at the flux trap upon enrichment reduction as shown in table 18, but still consistent with the reference ANL DIF2D results with maximum deviations of -5.43% and -4.80% for the 45% and 20% enrichments, respectively. From figures 24, 25, and 26, it is shown that the common trend form the current and the reference results upon enrichment reduction to REU fuels is an accompanying reduction in the central flux trap that can reach values for the thermal flux as high as 6% and 7% for the 20% enrichment case for equal percent and MWD burnup respectively. For the current CITVAP v3.1 results, it is shown that the plotted thermal and fast flux ratios for the REU enrichments are consistent to a satisfactory level with all the results of the references [61], specially with the INTERATOM results at equal percent and MWD burup. The flux ratios matching is observed allover the flux trap, core fueled region, and in the radial water reflector region. These reductions in thermal flux upon conversion are predictable, since the reactor is under-moderated - U-235 to H ration, and the conversion yields highly undermoderated cores with the accompanying loss in the flux and reactivity, which is evident for the fresh cores, and to a greater extent for the equal MWD cores - in which the burned U-235 is lower than that of the equal percent burnup.
72
Chapter 5: Results and Discussions
Figure 27: The 93% enrichment midplane flux at BOC along the X-Axis.
Figure 28: The 93% enrichment midplane flux at EOL along the X-Axis.
73
Chapter 5: Results and Discussions
Figure 29: The 93% enrichment midplane flux at BOC along the Y-Axis.
Figure 30: The 93% enrichment midplane flux at EOL along the Y-Axis.
74
Chapter 5: Results and Discussions
Figure 31: The midplane flux ratios ϕ45%/ ϕ93% at BOC along the X-Axis.
Figure 32: The midplane flux ratios ϕ45%/ ϕ93% at EOL along the X-Axis.
75
Chapter 5: Results and Discussions
Figure 33: The midplane flux ratios ϕ45%/ ϕ93% at BOC along the Y-Axis.
Figure 34: The midplane flux ratios ϕ45%/ ϕ93% at EOL along the Y-Axis.
76
Chapter 5: Results and Discussions
Figure 35: The midplane flux ratios ϕ20%/ ϕ93% at BOC along the X-Axis.
Figure 36: The midplane flux ratios ϕ20%/ ϕ93% at EOL along the X-Axis.
77
Chapter 5: Results and Discussions
Figure 37: The midplane flux ratios ϕ20%/ ϕ93% at BOC along the Y-Axis.
Figure 38: The midplane flux ratios ϕ20%/ ϕ93% at EOL along the Y-Axis.
78
Chapter 5: Results and Discussions
The results of the neutron flux eigen-values problems are presented in the figures 24, 25, and 26, which are comparisons of the flux distributions between the current 3D diffusion calculations using the CITVAP v3.1 code and the ref. 2D diffusion results of ANL using the DIF2D code [61]. Generally, the current CITVAP v3.1 results of the neutron flux distributions and the average fluxes when compared with the ref. ANL DIF2D results, are considered to be in line and greatly consistent with the ref. results. The 93% enrichment thermal flux distributions show close matching in the fueled regions, while in the flux trap and water reflector regions the current results are around ~ 3-4% higher than that of the ref. ANL results, also the case is reversed for the fast and epithermal groups which are lower by the same percents in the flux trap and water reflector area. For the radial reflector regions, and similar to the water filled flux trap; the currently evaluated thermal neutron flux is higher than that of the ref. ANL results by the same percent - Xaxis, while the thermal flux in the graphite reflector is nearly the same. The 45% and 20% to 93% enrichment neutron flux ratios show lower predicted ratios for the fast flux ~ 1%, matching flux ratios for the epithermal flux, allover the flux trap, core region, and radial water reflector region. The resulted thermal flux ratios are variant, but still consistent with the ref. ANL DIF2D fluxes, with sharper variations spatially, almost, due to the finer mesh size utilized in the current CITVAP v3.1 calculations. Moreover, all the flux ratios goes to close matching at the reflectors region.
79
Chapter 5: Results and Discussions
5.2.2 The Safety Related Benchmark Calculations The second part of the benchmark calculations is the safety related benchmark calculations of an idealized light water, pool-type reactor, in which comparative studies of the safety related parameters: reactivity feedback coefficients, power peaking factors, and the control rod worths are established for assessment of the current computational method using the WIMSD5B/CITVAP v3.1 calculational line and the WIMSD-IAEA-69 nuclear data library. Comparisons were established with the references: ANL EPRI-CELL/ DIF2D results, FRG MONSTRA/ IAMADY results, and EIR WIMS-D1/ CODIFF results [62][63].
5.2.2.1 Isothermal Reactivity Feedback Coefficients The isothermal reactivity feedback coefficients were calculated for the three physical parameters: water temperature only, water density only, and fuel temperature only, and for the three enrichments; 93%, 45%, and 20%. The calculations were performed at the equal percent BOC core states. Firstly for the water temperature reactivity coefficients, the excess reactivities were calculated at the water temperatures: 20 °C, 38 °C, 50 °C, 75 °C, and 100 °C at a constant water density of 1.0 gm/cm3. The calculational procedure is direct, in which the cross sections of the water in the SFE and CFE fuel elements are evaluated at the specified water temperatures at the burnup: 45%, 25%, and 5%. Secondly for the water density and the whole-core void reactivity coefficients, the excess reactivities were calculated at the water densities: 1.0, 0.9982, 0.993, 0.988, 0.975, and 0.958 g/cm3, which correspond to water temperatures of: 4 °C, 20 °C, 38 °C, 50 °C, 75 °C, and 100 °C, and at 0.9 and 0.8 g/cm3, which correspond to void conditions. The cross sections of the water in the SFE and CFE fuel elements were evaluated at the specified water densities at the burnup: 45%, 25%, and 5%. In order to give the effect of
80
Chapter 5: Results and Discussions
water density only, the calculations were done at a constant water temperature of 23 °C, even each water density corresponds to a different temperature. Thirdly for the fuel temperature reactivity coefficients, the excess reactivities were calculated at the fuel temperatures: 20 °C, 38 °C, 50 °C, 75 °C, 100 °C, and 200 °C. The cross sections of the fueled regions of the SFE and CFE fuel elements are evaluated at the specified fuel temperatures at the burnup: 45%, 25%, and 5%. Figures 39, 41, 42, and 43 show the reactivity differences as compared to the reference state of water or fuel temperature of 20 °C for the change in water temperature only, water temperature and density, whole-core void, and fuel temperature respectively for the HEU, MEU, and LEU cores. Figure 35 show the reactivity differences as compared to the reference state of water density of 1.0 g/cm3 - equivalent to 4 °C - for the change in water density only. Table 19 presents the water temperature only, water density only, whole-core void, water temperature and density, and fuel temperature average values of the isothermal reactivity feedback coefficients of the HEU and LEU cores and the reference ANL, INTERATON, and EIR results. For the water density reactivity coefficients, the resultant relations are not linear, as the results are plotted against the equivalent temperature, and the dependence of the water density on temperature is not linear. This is clear on the whole-core void reactivity coefficients which are plotted against void percentage and are linear in the rang (0-10% void). It is evident from figures 39, 40, 41, 42 and 43 that the main reactivity feedback physical parameters for the HEU cores are the water temp. and density, and such core exhibit very low fuel - ~ zero - temp. reactivity coefficient, in fact the reactivity difference of the HEU cores were stated and compared with the references instead of the reactivity coefficients for clearance of the results, as in table 19. The main cause of the low Doppler effect for the HEU core is the small amount of the resonance absorber U-238 as compared to
81
Chapter 5: Results and Discussions
Table 19: Isothermal reactivity coefficients [62]. Temperature Range
Fuel
Reactivity Coefficient α
Δ αANLa
Δ αINTERATOM
Δ αEIR
Water Temperature Only (α Tw) 20-38 °C (-Δ ρ /C° x105)
HEU
12.13
1.96%
16.67%
1.11%
LEU
8.36
1.90%
5.77%
-1.70%
38-50 °C (-Δ ρ /C° x105)
HEU
11.66
-2.03%
7.95%
0.50%
LEU
7.99
-1.34%
3.79%
-2.54%
50-100 °C (-Δ ρ /C° x105)
HEU
11.16
-3.76%
-2.07%
-0.32%
LEU
7.61
-2.44%
1.47%
-2.44%
Water Density Only ( α Dw) 20-38 °C (-Δ ρ /C° x105)
HEU
5.87
-17.29%
-13.64%
-19.56%
LEU
7.39
-10.98%
-6.47%
-13.07%
38-50 °C (-Δ ρ /C° x105)
HEU
8.87
-14.74%
-11.33%
-14.74%
LEU
10.91
-11.31%
-2.60%
-6.77%
50-100 °C (-Δ ρ /C° x105)
HEU
14.11
-10.11%
-2.68%
-11.25%
LEU
16.21
-12.84%
-5.19%
-10.43%
0.998-0.958 g/cm3 (-Δ ρ /Δ ρ w)
HEU
0.23
-11.08%
-4.01%
-12.10%
LEU
0.27
-11.93%
-4.06%
-10.16%
3
HEU
0.24
-20.04%
-14.86%
-21.10%
LEU
0.30
-13.72%
-6.08%
-11.93%
Density Range
0.958-0.900 g/cm (-Δ ρ /Δ ρ w)
Water Temperature and Density ( α Tw + α Dw) 20-38 °C (-Δ ρ /C° x105)
HEU
18.01
-5.23%
4.68%
-6.71%
LEU
15.74
-4.58%
-0.35%
-7.39%
38-50 °C (-Δ ρ /C° x105)
HEU
20.53
-7.96%
-1.32%
-6.70%
LEU
18.90
-7.35%
0.00%
-5.03%
50-100 °C (-Δ ρ /C° x105)
HEU
25.28
-7.41%
-2.41%
-6.73%
LEU
23.82
-9.77%
-3.16%
-8.02%
Fuel Temperature Only ( α Tf) 5
20-38 C°
(-Δ ρ x10 ) 5
(-Δ ρ /C° x10 ) 5
38-50 C°
(-Δ ρ x10 ) 5
(-Δ ρ /C° x10 ) 5
50-100 C° a b
(-Δ ρ x10 ) 5
(-Δ ρ /C° x10 )
HEU
1.62
0.6 b
0.8
1.3
LEU
2.59
-1.35%
18.47%
9.47%
HEU
1.00
0.3
0.5
0.8
LEU
2.52
-2.13%
16.36%
16.90%
HEU
3.74
2.0
1.6
2.7
LEU
2.45
-2.70%
15.66%
11.96%
Δ αReference = ((current results – reference results) / reference results) (%). Δ α = (current results – reference results) (pcm).
82
Chapter 5: Results and Discussions
Figure 39: Isothermal reactivity feedback for changes in water temp. only.
Figure 40: Isothermal reactivity feedback for changes in water density only.
83
Chapter 5: Results and Discussions
Figure 41: Isothermal reactivity feedback for changes in the whole core void fraction only.
Figure 42: Isothermal reactivity feedback for changes in water temp. and density.
84
Chapter 5: Results and Discussions
Figure 43: Isothermal reactivity feedback for changes in fuel temp. only.
the MEU and LEU cores. This increased Doppler effect in the REU cores represents a benefit in converting cores from HEU to REU fuels, as the Doppler effect reactivity feedback is prompt as compared to the delayed water temp. and density reactivity feedbacks, also upon power rise, the temp. differences in the fuel meat greatly exceeds that of the water moderator which is reflected in greater reduction in the reactivity. Moreover, table 19 show that upon conversion form 93% HEU core to 20% LEU core, the water temp. only, water density only, water temp. and density, and whole-core void reactivity feedback coefficients are varied by: -31.8%, 14.9%, 25.3%, and -5.8% respectively, with respect to the HEU core results, which is shown also in the correspondding figures. Unlike the fuel temp. reactivity coefficient, the LEU cores exhibit lower combined water temp. and density reactivity coefficient. Another favored parameters for the LEU cores besides the high fuel temp. reactivity coefficient is the whole-core void coefficient, which increased by ~25%.
85
Chapter 5: Results and Discussions
As shown in table 19, the current results as compared to the ANL results exhibit close matching for the fuel temp. and water temp. reactivity coefficients, with max. deviations encountered of -2.7% and -2.4% respectively for the LEU core in the temp. range (50-100 °C). For the water density reactivity coefficients, the current results are lower than that of ANL by percentages as high as -17.3% for the water density reactivity coefficient for the HEU core at the temp. range of (20-38 C°) and -20.0% for the whole-core void reactivity coefficient for the HEU core at the void range of (4.2%-10%). As a consequence of the high discrepancies in the water density reactivity coefficients the combined water temp. and density showed also high deviation, although not as high as that of the water density effect only. Based on the deviations encountered, the comparison of the water density reactivity coefficients with the references showed that the current results are closet to that of the INTERATOM with a max. deviation of 4.7% for the HEU core at the temp. range of (20-38 C°). The previously mentioned discrepancies in the water density reactivity coefficients which are in a part due to the difference in the reference state - currently 1.0 g/cm3 as compared to 0.9982 g/cm3 for the ANL - and the nonlinearity for the dependence of the reactivity on the water density, shall be carefully considered when comparing realistic cores results with ANL results using the same calculational method. Upon enrichment reduction, the water temp. reactivity coefficient is reduced mainly due to the in-core harder spectrum in the LEU core, in which the incore thermal flux is lower and consequently the variation in the absorption reaction rate due to the change in water temp. is lower. Also, the water density reactivity coefficient is higher due to the highly under moderated LEU cores, which brings more reactivity reductions upon water density decrease, and the combined water temp. and density is balanced by the two opposing effects. Also, the fuel temperature reactivity coefficient is higher due to the increased U-238 content, which is the main source of the Doppler effect.
86
Chapter 5: Results and Discussions
5.2.2.2 The Power defect of Reactivity The power defect of reactivity is an important reactor safety parameter, which is defined as the total of all reactivity effects induced by bringing the reactor (at full flow) from cold zero-power conditions to normal full-power operating conditions [62]. The parameter is also referred as the cold-to-hot reactivity swing and is defined as following;
power ( T w Dw ) T w T f T f where, αTw, αDw, and αTf are the corresponding reactivity feedback coefficients and ΔTw and ΔTf are the mean temperature differences in the water and in the fuel from cold zero-power conditions to normal operating conditions. The power defect of reactivity parameter was calculated for the HEU and LEU cores from the steady state thermal-hydraulic data for the average channel in the 10 MW benchmark reactor [62], with an inlet temperature of 38 °C and a flow rate of 1000 m3/h, the mean temperature differences between zero power and full power would be about 4.5 °C in the water and about 16.8 °C in the fuel meat. The results of the power defect of reactivity calculations in the 38-50 °C temperature range using the corresponding isothermal reactivity feedback coefficients are presented in table 20. The reactivity differences are in listed in the Δρ x103 and the ¢ units, and the ¢ units were evaluated based on the average effective delayed neutron fraction βeff of the ANL and INTERATOM reference results: 0.00761 and 0.00730 for the HEU and LEU cores respectively.
87
Chapter 5: Results and Discussions
Table 20: The power defect of reactivity for the HEU and LEU cores [62]. Effect
Fuel
Reactivity Difference
Δ ρ ANLa
Δ ρINTERATOM
Δ ρ EIR
Water Temp. + Density
HEU LEU HEU LEU HEU LEU HEU LEU
0.924 0.851 0.014 0.423 0.938 1.274 12.32 17.45
-7.97% -7.30% -2.31% -7.40% -5.70% -7.37% -6.18%
-1.28% 0.00% 15.89% -0.53% 4.77% -0.65% 5.12%
-6.67% -5.44% 16.53% -5.54% 0.87% -3.75% 1.45%
Fuel Temp.
Δρ power, x103 Δρ power, ¢ a
Δ ρ Reference = ((current results – reference results) / reference results) (%).
5.2.2.3 The Radial and Local Power Peaking Factors The radial, local, and total power peaking factors of the HEU BOC core were calculated using the 3D WIMSD-5B/CITVAP v3.1 calculational line and the WLUP-69 nuclear data library at the five energy groups spectrum. The calculations were performed by replacing SFE or CFE fuel elements equilibrium concentrations of Xe-135, Sm-149, and LFPs - with fresh SFE or CFE fuel elements - no Xe-135, no Sm-149, and no lumped fission products. The calculations were performed with insertion of a fresh fuel element in the equilibrium core, which result in the highest power peaking to be located at the fresh element, which represent the normal fuel shuffling conditions. For the current calculations, the axial power peaking factor for the completely withdrawn control rods were considered to be constant. “The radial power peaking factor is defined as the ratio of the average midplane power in a specific element to the average midplane power in all fuel elements. The local power peaking factor is defined as the ratio of the maximum midplane power to the average midplane power in the specific element” [63]. The total power peaking factor is the multiplication of the radial and local power peaking factors. The power peaking factors were computed by assigning separate fueled and non-fueled regions. The assigned mesh size for the SFE is 8 x 10 mesh in the 88
Chapter 5: Results and Discussions
6.3 x 8.1 cm2 fueled region, and for the CFE is 8 x 6 mesh in the 6.3 x 5.95 cm2 fueled region. The results are based on the power at the edge of the mesh interval with highest power rather than the power at the center of the mesh interval with highest power, which is always higher than that of the mesh center calculations, and also the local power highly less selective to the selected mesh size [63]. The mesh edge power was evaluated by comparing the thermal flux at the mesh edge to the thermal flux at the mesh center. Through extrapolation, the thermal flux can be generated as a continuous function in space, and then the thermal flux dependent power can be evaluated at the mesh edge from the mesh center power. From table 21, the currently evaluated power peaking factors using the proposed calculational line are in good agreement with the reference ANL DIF2D and INTERATOM IAMADY results with maximum deviations with the first reference of 3.5% for the LEU SFE-1 in the HEU core, and with the second reference of 4.5 for the HEU SFE-1 in the HEU core. Similar to the ANL results, the total power peaking factors were encountered with the CFE-1 rather that the SFE-1, mainly for the increased water volume fraction and the same U-235 loading per fuel plate. Also, the largest power peaking factor was obtained when a fresh LEU CFE-1 was placed in the HEU equilibrium core, mainly due to the higher fissile content of the LEU fuel elements. Table 21: The radial, local and total PPFs for the HEU core [62]. Fresh Element None a CFE-1 b SFE-1 b None CFE-1 SFE-1
Radial Local Total Power Peaking Factor Power Peaking Factor Power Peaking Factor (ΔANL) (ΔINTERATOM) c (ΔANL) (ΔINTERATOM) (ΔANL) (ΔINTERATOM) HEU Core (HEU Fuel Elements Substitution) 1.023 (+0.25%) (-0.82%) 1.459 (+1.65%) (-3.27%) 1.492 (+1.89%) (-4.07%) 1.320 (-2.78%) (-0.50%) 1.348 (+0.88%) (+4.07%) 1.779 (-1.91%) (+3.57%) 1.113 (+0.29%) (-0.79%) 1.450 (+1.27%) (-3.70%) 1.614 (+1.53%) (-4.48%) HEU Core (LEU Fuel Elements Substitution) 1.023 (+0.25%) (-0.82%) 1.459 (+1.65%) (-3.27%) 1.492 (+1.89%) (-4.07%) 1.451 (-2.67%) (-2.73%) 1.477 (+1.94%) (+4.24%) 2.144 (-0.76%) (+1.40%) 1.216 (+0.56%) (-3.13%) 1.594 (+2.97%) (-0.19%) 1.938 (+3.52%) (-3.30%)
a
Equilibrium core with the SFE-1 limiting element of 5% burnup. Equilibrium core with fresh fuel elements substituted in the CFE-1 and SFE-1. c ΔReference = (current results – reference results) / reference results (%). b
89
Chapter 5: Results and Discussions
5.2.2.4 The Worth of the Control Rods 5.2.2.4.1 The Fully-Inserted Control Rods The worths of four fully inserted Ag/In/Cd absorber, B4C absorber, and Hf absorber control rods of the fork type as specified in chapter three were computed for the fresh and BOC equilibrium cores, and for the HEU and LEU enrichments only. The calculations were performed in the 3-D geometry of the CITVAP v3.1 core calculations code using the macroscopic cross-sections libraries evaluated using the WIMSD-5B code and the discrete ordinate method DSN as the main calculations routine in the five energy groups condensation spectrum as specified in table 7. The calculations are direct, in which the control rods blades are inserted in the water gap between the first and third and the 21st and 23rd plates of the four control fuel elements CFE, and were represented as distinct zone in the core calculations steps with no homogenization with neighbor structural aluminum or water moderator. The evaluated reactivities at the fully withdrawn and the fully inserted control rods positions, and consequently the control rods worths were compared with the reference 2-D diffusion results of the ANL and the INTERATOM research centers - using five energy groups spectrum, and with the continuous energy 3-D Monte Carlo results of the ANL. The currently evaluated worths of the control rods for the fresh and the BOC equilibrium cores are presented in tables 22 and 23 along with the percent deviation from the reference ANL and INTERATOM results. From tables 22 and 23, it is evident that the currently calculated control rods worths are in good agreement with the reference ANL and INTERATOM results. Form the tables, it is shown that the control rods effectiveness for the HEU cores are higher than that of the LEU cores, which is more clear at the BOC cores. The cause of such unfavorable reduction in the worths of the
90
Chapter 5: Results and Discussions
control rods upon conversion from the HEU to LEU cores is mainly due to the great reduction in the thermal flux in the core active regions and the very close non-active regions - section 5.2.1.5 - which results in a total reduction of the absorption reactions rate in the control rods zones, and hence introduce less negative reactivities. The effect of these unfavorable reductions is reduced by the fact that the LEU fresh and BOC equilibrium cores excess reactivities are lower that that of the HEU core - tables 22 and 23 and also section 5.2.1.4, but the safety parameter and the absolute sub-criticality are still in favor of the HEU cores. The same reasoning holds true for the differences in the effectiveness of the CRs between the fresh cores and the BOC cores, which are mainly due to the gradually increasing thermal flux in the core fueled regions by burnup, which gradually rises the CRs effectiveness as evident in tables 22 and 23. Unlike the HEU-LEU conversion, in which the reduction in the CRs effectiveness is partially compensated by corresponding reduction in the reactivities, the fresh cores place the greatest limits on the CRs effectiveness, as in fact, the fresh cores possess higher reactivities as compared to burned cores. From tables 22 and 23, it is shown that the most effective control rod absorber material is the boron carbide, which yielded the highest worths and also the highest absolute subcriticality. Also the current calculations show that for the hypothetical HEU and LEU fresh cores, the fully inserted Ag/In/Cd and the Hf absorber eight blades could not bring the reactor sub-critical, and only the boron carbide could introduce sub-criticalities of 2270 pcm and 1170 pcm for the HEU and LEU cores respectively. The boron carbide control rod losses relatively higher percentage of its worth upon enrichment reduction as compared to the Ag/In/Cd control rod, as it is grey at the epithermal range as compared to the epithermal absorbers: Ag and In. Generally the differences between the current and the references are attributed to the differences in the basic nuclear data sets and the differences in the neutron flux distributions.
91
Chapter 5: Results and Discussions
Table 22: The worths of the control rods for the fresh cores at the HEU and LEU enrichments. Enrichment
HEU
LEU
Absorber
keff
ρ (pcm)
Δρ %
$
b
Δρ
a
Δρ
c
Δρ
c
ANL-MC
ANL-D
INTERATOM
None
1.18851
15861.1
-
-
-
-
-
Ag/In/Cd
1.02600
2534.3
13.33
17.52
-0.8%
2.8%
0.2%
B4C
0.97777
-2273.4
18.13
23.83
7.8%
6.7%
-
Hf
1.03209
3109.7
12.75
16.76
0.4%
1.3%
-
None
1.17439
14849.3
-
-
-
-
-
Ag/In/Cd
1.02707
2635.2
12.21
16.78
8.7%
5.9%
4.4%
B4C
0.98846
-1167.3
16.02
22.02
5.4%
7.1%
-
Hf
1.03791
3652.7
11.20
15.40
1.1%
0.0%
-
a
Δ ρ Reference = (current results – reference results) / reference results (%). $ is the reactivity difference in the dollar units, where the effective delayed neutron fractions; βHEU = 0.007607 and βLEU = 0.007275 [63].
b
Table 23: The worths of the control rods for the BOC equilibrium cores at the HEU and LEU enrichments. Enrichment
HEU
LEU
a
Absorber
keff
ρ (pcm)
None
1.02845
Ag/In/Cd
Δρ
Δρ
Δρ
Δρ
ANL-D
INTERATOM
%
$
ANL-MC
2766.2
-
-
-
-
-
0.88083
-13528.7
16.29
21.41
-
-4.3%
-3.6%
B4C
0.83228
-20152.2
22.92
30.13
-
5.4%
7.6%
Hf
0.88169
-13418.7
16.18
21.27
-
-1.3%
-
None
1.02508
2446.6
-
-
-
Ag/In/Cd
0.89163
-12153.8
14.60
20.07
-
0.9%
2.8%
B4C
0.85444
-17035.7
19.48
26.78
-
3.0%
6.5%
Hf
0.89916
-11215.3
13.66
18.78
-
-2.2%
-
Δ ρ Reference = (current results – reference results) / reference results (%).
92
Chapter 5: Results and Discussions
5.2.2.4.2 The Partially-Inserted Control Rods The reactivities of the HEU and LEU BOC cores were evaluated at various control rods positions - AG/In/Cd - ranging from fully inserted to fully withdrawn positions. From the reactivities results, the differential and the integral control rods worth were evaluated and compared with the reported ANL 3D diffusion results as shown in figures 44 and 45. One of the major aspects of benchmarking processes is evident in figures 44 and 45 and tables 22 and 23. The current values of the CRs worth are lower and slightly higher as compared with reference ANL 2-D results for the HEU and LEU cores respectively, and for the AG/In/Cd control rod, while they are higher as compared with the ANL 3-D result. These results reflected the effect of the different modeling methods, which is a parameter that necessitated the benchmarking process. Figure 44: The differential control rods worth for the BOC equilibrium core as compared to the ANL results [63].
93
Chapter 5: Results and Discussions
Figure 45: The integral control rods worth for the BOC equilibrium core as compared to the ANL results [63].
5.2.3 The Integral Parameters of TRX and BAPL Benchmark Lattices The third part of the benchmark studies is the evaluation of the integral parameters of the TRX and BAPL thermal benchmark lattices of the Bettis atomic power laboratory [10], which were evaluated using the discrete ordinate method (DSN) of the WIMSD-5B lattice calculations code and the WIMSDIAEA-69 nuclear data library at the five and seven energy groups condensation spectra as stated in table 7, and the results are presented in table 24. The table also presents the reference results: the experimental results of the CSEWG [10], the continuous energy Monte Carlo MCNP results using the CENDL-3.0 evaluated nuclear data library [27], and the WIMSD-5B results using a 69group cross-section library generated from the JEFF-3.1.1 evaluated nuclear data library [64]. The deviations of the current results from the reference 94
Chapter 5: Results and Discussions
experimental values are expressed in the percent differences as compared to the experimental values, and are given in parenthesis accompanying each value. The reaction rates and the macroscopic cross sections of the U-235 and U238 isotopes are edited into two groups: an epithermal and thermal group with the energy ranges: 10MeV > Eepithermal > 0.625 eV and 0.625 eV > Ethermal > 0.0 eV respectively. The specification of the calculated integral parameters [51]; keff = The finite medium effective multiplication factor ρ238 = Ratio of epithermal to thermal U-238 capture reaction rate;
238
(c )
238
epith
238
(c )th
(a f
238
238
)epith (a f )th
235 = Ratio of epithermal to thermal U-235 fission reaction rate;
235
( f
235
235
)epith ( f )th
238 = Ratio of U-238 fission to U-235 fission reaction rate;
238
(t f
)
238
(tf )
235
C* = Ratio of U-238 capture to U-235 fission reaction rate;
C
*
238 (t ) c
(tf )
235
(t t a f
)
238
(tf )
235
Generally, the currently evaluated effective multiplication factors using the WIMSD-5B code and the WIMSD-IAEA-69 nuclear data library at the five and seven energy groups spectra show good agreement with the experimental results, albeit better accuracies are encountered with the seven energy groups results, and the maximum errors encountered are 0.91% for the TRX-2 and 0.52% for the TRX-1 which correspond to 898 pcm and 527 pcm for the five and seven energy groups respectively. The five energy groups calculations yielded higher reactivities as compared to the seven energy groups calculations, which will be reflected on the corresponding reactivities of the TRIGA cores, as to be shown in the next section. For the remaining integral parameters, the five and seven energy groups calculations show nearly the same trend and
95
Chapter 5: Results and Discussions
fairly good agreements with the experimental results. Generally, no major differences were encountered, and the sources of the differences between the current and the reference results are the differences in the basic nuclear data sets used, the condensed energy spectra calculations as compared to full spectral calculations of the references, and the different solution technique for the different numerical codes used. Table 24: The Integral Parameters of the TRX and BAPL benchmark lattices. Lattice TRX-1 UMe
Integral Experimental Parameter [10] a
UMe
UO2
1.3200 (1.60) 1.3608 (+3.09) 1.3285 (+0.64) 1.3422 (+1.68) 1.3436 (+1.79)
25
0.0987 (1.00) 0.0980 (-0.71) 0.0975 (-1.21) 0.0970 (-1.75) 0.0969 (-1.80)
28
0.0946 (4.30) 0.0962 (+1.69) 0.0915 (-3.27) 0.0990 (+4.69) 0.1009 (+6.70)
*
0.7970 (1.00) 0.7922 (-0.60) 0.7926 (-0.55) 0.7900 (-0.88) 0.8002 (+0.40)
ρ
Keff
1.0000 (0.10) 0.9982 (-0.18) 0.9895 (-1.05) 1.0091 (+0.91) 0.9984 (-0.16)
28
0.8370 (1.90) 0.8530 (+1.91) 0.8273 (-1.16) 0.8407 (+0.44) 0.8420 (+0.60)
25
0.0614 (1.30) 0.0620 (+0.98) 0.0603 (-1.79) 0.0595 (-3.08) 0.0595 (-3.05)
28
0.0693 (5.10) 0.0681 (-1.73) 0.0685 (+1.15) 0.0705 (+1.73) 0.0715 (+3.14)
*
0.6470 (0.93) 0.6387 (-1.28) 0.6388 (-1.27) 0.6374 (-1.48) 0.6454 (-0.25)
ρ
Keff
1.0000 (0.10) 1.0023 (+0.23) 0.9970 (-0.30) 1.0063 (+0.63) 0.9986 (-0.14)
28
1.3900 (0.72) 1.3923 (+0.16) 1.3851 (-0.35) 1.4037 (+0.99) 1.4002 (+0.74)
25
0.0840 (2.40) 0.08199 (-2.39) 0.0815 (-2.98) 0.0821 (-2.31) 0.0818 (-2.59)
0.0780 (5.10) 0.07362 (-5.61) 0.0753 (-3.46) 0.0780 (-0.03) 0.0790 (+1.34)
ρ
C UO2
*
0.7972
0.7919
0.8047
0.8130
1.0000 (0.10) 1.0021 (+0.21) 0.9967 (-0.33) 1.0064 (+0.64) 0.9990 (-0.10)
28
1.1200 (0.89) 1.1602 (+3.59) 1.1187 (+0.12) 1.1679 (+4.28) 1.1647 (+3.99)
25
0.0680 (1.50) 0.0669 (-1.61) 0.0667 (-1.91) 0.0670 (-1.54) 0.0667 (-1.84)
0.0700 (5.70) 0.0633 (-9.57) 0.0650 (-7.14) 0.0671 (-4.19) 0.0678 (-3.15)
ρ
C UO2
-
Keff
28
BAPL-3
WLUP-69 7 energy groups b
1.0000 (0.30) 0.9975 (-0.25) 0.9885 (-1.15) 1.0056 (0.56) 0.9948 (-0.52)
28
BAPL-2
WLUP-69 5 energy groups b
28
C BAPL-1
JEFF-3.1.1 [64] b
Keff
C TRX-2
CENDL-3.0 [27] b
*
-
0.7274
0.7223
0.7334
0.7407
Keff
1.0000 (0.10) 1.0021 (+0.21) 0.9975 (-0.25) 1.0072 (+0.72) 1.0003 (+0.03)
28
0.9060 (1.10) 0.9130 (+0.77) 0.8996 (-0.71) 0.9180 (+1.32) 0.9154 (+1.04)
25
0.0520 (1.90) 0.0515 (-0.96) 0.0512 (-1.54) 0.0515 (-0.97) 0.0513 (-1.29)
0.0570 (5.30) 0.0518 (-9.12) 0.0535 (-6.14) 0.0549 (-3.64) 0.0553 (-2.91)
ρ
28
C
*
-
0.6511
0.6468
a
0.6559
Values within brackets are experimental errors. Values within brackets are percent differences from experimental values = [(calculate value - experimental value) / experimental value] x 100.
b
96
0.6622
Chapter 5: Results and Discussions
5.3 The In-core Nuclear Characteristics of the TRIGA Mark-III TRR-1/M1 Research Reactor The neutronic calculations of the TRIGA type reactors are typically performed using seven or more energy groups, with three or more thermal groups. Currently the applicability of using five energy groups is under assessment. The in-core neutronic characteristics of a TRIGA Mark-III research reactors are studied at proposed spectrums of five and seven groups, as in table 7, for such assessment. Comparisons were set for three cores of the TRIGA Mark-III TRR-1/M1 Thai research reactor - Core #1, #2, and #3 as described in chapter four and figures 16, 17, and 18. The calculations are mainly reactivity calculations and neutron flux eigen-value problems.
5.3.1 The Reactivities Calculations of the TRR-1/M1 Research Reactor The effective multiplication factor keff is by far the most important parameter in the reactor analysis, and it depends on the material composition and its distribution in the core, and the geometry of the core, also excess reactivity of the core which is a measure of the departure from criticality, which is given in two equivalent units, pcm and $, by; ρ=
k eff 1 , where ρ is in the pcm units k eff
ρ=
k eff 1 , where ρ is in the dollar units ($) k eff
The delayed neutron fraction (β) equals 0.007 for LEU TRIGA fuels as recommended by the General Atomics Company. The reactivities and effective multiplication factors were calculated using
the 3D diffusion depletion
program CITVAP v3.1, using the discrete ordinate method DSN of the WIMSD-5B lattice calculation code, and the WIMSD-IAEA-69 nuclear data 97
Chapter 5: Results and Discussions
library. The effective multiplication factors were calculated for the 1st, 2nd, and 3rd using the five and seven energy groups libraries, also, the total control rods worths, which were evaluated by the difference in reactivities for the totally inserted and the totally withdrawn control rods, were calculated for the 1st and 3rd cores . The current reactivities results using the deterministic diffusion method are compared to the reported Monte Carlo MVP and MCNP results for the three cores, moreover, comparison with the experimental values for the 1st and 2nd cores are presented. The reference results of the 1st and 2nd cores are the BOC excess reactivities evaluated experimentally and using the Monte Carlo MVP code, also the total control rods worth for the 1st core as shown in tables 25 and 26 [34]. The reference results of the 3rd core are the effective multiplication factors for the three control rods positions - fully inserted, working position, and fully withdrawn - also the relative reductions in reactivities upon control rods insertion for the current and the reference Monte Carlo calculations of the ANL [16]. The deviations between the current and the reference MCNP results for the 3rd core are presented in terms of standard deviations for the reference Monte Carlo results, as well as percent deviations as shown in table 27. The calculated fresh cores excess reactivities for the 1st core show good agreement with the references, as shown in table 25, with max. deviations in reactivities for the fully withdrawn control rods core of -4.0% and -7.0% which corresponds to -210 pcm and -371 pcm for the results of the five and seven energy groups respectively. The calculated total control rods worth equals the summation of the individual control rods worth - difference in reactivity between the fully inserted and the fully withdrawn positions - with the remaining rods at the mid-positions. The current control rods worth results deviated more than that of the reactivity results, even acceptable, with max deviations of -841 pcm and -1127 pcm for the results of the five and seven energy groups respectively.
98
Chapter 5: Results and Discussions
The calculated excess reactivities for the 1st core upon the completion of a 61.23 MWD burnup cycle, and fuel rods replacements; i.e., 2nd core BOC, show good agreement with the references, as shown in table 26, with max. deviations of -4.7% and -8.9% which corresponds to -224 and -430 pcm for the results of the five and seven energy groups respectively. Table 25: The 1st core reactivity results. Fully Withdrawn (Excess Reactivity) 5 Groups 7 Groups Total Control Rods Worth 5 Groups 7 Groups
ρ ($) Exp. 7.43
ρ ($) Exp. 15.01
ρ ($)
ρ ($) + R keff WIMS/CITATION WIMS/CITATION 7.13 (-4.0%) (-210 pcm) 1.0525 8.04 ±0.10 6.90 (-7.1%) (-371 pcm) 1.0508 ρ ($) ρ ($) + R keff MVP WIMS/CITATION WIMS/CITATION 16.21 (-8.0%) (-841 pcm) 16.38±0.50 16.76 (-11.7%) (-1127 pcm) MVP
The calculated effective multiplication factors for the 3rd core for the three control rods positions using the five and seven energy groups libraries show good agreements with the reference ANL Monte Carlo MCNP results, albeit better accuracies are encountered with the five energy groups library as shown in table 27. Using the five energy groups library instead of the seven energy groups library has reduced the deviations from 3.17, 2.40 and 2.78 to 0.38, 0.10 and 0.71 units of standard deviations for the fully inserted, working position and fully with-drawn control rods positions respectively, with the same trend in units of percent deviations. The differences in the reactivities between the current diffusion results using the five energy groups library and the reference Monte Carlo results are -214, -67, and -465 pcm for the fully inserted, working position and fully withdrawn control rods positions respectively. Table 26: The 2nd core reactivity results. Fully Withdrawn (Excess Reactivity) 5 Groups 7 Groups
ρ ($)
ρ ($)
Exp.
MVP
6.87
7.67 ±0.10
ρ ($) + R WIMS/CITATION 6.55 (-4.7%) (-224 pcm) 6.26 (-8.9%) (-430 pcm)
99
keff WIMS/CITATION 1.0481 1.0458
Chapter 5: Results and Discussions
For the core calculations where the five and seven energy groups libraries were utilized, the selected mesh size in the core calculations step was standardized for both calculations at 10x10 across each fuel rod with the aim to standardize all the parameters and studying the changes in the accuracy of evaluating the neutronic parameters using the two libraries. The selected mesh size is very fine, that was reflected on the processing time, the required storage memory and the evaluated reactivities. In fact, a coarser mesh size for the seven energy groups calculations will yield reactivities that are more accurate than that of the ultra fine mesh size, but the feasibility of using a seven energy groups nuclear data libraries in the neutronic calculations of the TRIGA type reactors has been previously assessed, and currently the feasibility of using a five energy groups library in a detailed 3D-diffusion calculations is under assessment. Table 27: The 3rd core reactivity results.
Core State
keff
ρ (pcm)
(kMCa - kDa)
/σ
b
(kMC - kD) Δ ρ Dc / Δ ρ MCc Δ ρ Dc (pcm) (Δ ρ D - Δ ρ MC) / kMC
5 Energy Groups Condensation Structure Fully Inserted
0.97495 -2569.4
0.38
0.21%
12053.60
0.9796 (-250)
Working Position 1.03102
3008.7
0.10
0.07%
6475.57
0.9421 (-398)
Fully Withdrawn 1.10478
9484.2
0.71
0.51%
-
-
7 Energy Groups Condensation Structure Fully Inserted
0.96015 -4150.4
3.17
1.72%
12258.90
0.9963 (-45)
Working Position 1.01533
1509.9
2.40
1.59%
6598.65
0.9600 (-275)
Fully Withdrawn 1.08824
8108.5
2.78
2.00%
-
-
a
kMC and kD are the effective multiplication factors calculated by the Monte Carlo (reference) and the diffusion method (current), respectively. b σ is the standard deviation of the reference Monte Carlo calculations. c ΔρMC and ΔρD are the change in reactivity of the core upon control rods insertion from the fully withdrawn case for the Monte Carlo and the diffusion method respectively.
100
Chapter 5: Results and Discussions
5.3.2 The Neutron Flux Distribution of the TRR-1/M1 Research Reactor The results of the neutron flux problem were evaluated suing the five and seven energy groups libraries in order to study the effect of this parameter on the neutron flux distributions. The results of the neutron flux problem are normalized to 2 MW power using an epithermal range of (107–0.625) eV and thermal range of (0.625-0) eV. The thermal and epithermal flux have been generated for the 3rd core at the Central Thimble (CT) along the Z-axis as shown in figure 46. Table 28 lists the maximum thermal and epithermal fluxes in the selected irradiation positions, also the average thermal and epithermal flux for the 38.1 cm located in the core active part - the flux is averaged axially and radially within each irradiation position. The location of this maxima in the flux away from the top of the active distance of the core 38.1 cm - top of the fuel rods active part - is 19.55 for all calculated fluxes. The calculations using the five energy groups library have underestimated the average thermal and epithermal fluxes in the central thimble by 6.4% and 2.9% as compared to the seven energy groups calculations respectively, also the maxima of the thermal and epithermal fluxes has been underestimated by 8.7% and 3.4% respectively. Figure 46: The axial distribution of the thermal and epithermal flux in the central thimble for the five and seven energy groups calculations.
101
Chapter 5: Results and Discussions
Table 28: The maximum and average thermal and epithermal neutron fluxes for the five and seven energy groups calculations. Group Position
5 Groups Thermal + R
7Groups
Epi-Thermal + R
Thermal
Epi-Thermal
CT Avg.
2.910E+13 (-6.4%) 4.915E+13 (-2.9%)
3.110E+13
5.062E+13
CT Max.
3.665E+13 (-8.7%) 6.212E+13 (-3.4%)
4.015E+13
6.428E+13
IP1 Avg.
2.241E+13 (-6.4%) 4.728E+13 (-2.7%)
2.396E+13
4.858E+13
IP2 Avg.
2.246E+13 (-6.3%) 4.737E+13 (-2.6%)
2.399E+13
4.862E+13
Outer IPs Avg. 1.072E+13 (-0.2%) 1.243E+13 (+0.8%) 1.075E+13
1.233E+13
5.3.3 The Power Density Results The power Density of the hottest rod in the core is an important safety parameter of the TRIGA type reactors due to the limiting thermalhydraulic consideration of such reactors, also the intensive heat flux and power generated per fuel rod, which is typically calculated for the subsequent thermalhydraulic calculations. The calculations were performed for the 3rd core using both the five and seven energy groups libraries so as to get a comparative effect of using both libraries on the evaluated factor. The total power peaking factor for the five and seven energy groups libraries are 3.05 and 3.13 respectively, with a deviation of 2.5% as compared to the seven groups calculations. The hottest rod, which is the rod that generates the maximum power in the reactor, also which impose the minimum thermalhydraulic requirements. Both calculations yielded the same hottest rod. Table 29: The Power Density Results of the 3rd core of the TRR-1/M1. Group Power Density SFE (Watt/CC)
5 Groups + R 36.22 (+0.8%)
7 Groups 35.94
Power Density LEU (Watt/CC)
64.83 (-0.8%)
65.38
Hottest Rod Power Density
77.72 (-0.9%)
78.43
PPF with Homogenization (67 98 77)
3.05 (-2.5%)
3.13
102
Chapter 6: Conclusions
CHAPTER 6: CONCLUSIONS Detailed benchmark studies have been conducted for validation and benchmarking of the deterministic diffusion calculational route: WIMSD-IAEA-69 nuclear data library, WIMSD-5B lattice and cell transport calculations code, and CITVAP v3.1 multigroup diffusion core calculations code, for the computational analysis of the neutronics and safety-related parameters of the MTR-type thermal research reactors utilizing the standard MTR plate-type dispersion fuel and the LEU rod-type TRIGA fuels, mainly at a condensation spectrum of five neutron energy groups. Generally, the results show that the proposed route, modeling methods, and the utilized numerical codes and library are valid, reliable, and accurate in performing such type of calculations. The selected numerical codes are widely used and available; and the methodology, models, and inputs specifications have been detailed to a level that they can be reconstructed or reproduced for other reactors or lattices, and so, the currently utilized numerical codes, library, and modeling methodology can be reused with confidence and reliability on the validity and accuracy of these selections for the neutronic calculations and safety analysis of the pre-mentioned reactor types. The aforementioned result has been settled through four steps of benchmarks: neutronics benchmark studies of the IAEA 10 MW benchmark reactor, safety-related benchmark studies of the pre-mentioned reactor, analysis of the TRX and BAPL benchmark lattices, and neutronic study of the in-core nuclear characteristic of the TRR-1/M1 TRIGA Mark-III reactor, and a great concern has been placed to compare the results of each benchmark study with reference reported calculations or experimental results, as much as possible.
103
Chapter 6: Conclusions
The first part of the study is for the neutronics benchmark studies. The main purpose was to evaluate the reactivities at different reactor dependices and solve the neutron flux eigen-value problems, and to compare the results with reported reference results of the ANL and INTERATOM research centers. The study consists of supplementary parts, which are concerned with the cell calculation results: isotopic densities, cell constants, microscopic crosssections, and the k∞. These parameters are greatly library dependant, and the results reflected good matching with the reference ANL results as evident in sections 5.2.1.1, 2, and 3. The most obvious observation, is that the current multiplication factors are higher than that of the reference ANL results, also the isotopic densities of Xe-135, the most prominent fission product is lower than that of the reference ANL results, and higher microscopic fission XS of the U235 isotope and lower macroscopic absorption XS of the water, as compared to the reference ANL results. These results can be connected to each other, and the encountered deviations are acceptable, even, there is much assurance of the current results, that is based on usage of one of the most updated and extensively benchmarked and tested nuclear data library; WLUP-69. Reactivity results - keff, ρ, and Δρ - are compared with the reference ANL and INTERATOM results for the three enrichments at the core states: fresh, BOC and EOC at equal percent and MWd burnup. For the current results in comparison with the ANL results, the encountered deviations: 0.5% to 0.7% for the keff , -2.4 to 1.4 units of standard deviations for the keff in comparison with Monte Carlo results, 470 to 590 pcm for the ρ’s of the fresh cores, -30 to 16 pcm for the Δρ upon completion of 5% burnup step, Δk by enrichment reduction for the current of -1.1% to 4.2% and for ANL of -1.1% to 4.0%; and for the INTERATOM, the corresponding differences: -0.4% – 0.7%, 90 to 590 pcm, 44 to 160 pcm, and -1.5% to 3.6% for the Δk. Acceptable deviations in percent or in pcm’s are encountered as of tables 12 to 16, which indicate that both of the current and the reference results are inline and in good agreement.
104
Chapter 6: Conclusions
Neutron flux distributions in the 3D geometry were compared mainly with the reference 2D results of ANL, in addition to other research centers when possible. Comparison of the core and flux trap average thermal fluxes show the deviations: -0.2% for the former and 2.3% for the later for the HEU BOC, 0.3% and 2.6% for the MEU BOC, and -0.3% and 2.9% for the LEU BOC, also deviations in calculations of the reduction in thermal flux upon HEU/REU conversions of: +0.4% and -5.4% for the 93% → 45% conversion at the BOC, and 0.2% and -4.6% for the 93% → 20% conversion at the BOC, as shown in tables 17 and 18. Figure 47 shows the midplane flux ratios: ϕf20/ ϕf93, ϕth45/ ϕth93, and ϕth20/ ϕth93, at the BOC with Xe-equilibrium for both of the equal percent and equal MWd burnup states, for the current and the reference ANL, INTERATOM, ӦSGAE, CEA, EIR, CNEA, and JAERI results. Also figures from 27 to 30 show the midplane fluxes at BOC along the X-axis for the current an reference ANL results. Figures from 31 to 38 show the midplane flux ratios for the REU converted cores at the pre-mentioned parameters. The flux distributions show consistency and close matching to a satisfactory level with the references, specially with the ANL and INTERATOM results, which reflects the accuracy of the diffusion code CITVAP for solving the neutron flux eigen-value problems using the current WIMS evaluated macroscopic crosssection libraries at the condensed spectra. The second part of the study is for the safety-related benchmark calculations, in which various safety-related reactor parameters were evaluated and compared with reference ANL, INTERATOM, and EIR results. The isothermal reactivity feed-back coefficients were evaluated for: water temp., water density, water density and temp., and fuel temp., as in table 19 and figures 39 to 43. The calculated parameters directly test the capability of WIMS to generate the cell constants accurately at different physical dependices. The results show variant degrees of closeness to the references, specially for the water density parameter, even the same conclusions like the dominant reactivity coefficient at different enrichments could be drawn.
105
Chapter 6: Conclusions
Figure 47: The midplane flux ratios ϕf20/ ϕf93, ϕth45/ ϕth93, and ϕth20/ ϕth93 for the BOC along the X-axis.
106
Chapter 6: Conclusions
The fact that high discrepancies were encountered in certain reactivity coefficients at certain temperature or density ranges as in table 19, does not in itself affect assurance and reliability of the utilized nuclear data library or the generated cross-section data sets, rather, the pre-mentioned discrepancies shall be carefully considered when comparing realistic core results with the references, moreover, nearly the same discrepancies exist between various results of the references: ANL, INTERATOM, and EIR. Secondly, the radial and local power peaking factors have been compared with the ANL and INTERATOM references results. Being an important reactor safety parameter, a great effort has been placed to standardize the calculations and neutralize the affecting parameters at various reactor conditions. The results are highly consistent with the references, with deviations from the references: max. of -2.8% for the former and -3.1% for the later, for the Radial factor; +3.0% and +4.2% for the Local factor; and +3.5% and -4.5% for the Total factor. From the calculations; the most effort has been place to calculate the local power peaking factor, which shall be evaluated at the mesh edge. Two self-consistent methods for cross-check were used: extrapolating the power density distribution into the mesh edge, and comparison of thermal flux dominance of the fission reaction rates at thermal range - between the mesh center and the mesh edge. Thirdly, the worth of the control rods - Ag/In/Cd, B4C, and Hf absorbers were evaluated and compared with reference ANL diffusion and Monte Carlo results, in addition to INTERATOM diffusion results. General good matching were encountered, specially for the burned core, and local acceptable deviations were encountered for the fresh cores as compared to ANL Monte Carlo results for the Ag/In/Cd and B4C absorbers; 7.8% and 8.4% respectively, which are attributed to the differences between the current and the references thermal flux distributions across the cores, specially for the fresh unburned cores. The partial and the integral worths of the Ag/In/Cd control rod as in figures 44 and
107
Chapter 6: Conclusions
45 greatly support the fact that the WLUP library and WIMS code generate the macroscopic cross-sections of the resonant absorbers accurately, and the CITVAP code accurately model the reactor and solve the neutron flux eigenvalue problem under the sever perturbation of control rods insertion. The third part of the study is the analysis of the integral parameters of the TRX and BAPL benchmark lattices, through evaluation of the integral parameters: keff, ρ238, δ235, δ238, and C*, and comparison of the results with the references: experimental results [10], Monte Carlo MCNP results [27], and WIMSD-5B results using the JEFF-3.1.1 ENDL [64]. For the keff, the current seven energy groups calculations predicts better values than the five energy groups calculations, while for the remaining parameters, the accuracy of the former is lower, even to a minor degree. The results are shown in table 24, and clarified in figure 48, which greatly support the fact that the utilized WLUP library and WIMSD code are suitable and accurate in evaluating various reaction rates and macroscopic cross sections of the U-235 and U-238 isotopes, as compared to other ENDLs and cell calculations codes. The final part of the benchmark study is the evaluation of the in-core nuclear characteristic of the TRR-1/M1 TRIGA Mark-III research reactors. The reactivities of three different cores as stated in chapter 3 and the worth of the control rods, have been calculated and compared with the references: TINT results using the MVP Monte Carlo code [34], experimental values of the reactor [34], ANL results using the MCNP Monte Carlo code [16]. As stated in section 5.2.1, the results represent good agreement with the references specially for the five energy groups calculations, with acceptable deviations for the first core of: -210 and -841 pcm for the reactivity at the fully withdrawn CR and the total CRs worth; and for the second core of: -224 pcm for the fully withdrawn control rods positions; and for the third core of: -250 and -398 pcm for the worth of control rods corresponding to fully inserted and working positions. Even the calculated shutdown margins using five energy groups spectrum are
108
Chapter 6: Conclusions
higher than that of the seven energy groups, the deviations are small and satisfactory, moreover, the absolute values of reactivities of the core are better than that of the seven energy groups calculations, with deviations in terms of standard deviations of: 0.4, 0.1, and 0.7 for the: fully inserted, working positions, and fully withdrawn core states. Figure 48: The Integral Parameters of the TRX and BAPL benchmark lattices.
109
Chapter 6: Conclusions
These findings, regarding to the reactivities, control rods worth, and shutdown margins, support that the utilized five and seven energy groups spectrum are suitable and accurate in calculating the aforementioned parameters for the TRIGA type reactors using the pre-stated deterministic diffusion calculational route. Moreover, the five energy groups are yet more accurate in doing such calculations. The remaining neutronics and safety-related parameters of the TRIGA reactor - the neutron flux, power density, are not yet benchmarked against reference values, due to the lack of experimental values for such reactor, which are left for future comparisons. Inter-comparison of the values indicate that they are not greatly distinct with deviations regarding the seven energy groups results as a reference of: -2.9%, -2.7%, and -2.6% for the average thermal flux in the central thimble, irradiation position #1, and irradiation position #2, respectively; +0.8% and -0.8% for the power density in the SFE and LEU fuel rods, respectively; -0.9% for the hottest rod power density; and -2.5% for the power peaking factor - without homogenization. Generally, with a sight on the aforementioned findings and discussions, the currently propose deterministic diffusion calculational route; WIMSD-IAEA69/WIMSD-5B/CITVAP v3.1, has been assessed and benchmarked throughout detailed theoretical benchmark studies of the IAEA neutronics and safety related benchmark calculations for research reactors core conversion, experimental benchmark lattices, and a realistic TRIGA core study; as a suitable, reliable, and accurate tool for the neutronic calculations and safety analysis of the MTR-type thermal research reactors utilizing standard MTR fuel or the TRIGA type fuel using a neutron energy spectrum of five energy groups with one thermal group.
110
References
REFERENCES [1]
Ahmed, S. I., “Effect of new cross-section evaluations on criticality and neutron energy spectrum of a typical material test research reactor”, Ph.D. Thesis, Pakistan Institute of Engineering and Applied Sciences, Islamabad, Pakistan, 2005.
[2]
Ahmed, R., “A core conversion study by using higher density low enriched Uranium fuels”, Ph.D. Thesis, Pakistan Institute of Engineering and Applied Sciences, Islamabad, Pakistan, 2006.
[3]
Aldama, D. L., Leszczynski, F., and Trkov, A., “WIMS-D Library Update”, IAEA, Vienna, Austria, 2007.
[4]
Askew, J. R. and Roth, M. J.. “WIMSE, a Scheme for Neutronic Calculations”, AEEW-R1315, 1982.
[5]
Askew, J. R., Fayers, F. J., and Kemshell, P. B., “A General Description of the Lattice Code WIMS”, Journal of British Nuclear Energy Society, Vol. 5, No. 4, P. 564, 1966.
[6]
Barsom, H. K., Amin, E. A., and Bashter, E. I., “Fuel Loading Follow Up in Egypt Second Research Reactor”, M.Sc. Thesis, Department of Physics, Faculty of Science, Zagazig University , Zagazig, Egypt, 2005.
[7]
Bell, G. I. and Glasstone, S., “Nuclear Reactor Theory”, New York: Van Nostrand Reinhold, 1970.
[8]
Brown, J. R., Harris, D. R., Frantz, F. S., Volpe, J. J., Andrews, J. C., and Noordhoff, B. H., “Kinetics and Buckling Measurements in Lattices of Slightly Enriched U or UO2 rods in H2O”. WAPD-176, January 1958.
[9]
Colin, D. W., “Research Reactors: an overview”, ANS Nuclear News, Oct 1997.
[10] Cross Section Evaluation Working Group, “Benchmark Specifications with Supplements. Brookhaven National Laboratory”, National Nuclear Data Center, Upton, New York 11973, BNL-19302, Vol. II. ENDF-202, USA, November 1, 1986.
111
References
[11] Dean, C. J., “Production of application libraries for WIMS”, International Nuclear Data Committee INDC (NDS)-317, Nuclear Data Section, IAEA, Vienna, Austria, 1993. [12] Duderstadt, J. J. and Hamilton, L. J., “Nuclear Reactor Analysis”, John Wiley & Sons inc, 1976. [13] Enany, M. R., Nagy, M. E., and Elafify, M. M., “Assessment of the Neutronic Parameters of ET-RR-2”, M.Sc. Thesis, Nuclear Eng. Department, Faculty of Engineering, Alexandria University, Alexandria, Egypt, 2003. [14] Fowler, T. B., Vondy, D. R., and Cunningham, G. W., “Nuclear Reactor Core Analysis Code: CITATION”, USAEC Report ORNL-TM-2496, Rev. 2, ORNL, Oak Ridge, Tennessee, USA, 1971. [15] The General Atomics Co., http://www.ga-esi.com/triga/, 2011. [16] Gallmeier, F. X., Tang, J. S., and Primm, R. T., “MCNP-Model for the OAEP Thai Research Reactor”, ORNL/TM-13656, ORNL, Oak Ridge, Tennessee, USA, 1998. [17] Halsall, M. J., “Summery of WIMS-D/4 Input Options”, AEEW-M 1327, 1980. [18] Halsall, M. J., “A Review of the WIMS Nuclear Data Library”, Nuclear Energy, Vol. 30, No. 5, P. 285-290, 1991. [19] Halsall, M. J., “WIMS - A General Purpose Code for Reactor Core Analysis”. The ANSWERS Software Service, December 1995. [20] Halsall, M. J., “WIMSD, A Neutronic Code for Standard Lattice Physics Analysis”, Distributed by the NEA Databank, NEA-1507/04, 1997. [21] Halsall, M. J. and Taubman, C. J., “The ‘1986’ WIMS Nuclear Data Library”, AEEW-R 2133, NEA Data Bank, Package ID No. 1507/02/03, 1986. [22] Hardy, J., Klein, Jr. D., and Volpe, J. J., “A Study of Physics Parameters in Several Water-moderated Lattices of Slightly Enriched and Natural Uranium”, WAPD-TM-931, March 1970a. [23] Hardy, J., Klein, Jr. D., and Volpe, J. J., Nuclear Science and Engineering, Vol. 40, P. 101, 1970b.
112
References
[24] Harmon, C. D., Busch, R. D., Briesmeister, J. F., Forster, R. A., and Brewer, R., “Criticality Calculations with MCNP5: A Primer”, Los Alamos National laboratory (LANL), USA, 2009. [25] Hellens, R. L. and Price, G. A., “Reactor physics data for water-moderated lattices of slightly enriched uranium”, Reactor Technology Selected Reviews, 529, 1964. [26] Henry, F., “Nuclear Reactor Analysis”, Cambridge, MA: MIT Press, 1975. [27] Hongwei, Y. U., “Present Status of CENDL Project”, China Nuclear Data Center, China Institute of Atomic Energy, 2007. [28] Huda, M. Q., Rahman, M., Sarker, M. M., and Bhuiyan, S. I., “Benchmark Analysis of the TRIGA MARK II Research Reactor using Monte Carlo Techniques”, Annals of Nuclear Energy Vol. 31, P. 1299–1313, 2004. [29] Hutton, J. L. and Newton, T. D., “The Next Generation WIMS Lattice Code : WIMS9”, PHYSOR 2002, Seoul, Korea, 2002. [30] Hutton, J. L., Newton, T. D., Perry, R. J., and Powney, D. J., “Validation of WIMS9”, PHYSOR 2004, Chicago, Illinois, USA, 25-29 August 2004. [31] "Preparation of a programme on Research Reactor Core Conversions to Use LEU instead of HEU", Consultant meeting held at the IAEA, Vienna, Austria, June 19-22, 1979. [32] Ise, T., Inabe, T., and Nakahara, Y., Journal of the Atomic Energy Society of Japan, Vol. 17, No. 6, P. 314, 1975. [33] Islam, S. M. T., Sarker, M. M., Khan, M. J. H., Islam, S. M. A., “A comparative study of integral parameters for TRX and BAPL benchmark lattices of thermal reactors using the cross-section library generated from JENDL and JEF evaluated data files”, Progress in Nuclear Energy, Vol. 51, P. 378–381, 2009. [34] Kriangchaiporn, N., “TRR-1/M1 Core Analysis with MVP”, Conference on Nuclear Science and Technology Bangkok (Thailand), International Nuclear Information System INIS-TH--166 NST--10-ET15, 16-17 Aug 2007. [35] Kulikowska, T., “WIMSD-5B: a Neutronic Code for Standard Lattice Physics Analysis”. NEA Data Bank, 1996. [36] The Diagnostics Applications Group (X-5) in the Applied Physics Division (X Division) at the Los Alamos National Laboratory; X-5 Monte Carlo Team; 113
References
Thomas E. Booth, H. Grady Hughes, Anthony Zukaitis, Forrest B. Brown, Russell D. Mosteller, Marsha Boggs, Jeffrey S. Bull, Richard E. Prael, Roger Martz, R. Arthur Forster, Avneet Sood, John T. Goorley, Jeremy E. Sweezy, X5 Data Team; Joann M. Campbell, Robert C. Little, Morgan C. White, Stephanie C. Frankle, and Technical Editor; Sheila M. Girard. “MCNP - A General Monte Carlo N-Particle Transport Code, Version 5, Volume I: Overview and Theory”, Los Alamos National laboratory (LANL), USA, April, 24 2003. [37] Lee, J. T., Kim, J., and Cho, M., “Multigroup calculations for TRIGA-type reactor analysis”, Journal of the Korean Nuclear Society, Vol. 10, No. 2, 1978. [38] Lee, U. C., Lee, C. K., Lee, J. K., Kim, J. S., Lee, S. K., Jun, B. J., and Chung, B. D., “Analysis of fuel options in TRIGA Reactor”, Journal of the Korean Nuclear Society, Vol. 11, No. 1, 1979. [39] Lewis, E. E. and Miller, W. F., “Computational Methods of Neutron Transport”, New York: John Wiley & Sons, 1984. [40] MacFarlane, R. E. and Muir, D. W., “The NJOY Nuclear Data Processing System, A Code System for Producing Point-wise and Multigroup Neutron and Photon Cross Sections from ENDF/B Evaluated Nuclear Data”, Rep. LA12740, Los Alamos National Laboratory, NM, 1994. [41] Newton, T., Hosking, G., Hutton, L., Powney, D., Turland, B., and Shuttleworth, T., “Developments within WIMS10”, International Conference on the Physics of Reactors “Nuclear Power: A Sustainable Resource” CasinoKursaal Conference Center, Interlaken, Switzerland, 2008. [42] Parsons, D. K., “ANISN/PC MANUAL”, EGG-2500, December 1988. [43] Powney, D. J., “Calculation of Temperature Reactivity Coefficients in KRITZ-2 Critical Experiments Using WIMS”, PHYSOR 2000, Pittsburg, USA, May 2000. [44] The Reduced Enrichment for Research and Test Reactors (RERTR) Program, http://www.rertr.anl.gov/, 2011. [45] Roth, M. J., Macdougall, J. D., and Kemshell, P. B., “The Preparation of Input Data for WIMS”, AEEW-R538, 1967. [46] Research Reactors: Purpose and Future, IAEA, Vienna, Austria, 2010. [47] IAEA Research Reactors Database, http://nucleus.iaea.org/RRDB/, 2011.
114
References
[48] Sarker, M. M., Bhuiyan, S. I., and Akramuzzaman, M. M., “Neutronics analysis of the 3 MW TRIGA Mark-II research reactor by using SRAC code system”, Annals of Nuclear Energy, Vol. 35, P. 1140–1146, 2008. [49]
“Safety Analysis for Research Reactors”, Safety Reports Series No. 55, IAEA, Vienna, Austria, 2008.
[50] Sekimoto, H., “Nuclear Reactor Theory”, COE-INES Textbook, Tokyo Institute of Technology, 2007. [51] Sher, R. and Fiarman, S., “Studies of Thermal Reactor Benchmark Data Interpretation: Experimental Corrections”, EPRI NP-209, October 1976. [52] Simnad, M. T., Foushee, F. C., and West, G. B., Nuclear Technology, Vol. 28, P. 31 ,1976. [53] SITTICHAI, C., “Current Status of TRR-1/M1”, JAERI-Conf 2000-017, 2000. [54] Smith, N. R., Shuttleworth, T., Carter, S., and Evans, M., “Geometry modeling and visualization for the Monte Carlo Code MCBEND”, 8th International Conference on Radiation Shielding Arlington, Texas, USA, 1994. [55] Smith, N. R. and Morrell, G. A., “An Introduction to MONK7”, The Fifth International Conference on Nuclear Criticality Safety Albuquerque, New Mexico, USA, 1995. [56] Smith, N. R. and Thorne, P. R., “The Accurate Determination of Sub-critical Margins to Meet Emerging Criticality Needs”, American Nuclear Society; Nuclear Criticality Safety Division, Topical meeting, Criticality safety challenges in the next decade; P. 240-246, 1997. [57] Smith, N. R., Armishaw, M. J., Hutton, L., and Sidell, J., “The Unification of MONK – Extending the Monte Carlo Horizon”, The Sixth International Conference on Nuclear Criticality Safety (ICNC '99), - Palais des Congrès, Versailles, France, 20-24 September 1999. [58] Smith, N. R., Shuttleworth, E., Grimstone, M. J., Hutton, J. L., Armishaw, M., Brid, A., and France, N. (all Serco Assurance), and Connolly, S. (BNFL), “The Current Status and Future Plans for the Monte Carlo Codes MONK and MCBEND”, Monte Carlo 2000, The International Conference on Advanced Monte Carlo for Radiation Physics, Particle Transport Simulation and Applications, Lisbon, Portugal, 23-26 October 2000.
115
References
[59] Taubman, C. J., “The WIMS 69-Group Library Tape 166259”, Rep. AEEWM1324, Atomic Energy Establishment, Winfrith, United Kingdom, 1975. [60] IAEA-TECDOC-1234, “The Applications of Research Reactors”, IAEA, Vienna, Austria, 2001. [61] IAEA-TECDOC-233, “Research Reactor Core Conversion from the Use of Highly Enriched Uranium to the Use of Low Enriched Uranium Fuel”, IAEA, Vienna, Austria, 1980. [62] IAEA-TECDOC-643 Volume 1, “Research reactor core conversion guidebook, Volume 1: Summery”, IAEA, Vienna, Austria, 1992. [63] IAEA-TECDOC-643 Volume 3, “Research reactor core conversion guidebook, Volume 3: Analytical verification (Appendices G and H)”, IAEA, Vienna, Austria, 1992. [64] Uddin, M. N., Sarker, M. M., Khan, M. J. H., and Islam, S. M. A., “Validation of CENDL and JEFF evaluated nuclear data files for TRIGA calculations through the analysis of integral parameters of TRX and BAPL benchmark lattices of thermal reactors”, Annals of Nuclear Energy, Vol. 36, P. 1521–1526, 2009. [65] Uddin, M. N., Sarker, M. M., Khan, M. J. H., and Islam, S. M. A., “Computational analysis of neutronic parameters for TRIGA Mark-II research reactor using evaluated nuclear data libraries”, Annals of Nuclear Energy, Vol. 37, P. 302-309, 2010. [66] Villarino, E. A. and Lecot, C. A., “CITVAP V3.1, a reactor calculation code”, Nuclear Engineering Division, INVAP SE, San Carlos de Bariloche, Argentina, 1995. [67] Villarino, E. A., “MTR_PC V3.0, a neutronic, thermalhydraulic and shielding calculations of MTR-type reactors on personal computers”, Nuclear Engineering Division, INVAP SE, San Carlos de Bariloche, Argentina, 2001. [68] WIMSD-5B, OECD/NEA Data Bank Documentation, Package ID No. 1507/04, http://www.oecd-nea.org/dbprog/, 2004. [69] Yook, C. C., Han, G. Y., Jun, B. J., Lee, J. B., and Lee, C. K., “Calculation of nuclear characteristics of the TRIGA Mark-III reactor”, Journal of the Korean Nuclear Society, Vol. 13, No. 4, 1981.
116
التحقق والمقارنة المعيارية لطريقة اإلنتشار التحديدية للحسابات النيوترونية لمفاعالت األبحاث الحرارية إعداد أحمد صالح الدين أحمد شما )بكالوريوس ھندسة وعلوم الفلزات والمواد – جامعة قناة السويس(
رسالة مقدمة إلى قسم الرياضيات و الفيزيقا الھندسية -كلية الھندسة ،جامعة القاھرة كجزء من متطلبات الحصول على درجة الماجستير في الفيزيقا الھندسية
كلية الھندسة ،جامعة القاھرة الجيزة ،جمھورية مصر العربية ٢٠١١
التحقق والمقارنة المعيارية لطريقة اإلنتشار التحديدية للحسابات النيوترونية لمفاعالت األبحاث الحرارية إعداد أحمد صالح الدين أحمد شما )بكالوريوس ھندسة وعلوم الفلزات والمواد – جامعة قناة السويس(
رسالة مقدمة إلى قسم الرياضيات و الفيزيقا الھندسية -كلية الھندسة ،جامعة القاھرة كجزء من متطلبات الحصول على درجة الماجستير في الفيزيقا الھندسية تحت إشراف
األستاذ الدكتور /حمدي محمود حسين
األستاذة الدكتورة /عصمت ھانم علي أمين
أستاذ بقسم الرياضيات و الفيزيقا الھندسية - -جامعة القاھرة كلية الھندسة
أستاذ أمان المفاعالت -المركز القومي لألمان النووي و الرقابة اإلشعاعية- ھيئة الطاقة الذرية
كلية الھندسة ،جامعة القاھرة الجيزة ،جمھورية مصر العربية ٢٠١١
ﻣﻠﺨﺺ اﻟﺮﺳﺎﻟﺔ ﺗﺘﻨﺎول اﻟﺮﺳﺎﻟﺔ إﺟﺮاءات اﻟﺘﺤﻘﻖ ﻣﻦ ﺻﺤﺔ وﺻﻼﺣﯿﺔ طﺮﯾﻘ ﺔ اﻹﻧﺘﺸ ﺎر اﻟﺘﺤﺪﯾﺪﯾ ﺔ ﻟﺤﺴ ﺎب وﺗﺤﻠﯿ ﻞ اﻟﻤﻌ ﺎﻣﻼت اﻟﻨﯿﻮﺗﺮوﻧﯿﺔ و ﻣﻌ ﺎﻣﻼت اﻷﻣ ﺎن ﻟﻤﻔ ﺎﻋﻼت إﺧﺘﺒ ﺎر اﻟﻤ ﻮاد -ﻣﻔ ﺎﻋﻼت اﻷﺑﺤ ﺎث ﻣ ﻦ اﻟﻨ ﻮع - MTRاﻟﺘ ﻰ ﺗﺴ ﺘﺨﺪم وﻗﻮد اﻻﻟﻮاح اﻟﻨﻤﻮذﺟﻰ ﻋﺎﻟﻰ وﻣﻨﺨﻔﺾ اﻟﺘﺨﺼﯿﺐ واﻟﺘﻰ ﺗﺴﺘﺨﺪم اﻟﻮﻗ ﻮد اﻟﻘﻀ ﯿﺒﻰ ﻣ ﻨﺨﻔﺾ اﻟﺘﺨﺼ ﯿﺐ ﻣ ﻦ اﻟﻨ ﻮع ,TRIGAﺑﺈﺳﺘﺨﺪام ﺑﺮاﻣﺞ اﻟﻤﺤﺎﻛﺎة اﻟﻌﺪدﯾ ﺔ WIMSD-5B :و CITVAP v3.1و ﺑﺈﺳ ﺘﺨﺪام ﻣﻜﺘﺒ ﺔ اﻟﻤﻌﻄﯿ ﺎت اﻟﻨﻮوﯾ ﺔ WIMSD-IAEA-69اﻟﻤﺘﺎﺣ ﺔ ﻣ ﻊ ﺣﺰﻣ ﺔ اﻟﺒ ﺮاﻣﺞ ,MTR_PC v3.0وذﻟ ﻚ ﻋ ﻦ طﺮﯾ ﻖ :دراﺳ ﺎت ﻣﻌ ﺎﯾﺮة ﻧﯿﻮﺗﺮوﻧﯿ ﮫ و دراﺳ ﺎت ﻣﻌ ﺎﯾﺮة ﻣﻌ ﺎﻣﻼت اﻷﻣ ﺎن ﻟﻠﻤﻔﺎﻋ ﻞ ,IAEA 10 MW Benchmark Reactorو ﺗﺤﻠﯿﻞ اﻟﺨﺼﺎﺋﺺ اﻟﻨﻮوﯾﺔ ﻟﻤﻔﺎﻋﻞ اﻷﺑﺤﺎث اﻟﺘﺎﯾﻼﻧﺪى TRR-1/M1ﻣﻦ اﻟﻄﺮاز .TRIGA Mark-III ﺗﻢ اﻟﺤﺼ ﻮل ﻋﻠ ﻰ ﻣﻌ ﺎﻣﻼت اﻷﻣ ﺎن واﻟﻤﻌ ﺎﻣﻼت اﻟﻨﯿﻮﺗﺮوﻧﯿ ﺔ ﺑﺈﺳ ﺘﺨﺪام طﺮﯾﻘ ﺔ اﻹﻧﺘﺸ ﺎر اﻟﺘﺤﺪﯾﺪﯾ ﺔ ,ﺑﺈﺳ ﺘﺨﺪام ﺑﺮﻧﺎﻣﺞ ﺣﺴﺎب اﻟﺨﻼﯾﺎ ,WIMSD-5Bوﻣﻜﺘﺒ ﺔ اﻟﻤﻌﻄﯿ ﺎت اﻟﻨﻮوﯾ ﺔ WIMSD-IAEA-69وﺗﻜﺜﯿ ﻒ طﯿ ﻒ طﺎﻗ ﺔ اﻟﻨﯿﻮﺗﺮوﻧ ﺎت ﺑﺼ ﻮرة أﺳﺎﺳ ﯿﺔ اﻟ ﻰ ﺧﻤﺴ ﺔ ﻣﺠﻤﻮﻋ ﺎت طﺎﻗ ﺔ ﻟﻠﺤﺼ ﻮل ﻋﻠ ﻰ ﺛﻮاﺑ ﺖ اﻟﺨﻼﯾ ﺎ ﻟﻜ ﻞ اﻟﻤ ﻮاد اﻟﻤﻮﺟ ﻮده ﺑﺎﻟﻤﻔﺎﻋ ﻞ .ﺗ ﻢ إدﺧ ﺎل اﻟﻨﺘ ﺎﺋﺞ اﻟﻤﺴﺘﺨﻠﺼ ﺔ ﻣ ﻦ ﺣﺴ ﺎﺑﺎت اﻟﺨﻼﯾ ﺎ ﻓ ﻰ ﺑﺮﻧ ﺎﻣﺞ HXSﻟﺘﻜ ﻮﯾﻦ ﻣﻜﺘﺒ ﺎت اﻟﻤﻘ ﺎطﻊ اﻟﻤﺴﺘﻌﺮﺿﺔ اﻟﻤﻨﺎظﺮة ﻟﻠﻤﺘﻐﯿﺮات اﻟﻤﺨﺘﻠﻔﺔ )اﻻﺣﺘﺮاق ,درﺟﺎت اﻟﺤﺮارة ,أطﯿﺎف طﺎﻗ ﺔ اﻟﻨﯿﻮﺗﺮوﻧ ﺎت ... ,اﻟ ﺦ( ,ﻟﻜ ﻞ اﻟﻤﻮاد اﻟﻤﺴﺘﺨﺪﻣﺔ ﻓﻰ ﻗﻠﺐ اﻟﻤﻔﺎﻋﻞ )وﻗﻮد ,أﻋﻤﺪة ﺗﺤﻜﻢ ,ﻋﺎﻛﺴﺎت ,ﻣﮭﺪﺋﺎت( ,وﺗﻢ إﺳﺘﺨﺪاﻣﮭﺎ ﺑﻌ ﺪ ذﻟ ﻚ ﻓ ﻰ ﺣﺴ ﺎﺑﺎت اﻟﻤﻔﺎﻋ ﻞ ﺑﺈﺳ ﺘﺨﺪام ﺑﺮﻧ ﺎﻣﺞ ﺣﺴ ﺎﺑﺎت اﻟﻤﻔﺎﻋ ﻞ ﺑﻄﺮﯾﻘ ﺔ اﻹﻧﺘﺸ ﺎر CITVAP v3.1ﻓ ﻰ ﺛﻼﺛ ﺔ أﺑﻌ ﺎد xyzوذﻟ ﻚ ﻟﻠﺤﺼﻮل ﻋﻠﻰ اﻟﻤﻌﺎﻣﻼت اﻟﻨﯿﻮﺗﺮوﻧﯿﺔ وﻣﻌﺎﻣﻼت اﻻﻣﺎن ) … .(ρ, keff, Φ, ρx, αT, PPF, ﺗﻢ ﺗﻄﺒﯿﻖ ھﺬه اﻟﻄﺮﯾﻘﺔ ﻋﻠﻰ أرﺑﻌﺔ ﻧﻤﺎذج ﺗﺸﺘﻤﻞ: .١دراﺳ ﺎت ﻣﻌ ﺎﯾﺮة ﻧﯿﻮﺗﺮوﻧﯿ ﺔ ,وﯾﺘﻜ ﻮن اﻟﻨﻤ ﻮذج اﻷﺳﺎﺳ ﻰ ﻣ ﻦ ﻣﻔﺎﻋ ﻞ اﻟﻮﻛﺎﻟ ﺔ اﻟﺪوﻟﯿ ﺔ ﻟﻠﻄﺎﻗ ﮫ اﻟﺬرﯾ ﺔ اﻟﺨ ﺎص ﺑﺎﻟﻤﻌﺎﯾﺮة اﻟﻨﯿﺘﺮوﻧﯿﺔ ,IAEA 10 MW Benchmark Reactorوھﻮ ﻣﻔﺎﻋﻞ إﺧﺘﺒﺎر ﻣﻮاد ﯾﺴﺘﺨﺪم وﻗﻮد اﻷﻟ ﻮاح اﻟﻨﻤ ﻮذﺟﻰ ذو ﺗﺨﺼ ﯿﺐ :ﻋ ﺎﻟﻰ ,%٩٣ﻣﺘﻮﺳ ﻂ ,%٤٥وﻣ ﻨﺨﻔﺾ .%٢٠وﺗﺘﻜ ﻮن اﻟﻨﺘ ﺎﺋﺞ ﺑﺼ ﻮرة أﺳﺎﺳ ﯿﺔ ﻣ ﻦ درﺟﺎت ﻧﺸﺎطﯿﺔ ﻗﻠﺐ اﻟﻤﻔﺎﻋﻞ ) (keff , ρو ﻛﺜﺎﻓﺔ اﻟﻔﯿﺾ اﻟﻨﯿﻮﺗﺮوﻧﻰ ,Φوﺗﻤﺖ ﻣﻘﺎرﻧﺔ اﻟﻨﺘ ﺎﺋﺞ ﺑﺼ ﻮرة أﺳﺎﺳ ﯿﺔ ﻣ ﻊ ﻧﺘﺎﺋﺞ ﺳﺎﺑﻘﺔ ﻟﻤﺮاﻛﺰ اﻷﺑﺤﺎث ANLو .INTERATOM .٢دراﺳ ﺎت ﻣﻌ ﺎﯾﺮة ﻣﻌ ﺎﻣﻼت اﻷﻣ ﺎن ,وﺗ ﻢ إﺳ ﺘﺨﺪام ﻧﻔ ﺲ اﻟﻤﻔﺎﻋ ﻞ اﻟﻤﺴ ﺘﺨﺪم ﻓ ﻰ اﻟﺪراﺳ ﺔ اﻟﻨﯿﻮﺗﺮوﻧﯿ ﺔ ,وﺗﺘﻜ ﻮن اﻟﻨﺘ ﺎﺋﺞ ﺑﺼ ﻮرة أﺳﺎﺳ ﯿﺔ ﻣ ﻦ ﺛﻮاﺑ ﺖ اﻟﻨﺸ ﺎطﯿﺔ ,αTﻣﻌ ﺎﻣﻼت أﻗﺼ ﻰ ﻗ ﺪرة ,PPFﻗ ﯿﻢ ﻣﻌ ﺎﻣﻼت اﻟﻨﺸ ﺎطﯿﺔ ﻟﻘﻀ ﺒﺎن اﻟﺘﺤﻜﻢ ,ρxوﺗﻤﺖ ﻣﻘﺎرﻧﺔ اﻟﻨﺘﺎﺋﺞ ﺑﺼﻮرة أﺳﺎﺳﯿﺔ ﻣﻊ ﻧﺘﺎﺋﺞ ﺳﺎﺑﻘﺔ ﻟﻤﺮاﻛﺰ اﻷﺑﺤﺎث ANLو .INTERATOM .٣دراﺳ ﺔ ﻣﻌ ﺎﯾﺮة ﻣﻜﺘﺒ ﺎت اﻟﻤﻌﻄﯿ ﺎت اﻟﻨﻮوﯾ ﺔ ﺑﺈﺳ ﺘﺨﺪام ﺷ ﺒﻜﺎت اﻟﺨﻼﯾ ﺎ اﻟﻌﯿﺎرﯾ ﺔ TRXو BAPLاﻟﻘﻀ ﯿﺒﯿﺔ وﻣﻨﺨﻔﻀﺔ اﻟﺘﺨﺼﯿﺐ ,و اﻟﻤﻨ ﺎظﺮة ﻟﻠﻮﻗ ﻮد اﻟﻤﺴ ﺘﺨﺪم ﺑﺎﻟﻤﻔ ﺎﻋﻼت ﻣ ﻦ اﻟﻨ ﻮع ,TRIGAو ﺗﻤ ﺖ ﻣﻘﺎرﻧ ﺔ اﻟﻤﻌ ﺎﻣﻼت اﻟﺘﻜﺎﻣﻠﯿﺔ ﻟﻠﺨﻼﯾ ﺎ ) (C*,δ238 ,δ235 ,ρ238 ,keffﻣ ﻊ ﻧﺘ ﺎﺋﺞ ﻣﻌﻤﻠﯿ ﺔ و ﻧﺘ ﺎﺋﺞ دراﺳ ﺎت ﺳ ﺎﺑﻘﺔ ﺧﺎﺻ ﺔ ﺑﻤﻌﻤ ﻞ اﻷﺑﺤ ﺎث BNLو ھﯿﺌﺔ اﻟﻄﺎﻗﺔ اﻟﻨﻮوﯾﺔ ﺑﺎﻟﺼﯿﻦ ,ﺑﺈﺳﺘﺨﺪام ﻣﻜﺘﺒﺎت ﺑﯿﺎﻧﺎت ﻧﻮوﯾﺔ وﺑﺮاﻣﺞ ﺣﺴﺎﺑﯿﺔ ﻣﺨﺘﻠﻔﺔ. .٤دراﺳ ﺔ اﻟﺨﺼ ﺎﺋﺺ اﻟﻨﻮوﯾ ﺔ ﻟﻤﻔﺎﻋ ﻞ اﻷﺑﺤ ﺎث اﻟﺘﺎﯾﻼﻧ ﺪى TRR-1/M1ﻣ ﻦ اﻟﻄ ﺮاز ,TRIGA Mark-III وﺗﺘﻨﺎول اﻟﺪراﺳﺔ ﺛﻼﺛﺔ ﻗﻠﻮب ﺗﺴﺘﺨﺪم ﻧﻮﻋﯿﻦ ﻣﺨﺘﻠﻄﯿﻦ ﻣﻦ اﻟﻮﻗﻮد ﻣﻨﺨﻔﺾ اﻟﺘﺨﺼﯿﺐ ,وﺗﺘﻜﻮن اﻟﻨﺘ ﺎﺋﺞ ﻣ ﻦ درﺟ ﺎت
ﻧﺸﺎطﯿﺔ ﻗﻠﺐ اﻟﻤﻔﺎﻋﻞ ) ρو ,(keffﻛﺜﺎﻓ ﺔ اﻟﻔ ﯿﺾ اﻟﻨﯿ ﻮﺗﺮوﻧﻰ ) ,(Φﻗ ﯿﻢ اﻟﻨﺸ ﺎطﯿﺔ ﻟﻘﻀ ﺒﺎن اﻟ ﺘﺤﻜﻢ ) ,(ρو ﺗﻮزﯾﻌ ﺎت اﻟﻘ ﺪرة ,وﺗﻤ ﺖ ﻣﻘﺎرﻧ ﺔ ﺑﻌ ﺾ اﻟﻨﺘ ﺎﺋﺞ ﻣ ﻊ ﻧﺘ ﺎﺋﺞ ﺗﺠﺮﯾﺒﯿ ﺔ وﻧﺘ ﺎﺋﺞ دراﺳ ﺎت ﺳ ﺎﺑﻘﺔ ﻟﻤﺮﻛ ﺰ اﻷﺑﺤ ﺎث ANLوھﯿﺌ ﺔ اﻟﺘﻜﻨﻮﻟﻮﺟﯿﺎ اﻟﻨﻮوﯾﺔ ﺑﺘﺎﯾﻼﻧﺪ .TINT ﺗﻢ ﺗﻘﺪﯾﻢ اﻟﺪراﺳﺔ ﻓﻰ ﺳﺘﺔ ﻓﺼﻮل :ﯾﺘﻨﺎول اﻟﻔﺼﻞ اﻷول ﻣﻘﺪﻣﺔ ﻋﻦ ﻣﻔ ﺎﻋﻼت اﻷﺑﺤ ﺎث واﻟﺤﺴ ﺎﺑﺎت اﻟﻨﯿﻮﺗﺮوﻧﯿ ﺔ ﻟﺘﻠﻚ اﻟﻤﻔﺎﻋﻼت ,وﺑﻌ ﺾ اﻟﺪراﺳ ﺎت اﻟﺴ ﺎﺑﻘﺔ ﻓ ﻰ ﻧﻔ ﺲ اﻟﻤﻮﺿ ﻮع ,واﻟﮭ ﺪف اﻷﺳﺎﺳ ﻰ ﻣ ﻦ اﻟﺪراﺳ ﺔ .ﯾﺘﻨ ﺎول اﻟﻔﺼ ﻞ اﻟﺜﺎﻧﻰ ﺗﻘﺪﯾﻢ ,وﺑﺼﻮرة ﻣﻔﺼﻠﺔ اﻟﻄﺮق اﻟﻤﺘﺒﻌﺔ ﻹﺟﺮاء اﻟﺤﺴﺎﺑﺎت اﻟﻨﯿﻮﺗﺮوﻧﯿﺔ وﺣﺴﺎﺑﺎت اﻷﻣﺎن ﻟﻤﻔﺎﻋﻼت اﻷﺑﺤﺎث - اﻟﻄ ﺮﯾﻘﺘﯿﻦ اﻟﺘﺤﺪﯾﺪﯾ ﺔ واﻹﺣﺘﻤﺎﻟﯿ ﺔ -وﻣﺰاﯾ ﺎ وﺣ ﺪود ﻛ ﻞ طﺮﯾﻘ ﺔ ,ﺑﻌ ﺪ ذﻟ ﻚ ﺗ ﻢ ﺗﻘ ﺪﯾﻢ اﻟﺒ ﺮاﻣﺞ اﻟﺤﺴ ﺎﺑﯿﺔ اﻟﻤﺨﺘﻠﻔ ﺔ واﻟﻤﺴﺘﺨﺪﻣﺔ ﻓ ﻰ ﺗﻠ ﻚ اﻟﺤﺴ ﺎﺑﺎت وﺗﻮﺿ ﯿﺢ اﻟﻤ ﺪﺧﻼت ,اﻟﻤﺨﺮﺟ ﺎت ,واﻟﺤ ﺪود ,CITVAP ,WIMSD :و اﻟﻤﻜﺘﺒ ﺔ .WLUP-69ﻓﻰ اﻟﻔﺼﻞ اﻟﺜﺎﻟ ﺚ ,ﺗ ﻢ ﺗﻮﺻ ﯿﻒ اﻟﻤﻔ ﺎﻋﻼت واﻟﺨﻼﯾ ﺎ اﻟﻤﺴ ﺘﺨﺪﻣﺔ ﻓ ﻰ اﻟﺪراﺳ ﺔIAEA 10 MW : ,Benchmark Reactorاﻟﺨﻼﯾﺎ TRXو ,BAPLواﻟﻤﻔﺎﻋﻞ ,TRR-1/M1وﺗﻢ ﺗﻮﺻ ﯿﻒ ﺣ ﺎﻻت اﻟﻤﻔ ﺎﻋﻼت اﻟﻤﺨﺘﻠﻔﺔ اﻟﺘﻰ ﯾﺘﻢ ﻋﻨﺪھﺎ اﻟﺪراﺳﺔ .ﻓﻰ اﻟﻔﺼﻞ اﻟﺮاﺑﻊ ﺗ ﻢ ﺗﻮﺿ ﯿﺢ أﺳ ﺒﺎب إﺧﺘﯿ ﺎر طﺮﯾﻘ ﺔ اﻟﺤﺴ ﺎب اﻟﺤﺎﻟﯿ ﺔ ,ﺑﺎﻹﺿ ﺎﻓﺔ اﻟﻰ إﺧﺘﯿﺎر اﻟﺒﺮاﻣﺞ اﻟﺤﺴﺎﺑﯿﺔ اﻟﻤﺨﺘﻠﻔﺔ وﺗﻘﺪﯾﻢ ﻗﺪراﺗﮭﺎ اﻟﺤﺴﺎﺑﯿﺔ ,وﺗﻢ ﺗﻮﺿ ﯿﺢ ﻛﯿﻔﯿ ﺔ إﺳ ﺘﺨﺪام اﻟﺒ ﺮاﻣﺞ ﻓ ﻰ اﻟﺤﺴ ﺎﺑﺎت اﻟﻨﯿﻮﺗﺮوﻧﯿﺔ ,ﻋﻠﻰ ﻣﺴﺘﻮى اﻟﺨﻼﯾﺎ وﻗﻠﺐ اﻟﻤﻔﺎﻋﻞ ,وﺗﻄﺒﯿﻘﮭﺎ ﻋﻠﻰ اﻟﻨﻤﺎذج اﻟﻤﺴﺘﺨﺪﻣﺔ .ﻓﻰ اﻟﻔﺼﻞ اﻟﺨﺎﻣﺲ ﺗﻢ ﻋ ﺮض اﻟﻨﺘ ﺎﺋﺞ اﻟﺨﺎﺻ ﺔ ﺑﺪراﺳ ﺎت اﻟﻤﻌ ﺎﯾﺮة اﻟﻨﯿﻮﺗﺮوﻧﯿ ﺔ ,دراﺳ ﺎت ﻣﻌ ﺎﯾﺮة ﻣﻌ ﺎﻣﻼت اﻷﻣ ﺎن ,دراﺳ ﺔ اﻟﻤﻌ ﺎﯾﺮة ﻟﻤﻜﺘﺒ ﺎت اﻟﻤﻌﻄﯿﺎت اﻟﻨﻮوﯾﺔ ,واﻟﺨﺼﺎﺋﺺ اﻟﻨﻮوﯾﺔ اﻟﺨﺎﺻﺔ ﺑﺎﻟﻤﻔﺎﻋ ﻞ .TRR-1/M1وﯾﺘﻨ ﺎول اﻟﻔﺼ ﻞ اﻟﺴ ﺎدس اﻹﺳ ﺘﻨﺘﺎﺟﺎت اﻟﻤﺒﻨﯿﺔ ﻋﻠﻰ اﻟﻨﺘﺎﺋﺞ اﻟﻤﺴﺘﺨﻠﺼﺔ وﺑﺎﻟﻨﺴﺒﺔ ﻟﻠﮭﺪف اﻟﺮﺋﯿﺴﻰ ﻣﻦ إﺟﺮاء اﻟﺪراﺳﺔ. ﺑﺎﻟﻨﺴ ﺒﺔ ﻟﺪراﺳ ﺎت اﻟﻤﻌ ﺎﯾﺮة اﻟﻨﯿﻮﺗﺮوﻧﯿ ﺔ ودراﺳ ﺎت ﻣﻌ ﺎﯾﺮة ﻣﻌ ﺎﻣﻼت اﻷﻣ ﺎن ,ﺗ ﻢ اﻟﺤﺼ ﻮل ﻋﻠ ﻰ ﻧﺘ ﺎﺋﺞ ﺟﯿ ﺪة ﻟﻠﻤﻌﺎﻣﻼت اﻟﻤﺬﻛﻮرة اﻧﻔﺎ ﺑﺈﺳﺘﺨﺪام طﺮﯾﻘﺔ اﻟﺤﺴﺎب اﻟﺤﺎﻟﯿﺔ ﻓﻰ اﻟﺜﻼﺛﺔ أﺑﻌﺎد ,xyzوذﻟﻚ ﺑﺎﻟﻤﻘﺎرﻧﺔ ﺑﺎﻟﻨﺘﺎﺋﺞ اﻟﻤﺮﺟﻌﯿ ﺔ ﻟﻤﺮاﻛﺰ اﻷﺑﺤﺎث اﻟﻤﺨﺘﻠﻔﺔ ,وﺗﻢ ﺗﻔﺴﯿﺮ وﺟﻮد اﻹﺧﺘﻼﻓﺎت اﻟﻤﺘﻮﻗﻌﺔ ﻣﻊ اﻟﻨﺘﺎﺋﺞ اﻟﻤﺮﺟﻌﯿﺔ ,وﺑﺎﻟﻨﺴ ﺒﺔ ﻟﻠﺸ ﺒﻜﺎت اﻟﻌﯿﺎرﯾ ﺔ TRXو ,BAPLﺗﻢ اﻟﺤﺼﻮل ﻋﻠﻰ ﻧﺘﺎﺋﺞ ﻣﺮﺿ ﯿﺔ ﻟﻠﺤﺴ ﺎﺑﺎت اﻟﻤﺨﺘﻠﻔ ﺔ ﺑﺎﻟﻤﻘﺎرﻧ ﺔ ﻣ ﻊ اﻟﻨﺘ ﺎﺋﺞ اﻟﻤﺮﺟﻌﯿ ﺔ ,وﺑﺎﻟﻨﺴ ﺒﺔ ﻟﺪراﺳﺔ اﻟﻤﻔﺎﻋﻞ TRR-1/M1ﺗﻢ اﻟﺤﺼﻮل ﻋﻠﻰ ﻧﺘﺎﺋﺞ ﺟﯿﺪة ﻟﻠﻤﻌﺎﻣﻼت اﻟﻤﺮﺟﻌﯿﺔ اﻟﻤﺘﺎﺣﺔ ﺧﺎﺻ ﺔ ﺑﺈﺳ ﺘﺨﺪام طﯿ ﻒ ﻧﯿﻮﺗﺮوﻧﺎت ﻣﻜﻮن ﻣﻦ ﺧﻤﺴﺔ ﻣﺠﻤﻮﻋﺎت طﺎﻗﺔ ,وﺗﺮﻛﺖ ﺑﻌﺾ اﻟﻨﺘﺎﺋﺞ ﻹﺟﺮاء ﻣﻘﺎرﻧﺎت ﻣﺴﺘﻘﺒﻠﯿﺔ وﻗ ﺖ إﺗﺎﺣ ﺔ اﻟﻤﺰﯾ ﺪ ﻣﻦ اﻟﻘﯿﻢ اﻟﺘﺠﺮﯾﺒﯿﺔ ﻟﻠﻤﻔﺎﻋﻞ ,وإن ﻛﺎﻧﺖ ذات ﻗﯿﻢ ﻣﻘﺎرﺑﺔ ﻟﻤﻔﺎﻋﻼت أﺑﺤﺎث أﺧﺮى ﻣﻦ ﻧﻔﺲ اﻟﻄﺮاز. ﺗﻢ اﻟﺘﺤﻘﻖ واﻟﺘﺄﻛﺪ ﻣﻦ اﻟﮭﺪف اﻟﺮﺋﯿﺴﻰ ﻟﻠﺪراﺳﺔ ﺑﺼﻮرة ﻛﺒﯿﺮة وﻣﺮﺿﯿﺔ ,وھﻮ إﺟ ﺮاء دراﺳ ﺔ و ﻣﻌ ﺎﯾﺮة ﻗﯿﺎﺳ ﯿﺔ ﻟﻄﺮﯾﻘ ﺔ اﻟﺤﺴ ﺎب اﻟﻨﯿﻮﺗﺮوﻧﯿ ﺔ ﺑﺈﺳ ﺘﺨﺪام طﺮﯾﻘ ﺔ اﻹﻧﺘﺸ ﺎر اﻟﺘﺤﺪﯾﺪﯾ ﺔ ,وﺑﺈﺳ ﺘﺨﺪام اﻟﺒ ﺮاﻣﺞ اﻟﻌﺪدﯾ ﺔ WIMSDو CITVAPو ﻣﻜﺘﺒ ﺔ اﻟﻤﻌﻄﯿ ﺎت اﻟﻨﻮوﯾ ﺔ ,WLUPوذﻟ ﻚ ﻟﺤﺴ ﺎب اﻟﻤﻌ ﺎﻣﻼت اﻟﻨﯿﻮﺗﺮوﻧﯿ ﺔ وﻣﻌ ﺎﻣﻼت اﻷﻣ ﺎن ﻟﻤﻔ ﺎﻋﻼت اﻷﺑﺤ ﺎث اﻟﺤﺮارﯾ ﺔ اﻟﺘ ﻰ ﺗﺴ ﺘﺨﺪم اﻟﻮﻗ ﻮد اﻟﻨﻤ ﻮذﺟﻰ ﻟﻠﻤﻔ ﺎﻋﻼت ﻣ ﻦ اﻟﻨ ﻮع MTRو اﻟﻮﻗ ﻮد ﻣ ﻨﺨﻔﺾ اﻟﺘﺨﺼ ﯿﺐ ﻣ ﻦ اﻟﻨ ﻮع ,TRIGAوذﻟ ﻚ ﻋﻨ ﺪ طﯿ ﻒ ﻧﯿﺘﺮوﻧ ﺎت ﻣﻜ ﻮن ﻣ ﻦ ﺧﻤﺴ ﺔ ﻣﺠﻤﻮﻋ ﺎت طﺎﻗ ﺔ ﻓ ﻰ ﺛﻼﺛ ﺔ أﺑﻌ ﺎد ﻟﻠﻨﻤﺎذج اﻟﻤﺴﺘﺨﺪﻣﺔ .وﺗﻤﺖ اﻟﺪراﺳﺔ ﺑﺼﻮرة أﺳﺎﺳﯿﺔ ﻋﻠﻰ ﻣﻔﺎﻋﻞ اﻟﻮﻛﺎﻟﺔ اﻟﺪوﻟﯿﺔ ﻟﻠﻄﺎﻗ ﺔ اﻟﺬرﯾ ﺔ IAEA 10 MW Benchmark Reactorو اﻟﻤﻔﺎﻋ ﻞ اﻟﺘﺎﯾﻼﻧ ﺪى TRR-1/M1وأظﮭ ﺮت اﻟﻨﺘ ﺎﺋﺞ دﻗ ﺔ وإﻋﺘﻤﺎدﯾ ﺔ ﻋﺎﻟﯿ ﺔ ﺑﺎﻟﻤﻘﺎرﻧ ﺔ ﺑﻤﺜﯿﻼﺗﮭﺎ اﻟﺘﺠﺮﯾﺒﯿﺔ واﻟﻤﺮﺟﻌﯿﺔ.