Hindawi Publishing Corporation Advances in Meteorology Volume 2013, Article ID 508064, 16 pages http://dx.doi.org/10.1155/2013/508064
Research Article Validation of Two MODIS Aerosols Algorithms with SKYNET and Prospects for Future Climate Satellites Such as the GCOM-C/SGLI Jules R. Dim,1 Tamio Takamura,2 Akiko Higurashi,3 Pradeep Kathri,2 Nobuyuki Kikuchi,3 and Takahashi Y. Nakajima4 1
Earth Observation Research Center/JAXA, 2-1-1 Sengen, Tsukuba, Ibaraki 305-8505, Japan Center for Environmental Remote Sensing (CEReS), Chiba University, 1-33 Yayoi-Cho, Inage-Ku, Chiba 263-8522, Japan 3 Center for Environmental Measurement and Analysis, National Institute for Environmental Studies, 16-2 Onogawa, Tsukuba, Ibaraki 305-8506, Japan 4 Department of Network and Computer Engineering, Tokai University, 2-28-4 Tomigaya, Shibuya-ku, Tokyo 151-0063, Japan 2
Correspondence should be addressed to Jules R. Dim;
[email protected] Received 14 April 2013; Revised 10 June 2013; Accepted 11 June 2013 Academic Editor: Harry D. Kambezidis Copyright © 2013 Jules R. Dim et al. This is an open access article distributed under the Creative Commons Attribution License, which permits unrestricted use, distribution, and reproduction in any medium, provided the original work is properly cited. Potential improvements of aerosols algorithms for future climate-oriented satellites such as the coming Global Change Observation Mission Climate/Second generation Global Imager (GCOM-C/SGLI) are discussed based on a validation study of three years’ ˚ (2008–2010) daily aerosols properties, that is, the aerosol optical thickness (AOT) and the Angstr¨ om exponent (AE) retrieved from two MODIS algorithms. The ground-truth data used for this validation study are aerosols measurements from 3 SKYNET ground sites. The results obtained show a good agreement between the ground-truth data AOT and that of one of the satellites’ algorithms, then a systematic overestimation (around 0.2) by the other satellites’ algorithm. The examination of the AE shows a clear underestimation (by around 0.2–0.3) by both satellites’ algorithms. The uncertainties explaining these ground-satellites’ algorithms discrepancies are examined: the cloud contamination affects differently the aerosols properties (AOT and AE) of both satellites’ algorithms due to the retrieval scale differences between these algorithms. The deviation of the real part of the refractive index values assumed by the satellites’ algorithms from that of the ground tends to decrease the accuracy of the AOT of both satellites’ algorithms. The asymmetry factor (AF) of the ground tends to increase the AE ground-satellites discrepancies as well.
1. Introduction The determination of the optical properties of aerosols and their size distribution around the globe has been a significant contemporary research effort of late [1]. Some of the major factors that have enabled this progress are the better spectral and spatial capacities of satellites and ground-based radiometers, the improvement of the aerosol signal filtering methods, the better knowledge of the aerosols particles’ shapes, and so forth. The qualitative and quantitative importance of the data collected through the continuous monitoring of aerosols and their daily global coverage, by various satellites, has permitted a better characterization of the role of the aerosols in the climate dynamics and the understanding of their temporal
and local variation. The most common aerosols optical and physical properties used for this characterization are the AOT, the AE, the particle size distribution, the single scattering albedo (SSA), the aerosol phase function, the asymmetry factor (AF), the refractive index (RI), and so forth. To obtain these aerosols characteristics from satellites’ observations, a detailed model of the aerosols properties is required [2]. The increasing number and spatial expansion of field measurement campaigns and ground sites’ coverage have helped to gather statistically meaningful data for the development of aerosols models. Ground collected data not only serve as preliminary input for aerosols models but also are reliable evaluation and validation tools for aerosols products derived from satellites (GMS-5/SVISSR, NOAA-AVHRR, Terra- and
2 Aqua-MODIS and MISR, OrbView-2/SeaWiFS, ENVISATMERIS, etc.). The objective of these validation studies is to improve the quality of the aerosols properties retrieved from satellites’ observations as well as the confidence level in these products. Since the launch of Terra- and Aqua-MODIS, ground data from AERONET have been used to validate and improve the MODIS AOT over ocean [3] and land [4, 5]. NOAA-AVHRR AOT data have been also evaluated using sun photometers of AERONET and others [6, 7]. The retrieval quality over the ocean of POLDER/ADEOS aerosols measurements has been also conducted through comparisons with AERONET sun photometer data [8]. The increasing accuracy of aerosols products, as a result of all these evaluation/validation and correction studies, could be used to reduce the uncertainties associated with the aerosol radiative forcing of the global climate [9]. Due to the complex and diverse composition, size, structure, and origin of aerosols and though a lot of progress has been made in the satellites’ observations, there are still various challenges for a globally acceptable accuracy of the aerosol optical and microphysical properties of different types of aerosols. The high spectral and spatial resolutions of climate-oriented satellites such as the GCOM-C/SGLI, scheduled to be launched around 2015 by the Japan Aerospace Exploration Agency (JAXA), aim at accomplishing better distinctions between aerosols particles and other atmospheric components. However, the programmed long lifespan of such satellites (3 series) and the connectivity between similar/different satellites’ series will pose other accuracy issues proper to long-term climate observations [10–12] that may only be alleviated with better accuracy retrieval algorithms. In the present study, the potential performance of future satellites’ products is discussed through a validation study of aerosol retrievals by present satellites’ (Terra- and AquaMODIS satellites) algorithms using spectrally compatible channels with those of the coming GCOM-C/SGLI. This validation is conducted against a three-year (2008–2010) daily ground-truth dataset from three SKYNET observation sites (Fukue, Hedo, and Miyako). These ground sites are located in the Pacific East Asian region, an area at the confluence of actively changing and mixed aerosols (natural and anthropogenic particles resulting from rapid industrialization). The retrievals examined are from two algorithms using similar observations, Terra- and Aqua-MODIS satellites’ calibrated radiances (MOD/MYD021, version 5.1). The first algorithm is named here as MODIS-GLI, as it was previously applied to the Global Imager (GLI) onboard the Advanced Earth Observation Satellite-II (ADEOS-II). The second algorithm is the MODIS-NASA algorithm, used for MODIS standard products’ retrievals by the National Aeronautics and Service Administration (NASA). The aerosols properties investigated are the aerosol optical thickness (AOT) and ˚ the Angstr¨ om exponent (AE). The differences between the satellites’ retrievals and ground observations are analyzed, issues plaguing the accuracy of each of these satellites’ algorithms are discussed, and lessons for future satellites’ algorithms improvements, such as the algorithm of the future GCOM-SGLI, are drawn. To conduct this work, the following steps are adopted: (1) the introduction, highlighting the basic
Advances in Meteorology settings and motives of the study; (2) the description of the ground data collection approach and the satellites’ algorithms main features; (3) the presentation of the main characteristics of the aerosols properties of the study area; (4) the validation scheme of the satellites’ retrievals, and, discussion on the uncertainties plaguing these retrievals; (5) the lessons for future satellites’ aerosols products; (6) the summary of the results obtained.
2. Ground Data Collection and Satellites’ Algorithms The analyses conducted in this study aim at validating tropospheric aerosols’ retrievals from two algorithms, using similar observations from both Terra- and Aqua-MODIS satellites. These satellites have spectrally compatible channels with the future GCOM-C/SGLI satellite. This validation study is conducted through a comparison of the satellites’ retrievals with ground-truth measurements from three SKYNET sites: Fukue (32.752∘ N latitude, 128.682∘ E longitude, and 50 m altitude), Hedo (26.867∘ N latitude, 128.249∘ E longitude, and 65 m altitude), and Miyako (24.737∘ N latitude, 125.327∘ E longitude, and 50 m altitude). These sites are islands located in the Pacific East Asian region, south of Japan. The choice of these three locations for the satellites’ retrieved aerosols properties’ evaluation study derives from the fact that they are at the confluence of one of the most complex mixtures of aerosols types. It is known that the Asian atmospheric environment has been worsened rapidly by Asian dust, anthropogenic gases, and aerosols in recent years [13]; it has been also the subject of various aerosols projects. Some of the examples are the Asian-Pacific Regional Aerosol Characterization Experiment (ACE-Asia) [14–16] which was a multiplatform project where aerosols, radiative fluxes measurements were conducted over the East China Sea; and the Atmospheric Brown Cloud East Asian Regional Experiment 2005 [17, 18], with the study of aerosols radiative characteristics and aerosol direct radiative forcing. The SKYNET, whose data are used to validate against the satellite retrievals in this study, is a well-developed and maintained network of climate radiation stations with ground sites spread all over Japan and the East Asian region [17, 19]. It serves for the monitoring of aerosol and cloud properties as well as other weather/climate variables. The basic aerosols properties at the SKYNET sites are obtained from radiation measurements performed with sky radiometers. These radiometers record direct sky radiance intensities at 11 predefined wavelengths (315, 340, 380, 400, 500, 675, 870, 940, 1020, 1600, and 2200 nm) and scattering angles. The measurement frequency is 10 or 15 minutes. The solar directbeam transmission and sky radiance obtained from sky radiometer measurements are used for aerosols properties such as the AOT, the aerosol column size distributions, the complex refractive indices, the single scattering albedo, and the asymmetry factor, at multiple wavelengths. A program package named Skyrad.pack [20] is used for the retrieval of these parameters. The SKYNET helps to extend the global aerosol monitoring from the ground to locations not always
Advances in Meteorology
3
covered by the better known AErosol RObotic NETwork (AERONET). Previous studies have shown a good match between the SKYNET and the AERONET aerosols measurements in areas where both networks coexist, confirming the quality and consistency of the SKYNET measurements. One of these is a study conducted over the Loess Plateau of Northwest China. The study compares the aerosol optical depths at two common wavelengths (675 and 870 nm) observed by the CIMEL sun photometer of the AERONET and those observed by the POM-01 sky radiometer of the SKYNET, based on 703 clear-sky measurements during the year 2009 [21]. The study shows a high correlation coefficient (0.99) and a low relative difference of about 3% between the measurements of the two instruments. Bi et al. [22] also showed a good match between the AOT retrieved by both networks at four major channels (440, 675, 870, and 1020). Both the SKYNET and AERONET aerosols networks have been very often used to validate and refine aerosols models for the satellites’ retrievals [3, 4, 9, 23–26]. The multiplication of ground stations and the improvement of the quality of the data obtained with the introduction of new parameterization schemes in the radiative transfer derivation codes and a more rigorous cloud mask application have increased the confidence level in the use of these groundbased data for satellite products’ validation purpose [25, 27]. In this study, daily aerosol retrievals from both Terraand Aqua-MODIS at 0.5 𝜇m wavelength are analyzed. The matching time and space area between these satellite data and those from the ground stations are ±30 min and 25 km around each ground site (time and space average are applied), respectively. The parameters studied are the AOT at 0.5 𝜇m and the AE from visible channels. The MODIS-NASA data (MOD/MYD04, version 5.1) produce the AOT at 0.55 𝜇m. Based on the wavelength relationship between the AE and the AOT, the latter are interpolated to 0.5 𝜇m, in order to match the retrievals from the MODIS-GLI algorithm and the ground data AOT. The basic retrieval scheme of the MODIS-GLI algorithm over the ocean, described in Nakajima and Higurashi [23], Higurashi and Nakajima [28], and Higurashi et al. [29], uses the visible (0.660 𝜇m) and near-infra-red (0.870 𝜇m) channels to retrieve the AOT. The satellite-received radiances are synthesized in four look-up tables (LUTs) derived from radiative transfer calculations under the Mie theory scheme. The algorithm assumes a complex refractive index (RI = 1.5– 0.005𝑖) and a bimodal size distribution expressed as 2
2 (ln 𝑟 − ln 𝑟𝑛 ) 𝑑𝑉 (𝑟) }, = ∑ 𝐶𝑛 exp {− 𝑑 ln 𝑟 𝑛=1 2𝜎𝑛2
(1)
where 𝑛 is the number of lognormal aerosol modes, 𝑟𝑛 is the median or geometric mean radius at each mode, 𝜎𝑛 is the variance or width of the mode, 𝐶𝑛 represents the particle peak volume concentration of the mode; this is an undetermined parameter to be retrieved from satellite-received radiances. The AOT and the peak ratio 𝛿 of the size distribution are retrieved by comparing measured and theoretical (precalculated LUTs) reflectance values. The optimal values of AOT and 𝛿, that minimize the root mean square deviation between
observed and theoretical reflectance, are iteratively searched. The 𝛿 parameter, representing the contribution of the large particles in the aerosol total load, is used to calculate the AE. For the MODIS-NASA algorithm, the retrieval scheme over the ocean, described by Kaufmann and Tanr´e [30], uses seven wavelengths from 0.47 to 2.13 𝜇m to retrieve the AOT and the volume distribution (in the range of 0.08– 5 𝜇m radius) from measured radiances. LUTs from radiative transfer calculations of the MODIS radiance spectral bands are used to retrieve aerosols parameters at each particle size distribution mode: the small particle mode or accumulation mode particles (5 cases) and the large or coarse mode particles (6 cases). The AOT and the volume distribution are the primarily derived parameters from the algorithm, while the AE is (as in the MODIS-GLI algorithm) a secondarily derived parameter. The AOT is obtained from the measured radiances, by linear interpolation between five optical thickness values of each aerosol particle mode combination. The two modes that give the best selected value (ratio between the modes) are the selected aerosol models for the retrieval.
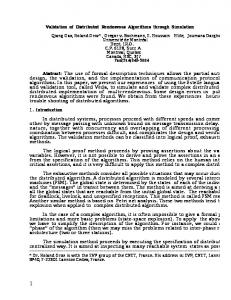
3. Aerosols Characteristics Prior to the evaluation of the satellite retrievals against ground data, a quick description of some of the major characteristics of the aerosols distribution observed in the region covering the ground sites selected for this study may be useful to understand the aerosols of the region. Figure 1 shows the prevailing pattern of the AOT and AE distributions in the region, as retrieved by the MODIS-GLI algorithm during winter (month of January 2010), and the geographical location of the SKYNET ground sites selected. In this figure, the aerosol distribution shows high AOTs near the coastal area of the southwest (adjacent to China) and in the northwest area representing the sea of Japan. But higher AE (finer particles) are visible in the former than the latter. Closer ranges of both AOT and AE can be seen in a north-south band running along the SKYNET sites, with however thicker layers and finer particles in the north than the south. For the three-year data set matching the satellites’ overpass time, the northern site (Fukue) has the thickest aerosols (mean AOT of 0.30 ± 0.23) as well as the finest particles (mean AE of 0.97 ± 0.35). The other 2 sites (Hedo and Miyako) located in the south have mean AOT values of 0.26 ± 0.20 and 0.27 ± 0.15, respectively and AE of 0.95 ± 0.35 and 0.89 ± 0.36, respectively. As we move from the north to the south, that is, further from the major coastal area and towards the central parts of the Pacific Ocean (Figure 1), the aerosol particle size increases (AE values get smaller).
4. Evaluation of Satellites’ Derived Aerosols Data 4.1. Analyses and Results. The previous section examined the aerosols characteristics of the study field, based on ground observations. Now, let us use these characteristics to evaluate the AOT and AE retrievals from the satellites’ algorithms. Figures 2 and 3 present 1 : 1 scatter plots between daily
4
Advances in Meteorology
40N
January 2010 Terra-MODIS AOT from GLI algorithm 2
38N
1.8
36N an Jap
34N
1.6 1.4
32N
1.2
Fukue
30N
1 28N 26N
c cifi Pa ean Oc
Hedo
24N
0.8 0.6 0.4
Miyako 22N
0.2
20N 120E 122E 124E 126E 128E 130E 132E 134E 136E 138E 140E (a) 40N
January 2010 Terra-MODIS AE from GLI algorithm 2
38N
1.8
36N
an Jap
34N
1.6 1.4
32N
1.2
Fukue
30N
1 28N c cifi Pa ean Oc
26N Hedo 24N
0.8 0.6 0.4
Miyako
22N
Table 1: Error analyses showing the root mean square error (RMSE) between the ground data and the satellite derived data for the MODIS-GLI algorithm (GLI RMSE) and the MODIS-NASA algorithm (NASA RMSE), and the simple differences between the ground data and the MODIS-GLI (GLI Dif), then the MODISNASA (NASA Dif) satellites’ algorithms.
0.2
20N 120E 122E 124E 126E 128E 130E 132E 134E 136E 138E 140E (b)
Figure 1: Geographical location of the three SKYNET radiation sites (Fukue, Hedo, Miyako) used in this study to evaluate the satellite retrievals, over an image of satellite derived aerosols properties from the MODIS-GLI algorithm, for the month of January.
aerosols measurements from the ground (SKYNET sites) timely matching the satellite retrievals (from MODIS-GLI and MODIS-NASA algorithms) for the AOT and AE, respectively, during the 3-year study period. Analyses of these plots show that the MODIS-GLI AOT values are systematically overestimated compared to ground data, while the MODISNASA AOT values show a better match with these ground data, as shown by the higher correlation coefficient compared
Sites Fukue Hedo Miyako Sites Fukue Hedo Miyako
AE AOT AE AOT RMSE GLI RMSE GLI RMSE NASA RMSE NASA 0.411 0.214 0.321 0.138 0.535 0.234 0.388 0.147 0.566 0.233 0.384 0.089 Dif GLI Dif GLI Dif NASA Dif NASA 0.181 −0.194 0.065 0.009 0.248 −0.203 0.150 −0.010 0.145 −0.202 0.086 −0.008
to that of MODIS-GLI. In both MODIS-GLI and MODISNASA cases, the dispersion around the 1 : 1 correlation line tends to increase at large AOT values (above 1). For the AE, the graphs of Figure 3 show that the satellites’ retrievals from both algorithms are clearly underestimated. This underestimation is slightly larger with the MODIS-GLI data than with the MODIS-NASA, and its magnitude seems to vary with the proportion of small/large particles’ size of the aerosol load present in the ground data. The distribution of ground AE data appears as two overlapping datasets (around a cutoff value of 0.8) and, the increase in the number of ground data with AE > 0.8 against those with AE < 0.8 leads to an increasing underestimation of the AE by the satellite retrievals. In the large particle group, the satellite particles are smaller in size than the ground data, while in the small particle group, the satellite data are larger in size. And as, in general, small particles tend to be in higher number than large particles, among the ground data, the AE would be underestimated. The determination coefficient in the AE comparison is lower than that in the AOT comparison for both MODIS-GLI and MODIS-NASA cases. Among the 3 ground sites, the best match between the ground and both satellites’ algorithms AOT and AE is at Fukue (northernmost site). Table 1 shows the discrepancies between the ground measurements and the satellites’ retrievals, expressed as the simple difference and the RMSE (root mean square error) of the AOT and AE. At the 3 sites, there are higher AOT RMSEs and biases (against ground observations) with the MODISGLI algorithm (ranges 0.214–0.234 and −0.194– −0.203, resp.) compared to the MODIS-NASA algorithm (ranges 0.089– 0.147 and −0.008–0.009, resp.). The AOT bias of the MODISGLI algorithm is consistently negative, that is, the average AOT from this algorithm is overestimated (by an average of around 0.2), while the bias of the MODIS-NASA shows only a slightly under/overestimated value of around ±0.010. These AOT validation biases confirm the conclusions of Remer et al. [9] indicating that the MODIS-NASA ocean algorithm has virtually no offset and little bias except for a slight underprediction at high AOT, and the linear regression line follows the 1 : 1 line closely.
Advances in Meteorology
5
AOT Fukue versus MODIS-GLI
2
MODIS-NASA
MODIS-GLI
1.5 1 0.5 0
y = 0.7676x + 0.2657 R2 = 0.45
0
0.5
1 Fukue
AOT Fukue versus MODIS-NASA
2
1.5
1.5 1 0.5
y = 0.7214x + 0.0825
0
2
0
0.5
(a)
MODIS-NASA
MODIS-GLI
1 0.5
y = 0.837x + 0.2517 R2 = 0.44
0
0.5
1 Hedo
1.5
1.5 1 0.5 0
2
y = 0.6662x + 0.0951
0
0.5
(c)
MODIS-NASA
MODIS-GLI
1
0
y = 0.8361x + 0.285
0
0.5
1 Miyako
R2 = 0.57 1.5
2
R2 = 0.44 1.5
AOT Miyako versus MODIS-NASA
2
1.5
0.5
1 Hedo (d)
AOT Miyako versus MODIS-GLI
2
2
AOT Hedo versus MODIS-NASA
2
1.5
0
R2 = 0.63 1.5
(b)
AOT Hedo versus MODIS-GLI
2
1 Fukue
2
(e)
1.5 1 0.5 0
y = 0.8722x + 0.0465 R2 = 0.89
0
0.5
1 Miyako
1.5
2
(f)
Figure 2: Scatter diagrams between ground (Fukue, Hedo, Miyako) and satellites’ derived aerosols AOT. Ground data are on the 𝑥-axis while satellite derived data (from both algorithms, MODIS-GLI and MODIS-NASA) are on the 𝑦-axis. AOT is the aerosol optical thickness.
The uncertainty in the AE satellite estimation is expected to be larger than that of the AOT. An expression of this uncertainty is [31] Δ𝛼 =
Δ𝜏 Δ𝜏 1 ( 1 + 2). 𝜏2 ln (𝜆 2 /𝜆 1 ) 𝜏1
(2)
˚ 𝛼 is the Angstr¨ om exponent, and 𝜏1 and 𝜏2 are the aerosol optical thickness at wavelengths 𝜆 1 and 𝜆 2 ; Δ𝛼, Δ𝜏1 , Δ𝜏2 are ˚ the errors in the Angstr¨ om exponent and the aerosol optical thickness at the wavelengths 𝜆 1 and 𝜆 2 , respectively. As a rule, satellite retrievals of aerosol optical thickness are more robust than the corresponding retrievals of aerosol size; consequently, the fraction of the fine mode contribution
to the total optical thickness magnifies relative errors in the retrievals of individual path radiances by up to 4 to 8 times the original percentages [9]. The AE uncertainty values are much closer than the AOT errors; between the two satellites’ algorithms, the RMSE and bias vary from 0.414–0.566 and 0.145–0.248, respectively, for the MODIS-GLI, then 0.321– 0.388 and 0.065–0.150, respectively, for the MODIS-NASA (Table 1). Both algorithms show consistently a positive bias in the AE, that is, smaller AE (larger size of particles) than ground data. Figure 4 presents the comparison between the frequency distribution of the ground measurements and the satellite derived data, for the AE and AOT. The MODIS-NASA algorithm shows the closest AOT distribution range to that
6
Advances in Meteorology
2
1.5
1.5
MODIS-NASA
MODIS-GLI
AE Fukue versus MODIS-GLI
2
1 0.5
y = 0.3895x + 0.4473
AE Fukue versus MODIS-NASA
1 0.5
y = 0.6295x + 0.3217 R2 = 0.37
2
R = 0.27
0
0
0.5
1
1.5
0
2
0
0.5
1 Fukue
Fukue (a)
2
1.5
1.5
MODIS-NASA
MODIS-GLI
AE Hedo versus MODIS-GLI
1
0
y = 0.1941x + 0.5047 R2 = 0.14
0
0.5
1 Hedo
1.5
1 0.5 0
2
AE Hedo versus MODIS-NASA
y = 0.4503x + 0.353
R2 = 0.25 0
0.5
(c)
MODIS-NASA
MODIS-GLI
1.5 1
y = 0.1362x + 0.5875
R = 0.13 0
0.5
1 Miyako
2
1.5 1 0.5
y = 0.3481x + 0.4774 R2 = 0.2
2
0
1.5
AE Miyako versus MODIS-NASA
2
0.5
1 Hedo (d)
AE Miyako versus MODIS-GLI
2
2
(b)
2
0.5
1.5
1.5
(e)
2
0
0
0.5
1 Miyako
1.5
2
(f)
Figure 3: Scatter diagrams between ground (Fukue, Hedo, Miyako) and satellites’ derived aerosols AE. Ground data are on the 𝑥-axis while ˚ satellite derived data (from both algorithms, MODIS-GLI and MODIS-NASA) are on the 𝑦-axis. The AE is the Angstr¨ om exponent.
of the ground data with however a consistently low sensitivity to low AOT values (0.7, contrary also to the ground data peak, which is around 0.3. This MODIS-GLI higher range peak depletes the number of data in the lower AOT ranges and contributes to the AOT overestimation by this algorithm. Concerning the AE, it shows a unimodal distribution (mode at 1.2) at the Fukue ground site while the Hedo and Miyako ground
data distributions appear to be bimodal. This distribution contrasts with that of the two satellites’ algorithms, as they show at all sites a unimodal distribution with the modes consistently at 0.8 (for the MODIS-GLI) and 1.0 (for the MODISNASA), and fewer data are available beyond these modes. This contributes to the underestimation of the AE in the high AE ranges by the 2 satellites’ algorithms, overwhelming the overestimation in the low AE ranges. The comparison of the AOT, then AE seasonal distribution between the ground and satellite data, is shown at Figure 5, as the monthly average of each parameter for the 3year study period. The MODIS-GLI algorithm overestimates the AOT nearly equally each month. A slight inflection of
Advances in Meteorology
7 AOT (Fukue) 35
30
30 Number of data (%)
Number of data (%)
AE (Fukue) 35
25 20 15 10 5 0
25 20 15 10 5
0.2
0.4
0.6
0.8
1
1.2
1.4
0
>1.4
0.1
0.2
0.3
30
30 Number of data (%)
Number of data (%)
35
25 20 15 10 5
0.7 >0.7
0.6
0.7 >0.7
25 20 15 10 5
0.2
0.4
0.6
0.8 1 Ranges
1.2
1.4
0
>1.4
0.1
0.2
0.3
0.4 0.5 Ranges
AOT (Miyako)
AE (Miyako) 35
35
30
30 Number of data (%)
Number of data (%)
0.6
0.5
AOT (Hedo)
AE (Hedo) 35
0
0.4
Ranges
Ranges
25 20 15 10 5
25 20 15 10 5
0 0.2
0.4
0.6
0.8 1 Ranges
1.2
1.4
>1.4
0
0.1
0.2
0.3
0.4 0.5 Ranges
0.6
0.7 >0.7
AOT ground AOT GLI AOT NASA
AE ground AE GLI AE NASA (a)
(b)
Figure 4: Comparison between the frequency distribution of ground measurements and satellite derived (GLI for the MODIS-GLI algorithm, NASA for the MODIS-NASA algorithm) aerosols properties (AE (a), AOT (b)).
this overestimation is seen in summer, around July. There is a better match each month between the MODIS-NASA and the ground data. For the AE, winter months (January, February, March) and summer months (July, August, September), respectively, for the northern site (Fukue) and the southern sites (Hedo
and Miyako), show closer values between the ground and both the MODIS-GLI and MODIS-NASA data. The AE is mostly underestimated by the satellites’ algorithms. But this underestimation is generally within the ground data monthly variation range (standard deviation represented by vertical blue bars on the map).
8
Advances in Meteorology
AOT (Fukue)
1
AE (Fukue)
1.5
1 0.6 AE
AOT
0.8
0.4 0.5
(a)
Dec.
Nov.
Oct.
Sep.
Aug.
Jul.
(b)
AE (Hedo)
AOT (Hedo)
1
Jun.
May.
Apr.
Mar.
Feb.
Jan.
0
Dec.
Nov.
Oct.
Sep.
Aug.
Jul.
Jun.
May.
Apr.
Mar.
Feb.
0
Jan.
0.2
1.5
0.8 1 AE
AOT
0.6 0.4
0.5
(c)
Dec.
Nov.
Oct.
Sep.
Aug.
Jul.
(d)
AOT (Miyako)
1
Jun.
May.
Apr.
Mar.
Feb.
Jan.
0
Dec.
Nov.
Oct.
Sep.
Aug.
Jul.
Jun.
May.
Apr.
Mar.
Feb.
0
Jan.
0.2
AE (Miyako)
1.5
0.8 1 AE
AOT
0.6 0.4 0.5
Ground GLI NASA
Dec.
Nov.
Oct.
Sep.
Aug.
Jul.
Jun.
May.
Apr.
Mar.
Feb.
0
Jan.
Dec.
Nov.
Oct.
Sep.
Aug.
Jul.
Jun.
May.
Apr.
Mar.
Feb.
0
Jan.
0.2
Ground GLI NASA (e)
(f)
Figure 5: Average monthly variation of the ground (Ground) AOT at the 3 SKYNET sites (Fukue, Hedo, Miyako) and the corresponding satellite retrievals: MODIS-GLI (GLI) and MODIS-NASA (NASA). The errors bars (blue) represent the standard deviation of the monthly ground data.
Advances in Meteorology 4.2. Impact of External Factors and Aerosol Model Assumptions on Satellites’ Retrievals. As mentioned before, a prior step in the retrieval of aerosols properties is the choice of an aerosol model. This model is based on various assumptions. The uncertainties in these assumptions will likely affect the accuracy of the aerosols properties retrieved from satellite observations. Some of these uncertainties are the particle size, refractive index, the single scattering albedo, the particle sphericity [30], the satellite sensors’ calibration, the cloud signal (thin clouds or adjacent cloud to the aerosols) interference, the asymmetry factor, and so forth. In this section we will review the contribution of these uncertainties on the accuracy of the satellite aerosols retrievals. Initial evaluations of Terra- and Aqua-MODIS ocean aerosols products, made by Kaufman and Tanr´e [30], suggest that the expected uncertainty for MODIS small AOTs ranges from 0.05 to 0.1 and increases to 20–30% for high AOTs. In Remer et al. [9], the uncertainty is given as ±0.03 ± 0.05 AOT. 4.2.1. Cloud Contamination Effect. Atmosphere areas where aerosols properties are retrieved are supposed to be cloudfree. Examination of Terra- and Aqua-MODIS cloud masks suggest that, even after rigorous cloud screening, the resulting clear-sky dataset could still be contaminated (sometimes by 15% or more) by small clouds [32, 33]. Also, in cloud-free areas, adjacent cloud pixels to clear-sky areas can increase (brightening effect) or decrease (shadowing effect) the intensity of the aerosol radiative signal. The brightening effect is expected to play a more prominent role in these aerosols areas. To discuss the possible effects of cloud contamination on the satellite retrievals, we will examine the variation of an independent variable, the average cloud fraction (CF) in each spatial subarea (the CF is from the MOD/MYD06 version 5.1 MODIS cloud product) where the MODIS-NASA algorithm retrieval was performed, against the change in AE and AOT (both at the ground and satellite levels) then the bias of the satellite retrievals, that is, the difference (GroundMODIS-GLI or Dif GLI and Ground-MODIS-NASA or Dif NASA). Figure 6 shows the results of these relationships. On this figure, the CF data are sorted in 0.1 ranges (i.e., 10% CF). The maximum range is >0.7 (i.e., >70% CF). Let us examine first the possibility of cloud contamination on the AE. The AE ground variation shows that it is nearly steady (no specific trend) along the CF variation ranges, while both the MODIS-NASA and MODIS-GLI AE show a decreasing trend (larger sizes) with the CF increase. Consequently, the AE difference ground-satellite (Dif GLI and Dif NASA) tends to increase with the CF increase. A stronger AE decreasing trend at high CF is observable with the MODIS-GLI than the MODIS-NASA at all sites. These trends show that both satellites’ algorithm retrieved AE appear to be contaminated by clouds. The AOT as the AE shows no specific trend in the ground data variation with the CF. In contrast, the MODISGLI AOT gradually increases with the CF increase while the increase of the latter with the MODIS-NASA AOT is slighter. Consequently, the difference in absolute value between the ground and satellite AOT (Dif GLI for the difference with MODIS-GLI or Dif NASA for the difference
9 with MODIS-NASA) tends to increase, substantially (Dif GLI) or slightly (Dif NASA) with the CF increase. The AOT bias observed here may surpass 0.3 (e.g., at the CF peak of 0.7). The slight trend between the Dif NASA and the CF, found in this study confirms the remarks of Remer et al. [9] that the MODIS monthly mean AOT over the ocean is not significantly cloud contaminated (based on the good agreement between the MODIS-NASA ocean algorithm and 4 AERONET sites’ AOT). For the 3-year dataset, the average cloud amount is higher in the south (58.5% and 60.2% at Hedo and Miyako, resp.) than the north (44.2% at Fukue). And, coincidently, the cloud contamination and the negative bias (Table 1) are lower at the latter area compared to the former areas. The AE and AOT larger biases in the MODIS-GLI than the MODIS-NASA, in relation to the cloud contamination, can be explained by the pixel size selection scale differences between the two algorithms. The MODIS-GLI algorithm retrieves aerosols properties on a pixel-by-pixel basis while the MODIS-NASA algorithm retrievals are made on 10 × 10-pixel boxes (only pixels with the highest noncloudy probability are selected and averaged). This selection process unfortunately reduces the number of data to be analyzed but produces less cloud-contaminated products compared to the pixel-by-pixel retrieval approach adopted by the MODISGLI algorithm. Kaufman and Tanr´e [30] suggest that when the aerosol product is not given on a pixel by pixel basis (0.5 × 0.5 km2 ) but rather over a grid of 10 × 10 km2 or 50 × 50 km2 , clear sky areas used for the determination of aerosols can lead to a cloud contamination of aerosols and therefore contribute to measurement errors of these aerosols properties. Decreasing the spatial resolution for the aerosol product could help to reduce cloud contamination but also enhance the signal-to-noise-ratio (SNR) for the AE retrieval [30, 34]. 4.2.2. Particle Size and Shape Distribution Assumption. In order to convert the aerosol mass measurements to size distributions, a model of the aerosol size distribution as a function of aerosol mass is needed [35]. If “actual” aerosol properties are too different from those assumed by the model, then the satellite retrieved products will be less accurate [36]. For the 3-year study period and at the 3 ground sites examined the distribution is consistently bimodal: small particle mode (accumulation) and large particle mode (coarse) radii. It was noticed that the small mode radius tends to move to higher values with the increase of the particle volume. This creates a larger dispersion (as will be shown later with the standard deviation) of the mode. The average radii of the fine mode ± standard deviation (STD) are 0.15 ± 1.75 𝜇m, 0.16 ± 1.63 𝜇m, and 0.16±1.72 𝜇m and the coarse modes 4.18 ± 2.35 𝜇m, 4.92± 2.27 𝜇m, and 4.72 ± 2.21 𝜇m for Fukue, Hedo, and Miyako, respectively. The accumulation mode radius is nearly similar at the 3 sites (0.15–0.16), and the coarse mode is larger in the south than the north. The STDs within each mode range are also very comparable. The accumulation and coarse modes radii used in the MODIS-GLI algorithm are, respectively, 0.17 ± 1.3, 3.44 ± 2.37. These values are, respectively, higher and lower than those of the ground sites, while their STDs
10
Advances in Meteorology
0.5
1
0.1 0.2 0.3 0.4 0.5 0.6 0.7 >0.7 0.6
AE
0.8 0
0.4
−0.25
0.2 −0.5
Dif GLI Dif NASA AE ground
Hedo (CF versus AE)
0.6 0.5
0
0.1 0.2 0.3 0.4 0.5 0.6 0.7 >0.7
0.4 0.3
−0.25
AE GLI AE NASA
0.2
Dif GLI Dif NASA AOT ground
1.4
0.5
0
CF ranges
AOT GLI AOT NASA
Hedo (CF versus AOT)
0.8
0.25
1 0.8
0
0.1 0.2 0.3 0.4 0.5 0.6 0.7 >0.7 0.6
0.4 0.2
−0.5
0.5
0
CF ranges AE GLI Dif GLI AE NASA Dif NASA AE ground Miyako (CF versus AE)
1
0.4
−0.25
0.2 −0.5
CF ranges Dif GLI Dif NASA AE ground (a)
0 AE GLI AE NASA
AE
0.1 0.2 0.3 0.4 0.5 0.6 0.7 >0.7 0.6
0.6
0.25
0.5 0
0.1 0.2 0.3 0.4 0.5 0.6 0.7 >0.7
0.4 0.3
−0.25
0.2 0.1
0.5
1.4
0.8 0
0.7
−0.5
1.2 0.25
Dif AOT (ground − satellite)
1.2
−0.25
Dif AE (ground − satellite)
0.25
−0.5
AE
Dif AE (ground − satellite)
0.5
0.7
0.1
0
CF ranges
0.8
AOT
0.25
Dif AOT (ground − satellite)
Dif AE (ground − satellite)
1.2
Fukue (CF versus AOT)
AOT
1.4
0
CF ranges
AOT GLI Dif GLI AOT NASA Dif NASA Ground Miyako (CF versus AOT) 0.8 0.7
0.25
0.6 0.5
0
0.1 0.2 0.3 0.4 0.5 0.6 0.7 >0.7
0.4
AOT
Fukue (CF versus AE)
Dif AOT (ground − satellite)
0.5
0.3 −0.25
0.2 0.1
−0.5
CF ranges Dif GLI Dif NASA AOT ground
0 AOT GLI AOT NASA
(b)
Figure 6: Cloud fraction (CF) variation against aerosols properties retrievals from ground (AE and AOT ground), MODIS-GLI (AE and AOT GLI), and MODIS-NASA (AE and AOT NASA). Then CF variation against satellite bias, that is, difference ground-satellite (ground AE or AOT-MODIS-GLI AE or AOT), (ground AE or AOT-MODIS-NASA AE or AOT), during the 3 years of observations. The AE or AOT scales are on the right while the scale of the Dif is on the left.
Advances in Meteorology
11 Hedo (VS /VL )
0.8
0.8
−0.4
Accumulation mode volume ratio
0.35
0.3
0.25
Accumulation mode volume ratio
AE Dif GLI AE Dif NASA
AE ground AE GLI AE NASA
0.2
0.35
0.35
0.3
0.25
0.4
>0.35
−0.4
0.2
0
0.15
0.4
0.15
AE and Dif
1.2
0.35
0.35
0.3
0.25
0.2
0
0.15
0.4
1.52
RIr 0.5 𝜇m
AOT ground AOT GLI
1.52
1.37
>1.52
1.52
1.49
1.46
1.43
1.4
0
1.49
0.2
1.46
0.2
0.6
1.43
AOT and RMSE
0.4
1.37
AOT and RMSE
0.6
0
Hedo (RIr 0.5 𝜇m versus AOT)
0.8
1.4
Fukue (RIr 0.5 𝜇m versus AOT)
0.8
AOT NASA AOT RMSE GLI
(b) Miyako (RIr 0.5 𝜇m versus AOT)
0.6 0.4
AOT ground AOT GLI
>1.52
RIr 0.5 𝜇m
1.52
1.49
1.46
1.43
0
1.4
0.2
1.37
AOT and RMSE
0.8
AOT NASA AOT RMSE GLI
(c)
Figure 8: Real part of the refractive index (RIr) variation at the ground against ground AOT, and the satellite retrieved AOT and AOT RMSE.
MODIS-NASA algorithm. The accuracies of both algorithms for the AE are much closer to each other as well as lower than the AOT accuracies. Some of the factors explaining these accuracy differences range from the cloud contamination, the particle size and shape distribution, the refractive index, and the scattering parameters to the sun-satellite geometry. The lessons drawn from the possible impact of these parameters on satellite retrievals will help to improve the accuracy of future satellites’ aerosols products such as those from the coming GCOM-C/SGLI satellite. The cloud contamination was found to be stronger in the AOT of MODIS-GLI than that of MODIS-NASA. This was explained by the differences in the spatial resolution of the retrievals: pixel-by-pixel retrieval in the MODIS-GLI and pixels’ selection retrieval from boxes of 10 × 10 pixels in the MODIS-NASA. To avoid this contamination in the future and in case the pixel-by-pixel approach is chosen, a cloud fraction analysis should accompany the aerosols retrievals and be used to correct the aerosols properties’ inaccuracies. The MODIS-NASA approach looks attractive as retrievals are made only on the high probability clear pixels of a wider pool of pixels, but the inconvenience is the lower amount
of output data. Changes in aerosols mixtures of the region would need a better representation. For example, this study showed that the aerosol particle radii deviations from the mode should be wider in order to integrate the dynamic processes at the origin of the aerosols of this region. Also, a wider range (than that already used by the MODIS-NASA algorithm) for the refractive indices would be necessary to reduce the uncertainty in the AE. The high spatial and spectral resolution of the GCOM-C/SGLI satellite (e.g., 250 m at all visible and thermal infrared channels) should help to better discriminate clouds from cloud-free areas than actual satellites do and therefore reduce possible cloud contamination of the aerosols products. The improvement in the AOT accuracy will certainly increase that of the AE. The increase in the number of ground sites measurements of aerosols such as in the SKYNET, AERONET, and other networks, providing better quality data and quantitative characterization of aerosols, would be of great asset for the improvement of the assumptions used in aerosols models: predetermined particle size distribution (modes’ radii and volumes), refractive index, asymmetry factor, single scattering albedo, ambient humidity and particle growth, and so forth.
14
Advances in Meteorology Hedo (AF versus AE)
1.2
0.8
0.8
−0.4
−0.4
AF
>0.75
0.75
0.73
AF
AE Dif GLI AE Dif NASA
AE ground AE GLI AE NASA
0.71
0.69
0.67
>0.75
0.75
0.73
0.71
0.69
0.67
0 0.65
0
0.4
0.65
0.4
0.63
AE and Dif
1.2
0.63
AE and Dif
Fukue (AF versus AE)
AE Dif GLI AE Dif NASA
AE ground AE GLI AE NASA
(a)
(b)
Miyako (AF versus AE) 1.2
−0.4
>0.75
0.75
0.73
0.71
0.69
0.67
0
0.65
0.4
0.63
AE and Dif
0.8
AF AE Dif GLI AE Dif NASA
AE ground AE GLI AE NASA (c)
Figure 9: Aerosol asymmetry factor (AF) histogram distribution against AE and the satellites’ algorithms AE, and the difference groundsatellite.
6. Conclusion The quality of aerosols retrievals from future satellites was discussed in this study, through a validation study of aerosols products from actual satellites (Terra- and AquaMODIS) having compatible channels with those of the coming GCOM-C/SGLI. Aerosols products derived from two algorithms (MODIS-GLI and MODIS-NASA) using these satellites were evaluated against ground-truth data from 3 SKYNET sites located in the Pacific East Asian region. The results obtained showed a systematic overestimation of the AOT by the MODIS-GLI and a better agreement between the
ground and MODIS-NASA AOT and AE underestimation by both algorithms. The large particle AE overestimation was overwhelmed by the small particle underestimation. The seasonal variation of the aerosols parameters (AOT and AE) based on monthly averages showed similar trends/variations though the direct values differed, sometimes with MODISNASA or more often with MODIS-GLI. Also nearly constant monthly AOT differences between the ground aerosols data and the satellite retrievals were observed. The AE showed closer values between the ground and satellite data during winter and spring for the Fukue site and summer and autumn for the southern sites (Hedo and Miyako). The effect of cloud
Advances in Meteorology contamination on the satellites retrievals, examined through the use of an independent variable, the cloud fraction, showed that cloud contamination was more pronounced on the AOT MODIS-GLI than that of MODIS-NASA. The AE analysis showed that this parameter decreased (particles get larger) with the CF for both algorithms. The difference in the AOT contamination between the two satellites’ algorithms was found to be mostly due to the retrieval pixel resolution difference: pixel-by-pixel for the MODIS-GLI, therefore higher probability of contamination compared to the pixels’ selection from larger boxes for the MODIS-NASA. Also, this difference could be explained by the fact that the MODIS-NASA uses wider spectral information to estimate the aerosol model and, may perform more accurate retrieval of spectral AOT [36]. The AE distribution showed that when the ground data have a bimodal distribution, the uncertainty in the AE retrievals by the two satellites’ algorithms is higher. The shape of the particle size distribution examined showed larger STDs than those considered by the satellites’ algorithms, leading to limited mixtures in the aerosols sizes retrieved by the satellites’ algorithms. Another contributor to the ground-satellite differences was the uncertainty on the satellite retrievals, due to the asymmetry factor (AF). A negative correlation was found with both the ground AE and the AE difference (ground-satellite) against the AF. The increase of the light scattering in the forward direction is a consequence of the increasing size of the aerosols particles. The real part of the refractive index was found to be correlated with the AOT RMSE of both satellites’ algorithms and not with the AE RMSE. To end this study, some measures aimed at improving the accuracy of future satellites’ algorithms were discussed. These involve remedies to cloud contamination and corrections of the particle size distribution and scattering models.
15
[8]
[9]
[10]
[11]
[12]
[13]
[14]
[15]
[16]
References [1] K. N. Liou, An Introduction to Atmospheric Radiation, Academic Press, 2nd edition, 2002. [2] G. A. d’Almeida, P. Koepke, and E. P. Shettle, Atmospheric Aerosols, Global Climatology and Radiative Characteristics, Deepak, Hampton, Va, USA, 1991. [3] L. A. Remer, D. Tanr´e, Y. J. Kaufman et al., “Validation of MODIS aerosol retrieval over ocean,” Geophysical Research Letters, vol. 29, no. 12, pp. MOD3-1–MOD3-4, 2002. [4] D. A. Chu, Y. J. Kaufman, C. Ichoku, L. A. Remer, D. Tanr´e, and B. N. Holben, “Validation of MODIS aerosol optical depth retrieval over land,” Geophysical Research Letters, vol. 29, no. 12, pp. MOD2-1–MOD2-4, 2002. [5] C. Ichoku, D. Allen Chu, S. Mattoo et al., “A spatio-temporal approach for global validation and analysis of MODIS aerosol products,” Geophysical Research Letters, vol. 29, no. 12, pp. 1–4, 2002. [6] A. Ignatov, L. Stowe, R. Singh, S. Sakerin, D. Kabanov, and I. Dergileva, “Validation of NOAA/AVHRR aerosol retrievals using sun-photometer measurements from R/V akademik vernadsky in 1991,” Advances in Space Research, vol. 16, no. 10, pp. 95–98, 1995. [7] M. Riffler, C. Popp, A. Hauser, F. Fontana, and S. Wunderle, “Validation of a modified AVHRR aerosol optical depth
[17]
[18]
[19]
[20]
[21]
retrieval algorithm over Central Europe,” Atmospheric Measurement Techniques, vol. 3, no. 5, pp. 1255–1270, 2010. P. Goloub, D. Tanr´e, J. L. Deuze, M. Herman, A. Marchand, and F. Breon, “Validation of the first algorithm applied for deriving the aerosol properties over the ocean using the POLDER/ ADEOS measurements,” IEEE Transactions on Geoscience and Remote Sensing, vol. 37, no. 3, pp. 1586–1596, 1999. L. A. Remer, Y. J. Kaufman, D. Tanr´e et al., “The MODIS aerosol algorithm, products, and validation,” Journal of the Atmospheric Sciences, vol. 62, no. 4, pp. 947–973, 2005. A. K. Heidinger, V. R. Anne, and C. Dean, “Using MODIS to estimate cloud contamination of the AVHRR data record,” Journal of Atmospheric and Oceanic Technology, vol. 19, no. 5, pp. 586–601, 2002. M. Jin and R. E. Treadon, “Correcting the orbit drift effect on AVHRR land surface skin temperature measurements,” International Journal of Remote Sensing, vol. 24, no. 22, pp. 4543– 4558, 2003. J. R. Dim, H. Murakami, T. Y. Nakajima, B. Nordell, A. K. Heidinger, and T. Takamura, “The recent state of the climate: driving components of cloud-type variability,” Journal of Geophysical Research D, vol. 116, no. 11, Article ID D11117, 2011. T. Takemura, T. Nakajima, A. Higurashi, S. Ohta, and N. Sugimoto, “Aerosol distributions and radiative forcing over the Asian Pacific region simulated by Spectral Radiation-Transport Model for Aerosol Species (SPRINTARS),” Journal of Geophysical Research D, vol. 108, no. 23, pp. 27–10, 2003. B. C. Bush and F. P. J. Valero, “Surface aerosol radiative forcing at Gosan during the ACE-Asia campaign,” Journal of Geophysical Research, vol. 108, no. D23, p. 8660, 2003. B. J. Huebert, T. Bates, P. B. Russell et al., “An overview of ACE Asia: strategies for quantifying the relationships between Asian aerosols and their climatic impacts,” Journal of Geophysical Research, vol. 108, no. D23, p. 8633, 2003. I. Uno, “Regional chemical weather forecasting system CFORS: model descriptions and analysis of surface observations at Japanese island stations during the ACE-ASIA experiment,” Journal of Geophysical Research: Atmospheres, vol. 108, no. D23, 2003. T. Nakajima, S. Yoon, V. Ramanathan et al., “Overview of the Atmospheric Brown Cloud East Asian Regional Experiment 2005 and a study of the aerosol direct radiative forcing in east Asia,” Journal of Geophysical Research D, vol. 112, no. 24, Article ID D24S91, 2007. T. Takamura, N. Sugimoto, A. Shimizu et al., “Aerosol radiative characteristics at Gosan, Korea, during the Atmospheric Brown Cloud East Asian Regional Experiment 2005,” Journal of Geophysical Research D: Atmospheres, vol. 112, no. 22, Article ID D22S36, 2007. I. Sano, S. Mukai, M. Yamano, T. Takamura, T. Nakajima, and B. Holben, “Calibration and validation of retrieved aerosol properties based on aeronet and skynet,” Advances in Space Research, vol. 32, no. 11, pp. 2159–2164, 2003. T. Nakajima, G. Tonna, R. Rao, P. Boi, Y. Kaufman, and B. Holben, “Use of sky brightness measurements from ground for remote sensing of particulate polydispersions,” Applied Optics, vol. 35, no. 15, pp. 2672–2686, 1996. Y. Liu, J. Huang, G. Shi et al., “Aerosol optical properties and radiative effect determined from sky-radiometer over Loess Plateau of Northwest China,” Atmospheric Chemistry and Physics, vol. 11, no. 22, pp. 11455–11463, 2011.
16 [22] J. Bi, Y. Liu, J. Huang et al., “Characteristics of dust aerosols derived from sky-radiometer over Loess Plateau of Northwest China,” in Proceedings of the 16th CEReS International Symposium on Climate Change Studies through Activities of SKYNET and Virtual Laboratory for Climate Diagnostics, Nago, Okinawa, Japan, October 2010. [23] T. Nakajima and A. Higurashi, “A use of two-channel radiances for an aerosol characterization from space,” Geophysical Research Letters, vol. 25, no. 20, pp. 3815–3818, 1998. [24] A. Higurashi and T. Nakajima, “Detection of aerosol types over the East China Sea near Japan from four-channel satellite data,” Geophysical Research Letters, vol. 29, no. 17, pp. 17–1, 2002. [25] C. Ichoku, Y. J. Kaufman, L. A. Remer, and R. Levy, “Global aerosol remote sensing from MODIS,” Advances in Space Research, vol. 34, no. 4, pp. 820–827, 2004. [26] W. A. Abdou, D. J. Diner, J. V. Martonchik et al., “Comparison of coincident Multiangle Imaging Spectroradiometer and Moderate Resolution Imaging Spectroradiometer aerosol optical depths over land and ocean scenes containing Aerosol Robotic Network sites,” Journal of Geophysical Research D, vol. 110, no. 10, pp. 1–12, 2005. [27] O. V. Kalashnikova and R. A. Kahn, “Mineral dust plume evolution over the Atlantic from MISR and MODIS aerosol retrievals,” Journal of Geophysical Research D, vol. 113, no. 24, Article ID D24204, 2008. [28] A. Higurashi and T. Nakajima, “Development of a two-channel aerosol retrieval algorithm on a global scale using NOAA AVHRR,” Journal of the Atmospheric Sciences, vol. 56, no. 7, pp. 924–941, 1999. [29] A. Higurashi, T. Nakajima, B. N. Holben, A. Smirnov, R. Frouin, and B. Chatenet, “A study of global aerosol optical climatology with two-channel AVHRR remote sensing,” Journal of Climate, vol. 13, no. 12, pp. 2011–2027, 2000. [30] Y. J. Kaufman and D. Tanr´e, “Algorithm for remote sensing of tropospheric aerosol from MODIS. Products: MOD04, MOD08. ATBD reference number: ATBD-MOD-02,” 1998, http://modis.gsfc.nasa.gov/data/atbd/atbd mod02.pdf. [31] F. Wagner and A. M. Silva, “Some considerations about ˚ Angstr¨ om exponent distributions,” Atmospheric Chemistry and Physics, vol. 8, no. 3, pp. 481–489, 2008. [32] T. W. Ault, K. P. Czajkowski, T. Benko et al., “Validation of the MODIS snow product and cloud mask using student and NWS cooperative station observations in the Lower Great Lakes Region,” Remote Sensing of Environment, vol. 105, no. 4, pp. 341– 353, 2006. [33] S. A. Ackerman, R. E. Holz, R. Frey, E. W. Eloranta, B. C. Maddux, and M. McGill, “Cloud detection with MODIS. Part II: validation,” Journal of Atmospheric and Oceanic Technology, vol. 25, no. 7, pp. 1073–1086, 2008. [34] R. Santer and D. Ramon, MERIS Aerosol Remote Sensing over Land ATBD, 2011. [35] J. N. Porter and A. D. Clarke, “Aerosol size distribution models based on in situ measurements,” Journal of Geophysical Research D, vol. 102, no. 5, pp. 6035–6045, 1997. [36] A. A. Kokhanovsky, J. L. Deuz´e, D. J. Diner et al., “The intercomparison of major satellite aerosol retrieval algorithms using simulated intensity and polarization characteristics of reflected light,” Atmospheric Measurement Techniques, vol. 3, pp. 909– 932, 2010. [37] L. Alados-Arboledas, H. Lyamani, and F. J. Olmo, “Aerosol size properties at Armilla, Granada (Spain),” Quarterly Journal of
Advances in Meteorology
[38]
[39]
[40]
[41]
[42]
the Royal Meteorological Society, vol. 129, no. 590, pp. 1395–1413, 2003. L. A. Remer, D. Tanr´e, and Y. J. Kaufman, “Algorithm for remote sensing of tropospheric aerosols from MODIS,” collection 5, 87 pp, 1998. R. C. Levy, L. A. Remer, D. Tanr´e et al., “Evaluation of the MODIS retrievals of dust aerosol over the ocean during PRIDE,” J. Geophys. Res, vol. 108, no. D19, 2003. J. B. Pollack and J. N. Cuzzi, “Scattering by nonspherical particles of size comparable to a wavelength: a new semiempirical theory and its application to tropospheric aerosols,” Journal of the Atmospheric Sciences, vol. 37, pp. 868–881, 1980. R. C. Levy, L. A. Remer, D. Tanr´e, S. Mattoo, and Y. J. Kaufman, “Algorithm for remote sensing of tropospheric aerosols over dark targets from MODIS,” Collections 005 and 051: Revision 2, Feb 2009, Product ID: MOD04/MYD04, 96 pp, 2009. R. C. Levy, L. A. Remer, R. G. Kleidman et al., “Global evaluation of the Collection 5 MODIS dark-target aerosol products over land,” Atmospheric Chemistry and Physics, vol. 10, no. 21, pp. 10399–10420, 2010.
Journal of
International Journal of
Ecology
Journal of
Geochemistry Hindawi Publishing Corporation http://www.hindawi.com
Mining
The Scientific World Journal
Scientifica Volume 2014
Hindawi Publishing Corporation http://www.hindawi.com
Volume 2014
Hindawi Publishing Corporation http://www.hindawi.com
Volume 2014
Hindawi Publishing Corporation http://www.hindawi.com
Volume 2014
Journal of
Earthquakes Hindawi Publishing Corporation http://www.hindawi.com
Hindawi Publishing Corporation http://www.hindawi.com
Volume 2014
Paleontology Journal Hindawi Publishing Corporation http://www.hindawi.com
Volume 2014
Volume 2014
Journal of
Petroleum Engineering
Submit your manuscripts at http://www.hindawi.com
Geophysics International Journal of
Hindawi Publishing Corporation http://www.hindawi.com
Advances in
Volume 2014
Hindawi Publishing Corporation http://www.hindawi.com
Volume 2014
Journal of
Mineralogy
Geological Research Volume 2014
Hindawi Publishing Corporation http://www.hindawi.com
Advances in
Geology
Climatology
International Journal of Hindawi Publishing Corporation http://www.hindawi.com
Advances in
Journal of
Meteorology Hindawi Publishing Corporation http://www.hindawi.com
Hindawi Publishing Corporation http://www.hindawi.com
Volume 2014
Volume 2014
Hindawi Publishing Corporation http://www.hindawi.com
International Journal of
Atmospheric Sciences Hindawi Publishing Corporation http://www.hindawi.com
International Journal of
Oceanography Volume 2014
Volume 2014
Hindawi Publishing Corporation http://www.hindawi.com
Oceanography Volume 2014
Applied & Environmental Soil Science Hindawi Publishing Corporation http://www.hindawi.com
Volume 2014
Hindawi Publishing Corporation http://www.hindawi.com
Volume 2014
Journal of Computational Environmental Sciences Volume 2014
Hindawi Publishing Corporation http://www.hindawi.com
Volume 2014