QUT Digital Repository: http://eprints.qut.edu.au/
vom Brocke, Jan and Mendling, Jan and Recker, Jan C. (2008) Value-oriented process modeling : towards a financial perspective on business process redesign. In: 14th Americas Conference on Information Systems, 14-17 August 2008,
© Copyright 2008 [please consult the authors]
AMCIS Proceedings
AMCIS 2008 Proceedings Association for Information Systems
Year
Value Oriented Process Modeling Towards a Financial Perspective on Business Process Redesign Jan vom Brocke∗
Jan Mendling†
Jan Recker‡
∗ University
of Liechtenstein,
[email protected] University of Technology,
[email protected] ‡ Queensland University of Technology,
[email protected] This paper is posted at AIS Electronic Library (AISeL). † Queensland
http://aisel.aisnet.org/amcis2008/350
vom Brocke et al.
Value-oriented Process Modeling
VALUE-ORIENTED PROCESS MODELING – TOWARDS A FINANCIAL PERSPECTIVE ON BUSINESS PROCESS REDESIGN Jan vom Brocke Hilti Chair of Information Systems and Business Process Management, University of Liechtenstein
[email protected]
Jan Mendling BPM Group, Enterprise Systems Cluster, Queensland University of Technology
[email protected]
Jan Recker BPM Group, Enterprise Systems Cluster, Queensland University of Technology
[email protected] ABSTRACT
To date, typical process modeling approaches put a strong emphasis on describing behavioral aspects of business operations. However, they often neglect value-related information. Yet, such information is of key importance to strategic decisionmaking, for instance in the context of process improvement or business engineering. In this paper we propose a valueoriented approach to business process modeling based on key concepts and metrics from operations and financial management. A simple case study suggests that our approach facilitates managerial decision-making in the context of process re-design. Keywords (Required)
Business Process Management, Value-Oriented Process Modeling, Re-organization, Return on Investment, Total Cost of Ownership, Capital Budgeting INTRODUCTION
Over recent decades, business process management (BPM) has emerged as a popular management approach in information systems and business management practice. BPM has over the last three years continuously been identified as a top business priority and building business process capability continues to be a major challenge for senior executives in the coming years (Gartner Group, 2007). Most notably, BPM practices are employed to improve, re-design or re-engineer existing business operations so as to improve overall effectiveness or efficiency of an enterprise. In fact, a recent survey on BPM initiatives confirmed that 75% of active BPM projects are concerned with process improvement (Palmer, 2007). A key challenge in process improvement projects is the initial discovery and description of the business operations in a manner that is conducive to process improvement (Indulska et al., 2006). In this context, process modeling as an approach to graphically articulate the activities, events or states, and control flow logic that constitute a business process is typically employed to discover existing processes, and document them in a way that helps managers making improvement or change decisions (Recker, 2007). However, the graphical description of events, tasks, control flow logic and the like does actually little in helping managers making change decisions. What is missing in process modeling practice is a focus on business value considerations. More precisely, popular process modeling approaches, such as ARIS (Scheer, 2000), provide a reasonably good understanding of what is happening in the process – but reveal only little about the financial consequences of the operations, and how changes to these operations would contribute – or not – to corporate success. Surprisingly, also existing approaches in process simulation (e.g., Greasley, 2000), or process mining (e.g., van der Aalst, 2005) hardly consider financial information. The question then is how to leverage process modeling for the assessment of the business value of processes (or process changes). In particular, long-term monetary consequences which are influenced by market and resource-related stimuli, should be taken into account for process improvement. In order to assess the value of a process with regard to long-term economic consequences, decisions on the process design have to be considered as an investment (Devaraj and Kohli, 2002).
Proceedings of the Fourteenth Americas Conference on Information Systems, Toronto, ON, Canada August 14th-17th 2008
1
vom Brocke et al.
Value-oriented Process Modeling
Accordingly, the imperative of our research is to identify and to describe the different aspects that contribute to the long-term financial value of a process design. With this focus, our work addresses one potential driver of process re-design – process efficiency and the related exercises of cost-cutting and revenue increasing. Admittedly, we do not consider other, equally important potential drivers for process re-design such as standardization (Davenport, 2005) or compliance management (Nielsen and Main, 2004). Yet, process re-design projects by very are investments (Devaraj and Kohli, 2002), and hence, we consider the value-oriented perspective important so as to be able to estimate, and gauge, the financial success of such projects. In particular, we will propose a framework that distinguishes three levels of evaluation including the operational, the budgeting, and the corporate level. Furthermore, we show how these different financial dimensions can be identified by the help of a process model, and how this financial data relates to process change decisions. Overall, we call this approach valueoriented process modeling. The remainder of this paper sets out to introduce and discuss this approach. We proceed as follows. In the next section we first suggest a framework of financial dimensions of a business process design. We then describe in detail our approach for identifying different financial aspects in business process models by means of exemplary methods. According to a design science approach, we then give a demo example of value-oriented process management in the second to last section. On that basis, we discuss potentials and limitations of our approach and conclude with an outlook to future work in the last section. A GENERAL FRAMEWORK
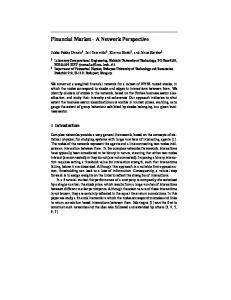
The measurement system presented in this paper distinguishes three levels of evaluation: the operational level, the budgeting level, and the corporate level (see Figure 1). The operational level serves to collect relevant payments associated with a specific process design. The economic value of these payments referring to a company’s situation is subsequently evaluated on the budgeting and on the corporate level. The budgeting level aggregates payments of process designs over time and the corporate level condenses the data to key performance indicators that can form the basis for decision-making.
Example
Level 3
Corporate Level Performance measures for decision support
2
Budgeting Level Economic value created by series of payments aggregated over time
Zeitpunkt 0 1 2 3 4 5 Zahlungsfolge der Investition -18000 -4000 3200 19040 5972 3785 Eigenkapital 9000 Kredit mit Endtilgung + Aufnahme 5000 – Tilgung 5000 – Sollzinsen (inkl. Disagio) 500 300 300 Kontokorrentkredit + Aufnahme 4500 4885 3320 – Tilgung 12705 – Sollzinsen 585 1220 1652 Geldanlage – Anlage 4683 6347 4667 + Auflösung + Habenzinsen 375 882 Finanzierungssaldo 0 0 0 0 0 0 Bestandsgrößen Kreditstand Kredit mit Endtilgung 5000 5000 Kontokorrentkredit 4500 9385 12705 Guthabenstand 4683 11030 15697 Bestandssaldo -9500 -14385 -12705 4683 11030 15697
Zeitpunkt 0 1 2 3 4 5 Zahlungsfolge der Investition -18000 -4000 3200 19040 5972 3785 Eigenkapital 9000 Kredit mit Endtilgung + Aufnahme 5000 – Tilgung 5000 – Sollzinsen (inkl. Disagio) 500 300 300 Kontokorrentkredit + Aufnahme 4500 4885 3320 – Tilgung 12705 – Sollzinsen 585 1220 1652 Geldanlage – Anlage 4683 6347 4667 + Auflösung + Habenzinsen 375 882 Finanzierungssaldo 0 0 0 0 0 0 Bestandsgrößen Kreditstand Kredit mit Endtilgung 5000 5000 Kontokorrentkredit 4500 9385 12705 Guthabenstand 4683 11030 15697 Bestandssaldo -9500 -14385 -12705 4683 11030 15697
TCO ROI
VOFI
1
Operational Level In- and out-payments coming along with the process design during the life-cycle
EPC
Figure 1. Framework for Measuring the Economic Process Value (EPV)
On the operational level payments (out-payments) and receivables (in-payments) are calculated. They can be directly assigned to decisions on the process design (consider, for instance, payments driven by the process performance). Obviously, these payments considered to be relevant in a specific situation may vary according to a specific decision situation. Research in the field of value-based business process management focuses on the analysis of typical situations in order to derive sets of payments representative for certain application areas. On the budgeting level, additional parameters are taken into account for establishing the economic value created by respective series of payments. Relevant parameters are derived from specific conditions of funding and tax obligations that a company has to meet. These series of payments are consolidated over time by applying methods of capital budgeting (e.g., Grob, 1993, Seitz and Ellison, 1999, Shapiro, 2004). This way, a survey of financial consequences is created.
Proceedings of the Fourteenth Americas Conference on Information Systems, Toronto, ON, Canada August 14th-17th 2008
2
vom Brocke et al.
Value-oriented Process Modeling
Finally, on the corporate level, the profitability of a process design and operation has to be judged by condensing the aggregated economic process data into key performance indicators. Measures like the Total Cost of Ownership (TCO) and the Return on Investment (ROI) help to consider relevant parameters for this purpose (Shapiro, 2004, Seitz and Ellison, 1999, Gartner Group, 2003). As for the budgeting and corporate level, well-established measurement systems already exist (e.g., Shapiro, 2004, Grob, 1993). Our framework is designed to integrate these methods from financial management into the context of process redesign. This allows measuring the financial implications of a process design. In doing so, however, the challenge is to find relevant in- and out-payments on the operational level. One promising approach in this context could be the use of Activitybased Costing (e.g., Sapp et al., 1998), which is a method to decompose cost measures alongside the activities of a business process to identify critical cost drivers. Still, we have to note that the notion of ‘corporate success’ typically transcends beyond financial measures. The Balanced Scorecard approach, for instance, takes multiple perspectives into consideration (Kaplan and Norton, 1992). It distinguishes four perspectives of performance measurement, including ’Financial’, ’Customer’, ’Internal Business Processes’, and ’Learning & Growth’. Of these, we focus on the financial perspective, which measures the economic value generated within the other perspectives, in particular by improvements to business processes. In the following chapter, a more detailed introduction into the methods being applied within the framework is given. METHODICAL SUPPORT Preliminaries
This section discusses the systematic consideration of relevant process payments. The basic idea of our approach is based on the observation that in every process, each and every function brings about payments (out-payments) and receivables (inpayments). The approach we propose is to estimate these and aggregate them based on the overall process structure. The method provided in this chapter sets certain assumptions for covering this task:
Costs lead to in- and out-payments. The reason for this is that multiple time periods are considered. Accordingly, factor input and/or creation has long term consequences on capital costs. Capital costs are dependent on capital stock that is influenced by means of payments (and not by means of costs and performances). Costs have to be allocated to a process. Calculating the value of a single process implies that relations to various other processes have to be taken into account. Here, payments are calculated in relation to the process they are caused by.
Against the background of these preliminaries, exemplary methods for the value assessment of business processes on each layer shall now be presented. Measurement on the Operational Level
Payments can be calculated according to different schemas. In this section, basic operations for calculating out-payments are presented. Factors serving as input in the process are identified and assessed. As to the apportionment, factors for both consumption and usage have to be distinguished. Factors of consumption are objects that are consumed by functions. Factors of usage, however, are objects of input that serve as resources for processing a function. They can either be calculated fully or partitioned according to certain keys. The concept of the prevailing calculation is shown in Figure 2 using Event-driven Process Chains (EPC) (Scheer, 2000). The EPC is a modeling technique for the representation of temporal and logical dependencies of activities in a business process. The EPC denotes one of the most popular approaches to process modeling and are heavily used in practice (Davies et al., 2006), which is why we use them for illustration purpose. EPCs include function type elements that can be used to capture activities of a process and event type elements that describe pre- and post-conditions of these functions. Furthermore, there are three kinds of connector types in EPCs to specify the control flow logic of a process. For details refer to (Scheer, 2000). Out-payments of a function are assembled by payments for the required objects of usage as well as the objects of input that were consumed in the execution of the function. We assume that the payments are aggregated per period such that they capture the operational inventory. In order to calculate objects of input, the amount (and type) of the objects applied in the function have to be accounted for. In order to assess out-payments, the amounts have to be multiplied by the cost per unit. The payment for objects of usage is calculated according to the frequency-of-utilization principle. This procedure is similar in application to the procedure of activity-based costing. That is, the percentage of resource-utilization of a function is
Proceedings of the Fourteenth Americas Conference on Information Systems, Toronto, ON, Canada August 14th-17th 2008
3
vom Brocke et al.
Value-oriented Process Modeling
calculated. For this calculation, resource units that are used by a certain function are proportional to the total sum of all units provided by this resource (see Figure 2). Payments related to functions now need to be aggregated for each specific process and each period within the planninghorizon. Generally, payments of all functions have to be added. In case of process branches in which an alternative processing takes place, the probability of branches has to be considered. In order to investigate the probability, relative frequencies can be estimated in which events re-occur when instantiating the process multiple times. While probabilities of all events related to a branch clearly have to sum up to one in case of an XOR connector, the sum of rates can differ from 100% in the case of OR connectors. Calculating Payments
Aggregating Payments
[Ressourceobject.Usage]1,1
[Probability]1
[Probability]3
[Ressourceobject.Cost]1
[Inputobject]1
OR
[Ressourceobject]1
[Event]1
[Event]2
[Event]3
[Ressourceobject]2
[Function. OR]1
[Function. OR]2
[Function. OR]3
[Function]i
[Ressourceobject.Usage]1,2 OR
[Ressourceobject.Cost]2 [Probability]2
[Process.Pa yment]g
[Payment.Inputobject]i
n
q
[Inputobject.Amount]
i, p
[Inputobject.Price] p
p 1
[Function. Payment] [Probabili ty] i
i
i 1
[Payment.Ressourceobject]i m
[Ressourceobject.Usage]
i, j
[Ressourceobject.Cost] j
j 1
[Payment]i [Payment.Inputobject]i [Payment.Ressourceobject]i
Symbols i p j i g
Index for Functions Index for Objects of Input Index for Objects of Resource Index for Functions Index for the Excerpt of a Process
Figure 2. Principles of Calculating and Aggregating Payments on the Basis of Process Models
In order to partition both in- and out-payments on various periods during the phase of operation, constant trend rates can be applied. In addition, special payments can also be planned explicitly and included in the calculation. Measurement on the Budgeting Level
On the budget-level, the financial consequences are measured that are derived by the payments on the operational level. For that purpose, the method of Visualisation Of Financial Implications (VOFI, Grob, 1993) can be applied. Apposed to formulas applied by conventional methods of capital budgeting (e.g., Present Value or Annuity of an Investment Project), VOFI is a computation method that is based on spreadsheets. Hence, a greater flexibility is offered for incorporating individual loan and tax conditions by extending the spreadsheet. A template of an appropriate VOFI is illustrated in Figure 3.
Proceedings of the Fourteenth Americas Conference on Information Systems, Toronto, ON, Canada August 14th-17th 2008
4
vom Brocke et al.
Value-oriented Process Modeling
VOFI for Profitability of Business Processes Point in Time 0 Series of Payments Internal Funds – Withdrawals + Deposits Instalment Loan + Credit Intake – Redemption – Debitor Interest Annuity Loan + Credit Intake – Redemption – Debitor Interest – Creditor Interest Loan in Current Account + Credit Inatake – Redemption – Creditor Interest Financial Investment – Reinvestment + Disinvestment – Debitor Interest Tax Payments – Out-Payment + In-Payment Accounting Balance 0 Balance on instalment loan annuity loan current account financial investment Net Balance
…n…
1
Investment
h
Financing
0
0
0
Balance
Capital Stock [Final Value]
Figure 3. Template for Calculating the Financial Consequences of Processes
The VOFI algorithm may briefly be described as flows: Starting in period zero, each period has to be calculated in a way that there is a balance between in- and out-payments. In the first period, usually an out-payment has to be financed. If the internal funds available are insufficient, a loan has to be taken out. As usual, various conditions for loans can be agreed upon, and also a combination of various loans can be calculated in the VOFI. Correspondingly, multiple forms of funding can be included. As for the calculation above, interest rates for bullet loan, loan in current account and financial investment accounts for 4 per cent, 5 per cent and 3 per cent respectively. In each period, the periodical in- and out-payments have to be balanced. As a check-up, the net funding value, which is defined as the accounting balance of all in- and out-payments, should be zero. On the basis of these flow figures, the capital stock can be updated periodically. The accounting balance for loans and funds finally results in the net balance of the total investment. Within the spreadsheet, the value of an investment in a process design can be monitored for each period during the life-cycle simply by observing the net balance in each relevant period. The net balance of period t=n is then the final value of the investment. Measurement on the Corporate Level
Apart from general measures provided by capital budgeting, other measures can be calculated that tackle special interests associated with process management. A thorough discussion is provided by vom Brocke (2007). Our approach is not restricted to the assessment of single business processes. On the contrary, it can be used to facilitate decision-making between different process designs. And indeed, economic process value in a narrow sense can only be assessed properly when at least two alternatives are compared: taking a certain decision or not taking this decision – or in more practical terms: sticking to the as-is state or implementing a to-be model. In comparing alternative process designs, two different approaches can be applied: a total and a differential calculation (see Figure 4). According to a total calculation scheme, each process is measured independently. The comparison takes place on the corporate level by evaluating the performance measures for each design. This approach gives a high flexibility, as numerous alternatives can be compared. However, the effort of establishing precise value measurements for each design alternative is substantial.
Proceedings of the Fourteenth Americas Conference on Information Systems, Toronto, ON, Canada August 14th-17th 2008
5
vom Brocke et al.
Value-oriented Process Modeling
Comparison of Alternatives
Total Calculation
Differential Calculation
Investment in Process Design
Alternative Investment
Figure 4. Comparing alternative Process Designs
Under the differential calculation scheme, the idea is to focus on additional payments only that are relevant in the comparison of two alternatives (e. g., not the total but only the additional expenditure for the implementation of a to-be model, compared to the current state). In this case, the comparison already takes place on the operational level, so that only one financial plan and set of measures is calculated on the corporate level that represents the added value of one alternative compared to another. The differential approach, however, is limited to pair-wise design comparisons. When comparing more then two alternatives, the amount of comparisons to be assessed is exponentially growing. Following either of both approaches, the resulting measures should be compared with those resulting for alternative investments (the ‘opportunity’). This way, the return of investments in a process design is compared to the return on investments in further fields (similar to a financial investment). Only in comparison the value of a process design can be assessed considering the specific situation of a company. EXEMPLARY APPLICATION
The following situation helps to further reflect on the suggested value-oriented approach to business process modeling. We consider the process »Dialog marketing planning«, in which selected target customers are identified by means of customized marketing measures. The process is supported by means of an in-house data warehouse solution (DW system) and a customer relationship management system (CRM system). Both systems contain some customer data, yet, up to now they are poorly integrated. Customer data stored in the DW system originates from operative systems and is extracted from customer transactions. Data of the CRM system, on the other hand, is recorded from dialogues with customers not having any direct relation to customer transactions. The process starts with the selection of a customer group for which a marketing campaign is to be planned. By passing proper selection criteria to the DW system, a suitable target group can be identified. After assorting the addressees, actuality and validity of customer data is to be checked. This check is necessary since due to potential customer data inconsistencies between the DW system and the CRM system. For the consistency check, queries on customer data of the CRM system have to be executed. The queries yield result lists that have to be compared with the customer data reported by the DW system. In seven out of ten cases, the customer data is consistent and can be employed in subsequent planning procedures. In the remaining 30 % of consistency checks, however, inconsistencies are identified that necessitate corrective activities. A repeated check yields a positive result in the majority of cases, and, hence, no conditional probabilities need to be considered in the calculations. Next, on the basis of consistent customer data, a customer profile is compiled containing all relevant information for the marketing campaign. In particular, the profile comprises turnovers, traveling destination preferences as well as notes taken by customer consultants during face-to-face conversations. After compiling a customer profile, a customer consultant can appoint an individual marketing activity. For this, the CRM system provides suggestions on the basis of past planning activities. As a result, a plan of marketing activities individual to a customer is generated containing specific communication content. The marketing planning completes by documenting the current marketing planning and adding cost estimates. The documentation is saved in the DW system as well as in the CRM system.
Proceedings of the Fourteenth Americas Conference on Information Systems, Toronto, ON, Canada August 14th-17th 2008
6
vom Brocke et al.
Value-oriented Process Modeling
In this situation, an integration of the DW and the CRM system may be considered on a data level. For that purpose, a web service can be implemented that acts as a wrapper and therefore warrants an integrated recording of customer data both in the DW system as well as in the CRM system. This way, customer data selected in the DW system would automatically be available within the CRM system. Next, several opportunities for re-engineering the process of »Dialog marketing planning« arise, ranging from eliminating activities to improving their efficacy. Through integrated data handling the above-mentioned activities associated with consistency checks become obsolete. Moreover, documentation archiving can be automated since the manual input into the CRM system is cancelled. We consider a to-be process model of the planning process by eliminating the activities »Check customer data« and »Correct customer data«. From a structural perspective, this improvement recommendation appears reasonable. However, no evidence is gained as yet concerning the cost-benefit ratio of the effort of introducing web services contrasted to the potential savings due to integration. For that purpose, the value-oriented approach might give insight. The corresponding calculation is illustrated in Figure 5. Selection criteria Customer data (DWH)
Customer data (DWH)
Customer data is consistent
Integration infrastructure
Dialog marketing to be planned Select customer data
Account manager
70%
XOR
CRM system
Customer data (CRM)
Account manager S
CRMSystem
Action list
Cost estimation Action list
Cost estimation
Plan marketing actions
S
Dialog marketing planned
0€
0€ 0€ 0€
0€ 0€ 0€
Operations phase
0€
-200 €
-200 €
-200 €
Adaptation phase
0€
-500 €
-500 €
-500 €
CRM system
Service „Status quo“
2 ...
5
-1.500 €
-1.200 €
-600 €
-200 €
-21.500 €
-1.900 €
-1.300 €
-900 €
0
1
0€
14.609 €
2 ... 17.776 €
5 32.025 €
0
1
0€
48,16 €
52,5 €
94,99 €
2 ...
5
0€
5,22 € 0,25 1,31 € 51,19 €
5,22 € 0,25 1,31 € 93,68 € 94,99 €
CRM system
Account manager
0€ 0€
5,22 € 0,25 1,31 € 41,85 €
Cost charge for service
0€
- cost charge - utilization - payments [per utilization]
48,16 €
52,5 €
Frequency
120
144
249
- process frequency - relative activity frequency
400 0,3
480 0,3
829 0,3
6.300 €
11.399 €
0€
5.179 €
Archive marketing plan
0
1
Service „Status quo“
0€
21,21
Service „Wrapper“
0€
Cost charge (saving)
2 ... 21,25
5 21,38
9,78
9,92
10,33
11,43
11,33
11,05
400 1
480 1
829 1
Frequency
Account manager S
Check cusotmer data
Total payments
Account manager CRMSystem
Marketing actions planned Archive marketing plan
Account manager CRMSystem
Customer profile compiled
0€
0€ 0€ 0€
Total payments
Customer data is inconsistent Correct customer data
S
0€
-8.000 € -7.500 € -5.500 €
Correct customer data
XOR
Compile customer profile
-20.000 €
Total payments
Customer data corrected
Customer profile
-700 €
Human resource development
S
30%
-700 €
- requirements analysis - implementation - test
DW system Account manager
Check customer data
1 -700 €
Development phase
S
Customer data selected
0 -20.000 €
Wrapper development
DW system
- process frequency - relative activity frequency Total payments
Series of payments with Wrapper
0€ -21.500 €
4.573 € 22.461 €
5.440 € 28.216 €
9.157 € ...
51.681 €
Figure 5. Exemplary Calculation of payments on the process level
According to a partial calculation, the savings earned by eliminating the activities »Check customer data« and »Correct customer data« as well as improving efficiency of the activity »Archive marketing plan« are calculated. In addition, the investment to be taken for implementing the web services is also computed and all relevant payments are summed up to the series of payments. The following examples illustrate the computation: The consistency check of customer data is done by an account manager, who uses the CRM system for his work. This activity requires 45 minutes on average. For simplicity, the duration of the activity as well as the time for the utilization of the CRM is considered to be equal. Given the cost charges from above, calculations result in payments of 39,24 € for workforce (= 0,75 hours • 52,33 € per hour) and 3,92 € for system utilization (= 0,75 hours • 5,22 € per hour). In total, payments on the service level for the correction of customer data amount to 43,16 € per execution. Considering approximately 338.48 instances of the process this sums up to 14.609 € within the first period. In period 2 to 5 a progression of both loan costs and process frequency result in an increase of the payments saved up to 32.025 €.
Proceedings of the Fourteenth Americas Conference on Information Systems, Toronto, ON, Canada August 14th-17th 2008
7
vom Brocke et al.
Value-oriented Process Modeling
To date an account manager needed 15 minutes to archive a marketing plan. Since the new wrapper provides for an automated data transfer from DW to CRM system, the activity execution accelerates by five minutes. Hence, for a single execution of an archiving activity 9,54 € have to be accounted. Considering the frequency of activity execution per period, payments accruing within the planning horizon can easily be calculated (e.g., payments amount to –4573 € for the first period). In addition, the frequency of the relevant activities has to be computed. For activity »Correct customer data« the frequency can be calculated by multiplying the overall process frequency with the relative activity frequency. According to the process model depicted in Figure 5, correcting customer data is required in 30% of total process executions. These 30% represent the relative activity frequency for activity »Correct customer data«. Therefore, the actual frequency amounts to 120 transactions in the first period (= 30% * 400 process executions). In order to realize the savings calculated above, a certain investment into the redesign has to be taken into account. These investments are related to the development of a web service (acting as a wrapper) as well as associated activities of reorganization. They sum up to 20,000 EUR in the first period following a sum of 700 EUR in the following periods Consolidating all payments, a series of payments is computed that serves as an interface in order to further compute the monetary consequences on the budgeting and corporate level. The calculation is illustrated in figure 6. Finance plan Series of payments Internal Funds + initial balance - withdrawal + deposit Bullet loan + credit intake - redemption - debtor interest (6 % and 5 % disagio) Loan in Current Account + credit intake - redemption - debtor interest (10 %) Financial Investment + reinvestment - disinvestment + creditor interest
0 -21.500 € 10.000 €
Balances on bullet loan on loan in current account on financial investment Net Balance
2 ... 28.216 €
...
5 51.681 €
0€ 0€
0€ 0€ 0€
0€ ... 0€ 0€
0€ 0€ 0€
11.500 € 0€ 575 €
0€ 0€ 690 €
0€ ... 11.500 € 690 €
0€ 0€ 0€
575 € 0€ 0€
0€ 575 € 57,5 €
0€ ... 0€ 0€
3.309 € 0€ 1.064 €
0€ 0€ 0€
21.489 € 0€ 0€
16496 € ... 0€ 752 €
0€ 0€ 0€
0€ 350 €
280 € ... 0€
0€ 3.609 €
0€
0€
0 € ...
0€
11.500 € 575 € 0€
11.500 € 0€ 21.489 €
0€ ... 0€ 37.895 €
0€ 0€ 98.914 €
- 12.075 €
9.989 €
37.895 ...
98.914 €
Taxes (t=35 %) - payment + refund Net Funding
1 22.461 €
Performance Measures Future value of investment
98.914 €
Future value of opportunity
11.875 €
Net future value
87.039 €
ROI
37,85 %
Figure 6. Exemplary Calculation of payments on the budgeting and corporate
The calculation yields a positive net future value by 98.814 EUR and a Return on Investment of 37.85%. Hence, the initiative to overcome integration shortcomings in the process »Dialog marketing planning« can be recommended from a financial perspective. However, it should be noted that variations of the parameters could result in different recommendations. For example, it can be expected that an increase of out-payments for the wrapper development may lead to an unprofitable integration initiative from a monetary perspective. Apart from this, the saving on the activity »Archive marketing plan« can be influenced significantly by changing the frequency of process executions. We conclude that the methods of value-oriented process modeling serve as a valuable means for decision support. They provide a basis for studies on the monetary consequences of business process re-design rather than for making decisions on single results. This means to analyze the monetary consequences by means of sensitivity analysis, calculating for example results for a best, worst and average case scenario. In addition, we do not recommend taking decisions only on the basis of monetary measures. On the contrary, as further illustrated in the introduction, we rather focus on the financial perspective of an entire decision support system. The results, therefore, have to be weighed with further information relevant for decision making and particularly also comprising qualitative aspects. Hence, even when acting against recommendation gained from a financial perspective, one at least may gain transparency of the “costs” resulting from this decision.
Proceedings of the Fourteenth Americas Conference on Information Systems, Toronto, ON, Canada August 14th-17th 2008
8
vom Brocke et al.
Value-oriented Process Modeling
Conclusion
In this paper we presented and discussed an approach to extend typical process modeling approaches with value-related information. This way, managerial decision-making in the context of process management, most notably process improvement, can better be supported. In turn, our approach presents a stronger business case for process modeling. We showed how process modeling can be leveraged to more cohesively and comprehensively provide stakeholders with the type of information required to assist process change management. The presented research findings have to be contextualized in light of some limitations. Most notably, our elaborations have been of analytical and conceptual nature and lack empirical testing. However, our Endeavour was to amalgamate existing, proven practices from both process management and financial management practice. Nevertheless, we do consider empirical evaluation an essential aspect of our work. Hence we have started to validate our approach by means of case studies with financial sector companies engaging in process improvement initiatives. We hope to present the results at AMCIS 2008. Second, we have not considered other, potentially relevant, non-monetary measures of process change. Clearly, values of culture, training, people, governance, knowledge, resistance to change, leadership and the like also display pertinence to the success of process improvement projects. We do not consider our research complete. We do hope, however, that we made a case towards long-needed extensions of process modeling practice so as to be able to better leverage the graphical articulation of processes for various types of decision-making scenarios. Our work serves as a conceptual cornerstone of knowledge towards more comprehensive – and contextualized – process modeling practice that not only takes into account the mere behavioral aspects of business operations but also puts the design into perspective – in our case into the perspective of long-term financial consequences. As such, we complemented other existing research streams that argue extension to process modeling practice, for process compliance (Rosemann and zur Muehlen, 2005), business rules integration (zur Muehlen et al., 2007), or context management (Rosemann et al., 2008). REFERENCES
1. 2. 3. 4. 5. 6. 7. 8.
9. 10. 11. 12. 13. 14. 15. 16. 17. 18. 19. 20.
Davenport, T. H. (2005) Harvard Business Review, 83, 100-108. Davies, I., Green, P., Rosemann, M., Indulska, M. and Gallo, S. (2006) Data & Knowledge Engineering, 58, 358-380. Devaraj, S. and Kohli, R. (2002) The IT Payoff: Measuring the Business Value of Information Technology Investments, Prentice Hall, New York, New York. Gartner Group (2003) Report and Estimating Tool for K-12 School Districts: Why Total Cost of Ownership (TCO) Matters, Gartner, Inc, Stamford, Connecticut. Gartner Group (2007) Gartner, Inc, Stamford, Connecticut. Greasley, A. (2000) In 32nd Conference on Winter Simulation(Eds, Joines, J. A., Barton, R. R., Kang, K. and Fishwick, P. A.) Society for Computer Simulation International, Orlando, Florida, pp. 2004-2009. Grob, H. L. (1993) Capital Budgeting with Financial Plans: An Introduction, Gabler, Wiesbaden, Germany. Indulska, M., Chong, S., Bandara, W., Sadiq, S. and Rosemann, M. (2006) In 17th Australasian Conference on Information Systems(Eds, Spencer, S. and Jenkins, A.) Australasian Association for Information Systems, Adelaide, Australia. Kaplan, R. S. and Norton, D. P. (1992) Harvard Business Review, 70, 71-79. Nielsen, P. and Main, C. (2004) Insights, 18, 2-12. Palmer, N. (2007) BPTrends. Recker, J. (2007) Australasian Journal of Information Systems, 14, 43-63. Rosemann, M., Recker, J. and Flender, C. (2008) International Journal of Business Process Integration and Management, 3, in press. Rosemann, M. and zur Muehlen, M. (2005) In 16th Australasian Conference on Information Systems(Eds, Campbell, B., Underwood, J. and Bunker, D.) Australasian Chapter of the Association for Information Systems, Sydney, Australia. Sapp, R. W., Crawford, D. M. and Rebishcke, S. A. (1998) The Journal of Bank Cost & Management Accounting, 3, 5362. Scheer, A.-W. (2000) ARIS - Business Process Modeling, Springer, Berlin, Germany. Seitz, N. and Ellison, M. (1999) Capital Budgeting and Long-Term Financing Decisions, Harcourt Brace College Publishers, Fort Worth, Texas. Shapiro, A. C. (2004) Capital Budgeting and Investment Analysis, Prentice Hall, Upper Saddle River, New Jersey. van der Aalst, W. M. P. (2005) Requirements Engineering, 10, 198-211. vom Brocke, J. (2007) International Journal of Web Services Research, 4, 1-32.
Proceedings of the Fourteenth Americas Conference on Information Systems, Toronto, ON, Canada August 14th-17th 2008
9
vom Brocke et al.
Value-oriented Process Modeling
21. zur Muehlen, M., Indulska, M. and Kamp, G. (2007) In 3rd International Workshop on Vocabularies, Ontologies and Rules for The Enterprise(Eds, Taveter, K. and Gasevic, D.) IEEE, Baltimore, Maryland.
Proceedings of the Fourteenth Americas Conference on Information Systems, Toronto, ON, Canada August 14th-17th 2008
10