Verification and Validation of EnergyPlus Conduction Finite Difference and Phase Change Material Models for Opaque Wall Assemblies Paulo Cesar Tabares-Velasco, Craig Christensen, Marcus Bianchi*, and Chuck Booten
*
Current Affiliation: Owens Corning
NREL is a national laboratory of the U.S. Department of Energy, Office of Energy Efficiency & Renewable Energy, operated by the Alliance for Sustainable Energy, LLC.
Technical Report NREL/TP-5500-55792 July 2012 Contract No. DE-AC36-08GO28308
Verification and Validation of EnergyPlus Conduction Finite Difference and Phase Change Material Models for Opaque Wall Assemblies Paulo Cesar Tabares-Velasco, Craig Christensen, Marcus Bianchi*, and Chuck Booten Prepared under Task No. BE12.0103
NREL is a national laboratory of the U.S. Department of Energy, Office of Energy Efficiency & Renewable Energy, operated by the Alliance for Sustainable Energy, LLC.
National Renewable Energy Laboratory 15013 Denver West Parkway Golden, Colorado 80401 303-275-3000 • www.nrel.gov
Technical Report NREL/TP-5500-55792 July 2012 Contract No. DE-AC36-08GO28308
NOTICE This report was prepared as an account of work sponsored by an agency of the United States government. Neither the United States government nor any agency thereof, nor any of their employees, makes any warranty, express or implied, or assumes any legal liability or responsibility for the accuracy, completeness, or usefulness of any information, apparatus, product, or process disclosed, or represents that its use would not infringe privately owned rights. Reference herein to any specific commercial product, process, or service by trade name, trademark, manufacturer, or otherwise does not necessarily constitute or imply its endorsement, recommendation, or favoring by the United States government or any agency thereof. The views and opinions of authors expressed herein do not necessarily state or reflect those of the United States government or any agency thereof. Available electronically at http://www.osti.gov/bridge Available for a processing fee to U.S. Department of Energy and its contractors, in paper, from: U.S. Department of Energy Office of Scientific and Technical Information P.O. Box 62 Oak Ridge, TN 37831-0062 phone: 865.576.8401 fax: 865.576.5728 email: mailto:
[email protected] Available for sale to the public, in paper, from: U.S. Department of Commerce National Technical Information Service 5285 Port Royal Road Springfield, VA 22161 phone: 800.553.6847 fax: 703.605.6900 email:
[email protected] online ordering: http://www.ntis.gov/help/ordermethods.aspx
Cover Photos: (left to right) PIX 16416, PIX 17423, PIX 16560, PIX 17613, PIX 17436, PIX 17721 Printed on paper containing at least 50% wastepaper, including 10% post consumer waste.
Acknowledgments
This work was supported by the U.S. Department of Energy under Contract No. DE-AC36-08GO28308 with the National Renewable Energy Laboratory (NREL). The authors would like to thank Ben Polly and Dane Christensen of NREL, Therese Stovall of Oak Ridge National Laboratory, and Jan Kosny of Fraunhofer Center for Sustainable Energy Systems CSE for their critical reviews, and Ken Childs of Oak Ridge National Laboratory for providing comparative data from Heating 8.0.
iii
Executive Summary
Phase change materials (PCMs) represent a potential technology to reduce peak loads and heating, ventilation, and air conditioning (HVAC) energy consumption in buildings. A few building energy simulation programs have the capability to simulate PCMs, but their accuracy has not been completely tested. This report summarizes NREL’s efforts to develop diagnostic test cases to conduct accurate energy simulations when PCMs are modeled in residential buildings. Overall, the procedure used to verify and validate the conduction finite difference (CondFD) and PCM models in EnergyPlus is similar to that dictated by American Society of Heating, Refrigerating and Air-Conditioning Engineers Standard 140, which consists of analytical verification, comparative testing, and empirical validation. Validation was done in two levels (wall or building) for the two algorithms (CondFD and PCM). The wall-level tests were very detailed and focused on a single wall subjected to particular boundary conditions on both sides for a relatively short duration. In contrast, the whole-house tests focused on an entire building, considering interactions between the building envelope, HVAC, and internal loads for periods that varied from a few days to a year. This process was valuable, as several bugs were identified and fixed in both models. EnergyPlus will use the validated CondFD and PCM models as a basis for version 7.1. This study also includes a preliminary assessment of three residential building envelope technologies containing PCM: PCM-enhanced insulation, PCM-impregnated drywall, and thin PCM layers. These technologies are compared based on peak reduction and energy savings using the PCM and CondFD algorithm in EnergyPlus. Preliminary results using whole building energy analysis suggest that considerable annual energy savings up to 20% could be achieved using PCMs in residential buildings. However, careful design is needed to optimize PCM solutions according to the specific user goals for peak demand and energy use reductions. Optimum design should also include several variables such as PCM properties, location in the building envelope, and local climate. Future research will include more detailed parametric analyses to optimize the cost effectiveness of PCM wall strategies.
iv
Definitions ASHRAE
American Society of Heating, Refrigerating and Air-Conditioning Engineers
CondFD
Conduction finite difference
CTF
Conduction transfer function
HVAC
Heating, ventilation, and air conditioning
LinEnth
Linear enthalpy curve
NonLinEnth
Nonlinear enthalpy curve
NREL
National Renewable Energy Laboratory
PCM
Phase change material
Qin
Inside heat flux
RMSE
Root mean square error
Tin
Inside surface temperature
Tmid
Middle node temperature
v
Table of Contents Acknowledgments........................................................................................................................................ iii Executive Summary ...................................................................................................................................... iv Definitions ..................................................................................................................................................... v Figures ......................................................................................................................................................... vii Tables ......................................................................................................................................................... viii 1
Introduction .......................................................................................................................................... 1
2
EnergyPlus Phase Change Material Model ........................................................................................... 3
3
Verification and Validation ................................................................................................................... 5 3.1
Wall-Level Tests: CondFD .............................................................................................................. 5
3.2
Wall-Level Tests: Phase Change Materials.................................................................................... 6
3.2.1
Analytical Verification: Stefan Problem ................................................................................ 6
3.2.2
Comparative Testing Against Heating 7.3 ........................................................................... 10
3.2.3
Comparative Testing Against Heating 8.0 ........................................................................... 15
3.2.4
Experimental: DuPont Hot Box Experiment ........................................................................ 19
3.3
Building-Level Tests: Conduction Finite Difference .................................................................... 23
3.4
Building-Level Tests: Evaluation of Phase Change Material Model ............................................ 25
3.4.1
Phase Change Material Model Evaluation Using Modified ASHRAE Standard 140, Case 600 ............................................................................................................................. 25
3.4.2
PCM Model Evaluation Using BEopt New House ................................................................ 29
3.5
Conclusions From Verification and Validation ............................................................................ 31
4
Detailed Diagnostics Available for Whole Building Analysis for Phase Change Material Systems Using Verified Phase Change Material Model .............................................................................................. 32
5
Conclusions ......................................................................................................................................... 37
References .................................................................................................................................................. 38 Appendix A. Phase Change Material Properties Used in Experimental Validation .................................... 41 Appendix B. EnergyPlus Conduction Finite Difference and Phase Change Material Algorithms ............... 42
vi
Figures
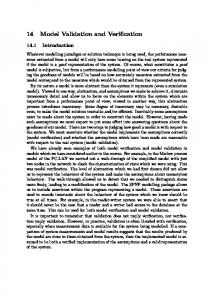
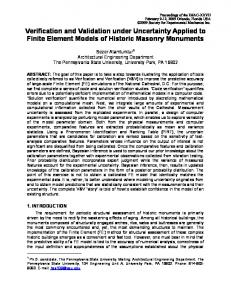
Figure 1. Outside surface heat flux calculated using analytical solution (analytical) and PCM model v6 for three node spacing values (dx, dx/3, dx/9) ......................................................................................... 9 Figure 2. Node temperature 0.105 m from outside surface calculated using analytical solution (analytical) and PCM model v6 for three node spacing values (dx, dx/3, dx/9). ................................ 9 Figure 3. Calculated PCM-Insulation middle node temperature (Tmid) using comparative software (H73), EnergyPlus PCM model with default node spacing (E+), finer mesh (E+dx/3), 2- and 4-min time steps (E+2min, E+4min) and without PCM (E+NoPCM) .................................................................... 12 Figure 4. Inside surface temperature (Tin) calculated using comparative software (H73), EnergyPlus PCM model with default node spacing (E+), finer mesh (E+dx/3), 2- and 4-min time steps (E+2min, E+4min) and without PCM (E+NoPCM) ............................................................................................. 12 Figure 5. Inside heat flux (Qin) calculated using comparative software (H73), EnergyPlus PCM model with default node spacing (E+), finer mesh (E+dx/3), 2- and 4-min time steps (E+2min, E+4min) and without PCM (E+NoPCM). ................................................................................................................. 13 Figure 6. Enthalpy curve for PCM with linear enthalpy curve (LinEnth) and for PCM with nonlinear enthalpy curve (NonLinEnth) used in comparative testing against Heating 8.0 ............................... 15 Figure 7. Calculated PCM-insulation middle node temperature(Tmid) for PCM with linear enthalpy curve using Heating 8.0 explicit solution (H8_Ex), Heating 8.0 implicit solution (H8-Im), EnergyPlus PCM model v7.1 with default node spacing (E+), and EnergyPlus without PCM (E+NoPCM) .................. 16 Figure 8. Calculated PCM-Insulation Tmid for PCM with non linear enthalpy curve using the same legend as Figure 7 ......................................................................................................................................... 16 Figure 9. Calculated Tin for PCM with linear enthalpy curve using the same legend as Figure 7 ............... 17 Figure 10. Calculated Tin for PCM with non linear enthalpy curve using the same legend as Figure 7 ...... 17 Figure 11. Calculated Qin for PCM with linear enthalpy curve using the same legend as Figure 7 ............ 18 Figure 12. Calculated Qin for PCM with non linear enthalpy curve using the same legend as Figure 7 ..... 18 Figure 13. Tested wall configuration with dimensions (in cm) and location of temperature (Temp) and heat flux measurements (HF) ............................................................................................................ 20 Figure 14. Point 3 temperature (see Figure 13) obtained from experimental data (Experiment with uncertainty bars), EnergyPlus v8 PCM model with variable thermal conductivity (E+), EnergyPlus v8 PCM model without PCM (E+noPCM), previous version of EnergyPlus (with PCM) (E+v6)......... 21 Figure 15. Point 5 temperature (see Figure 13) obtained from experimental data (Experiment), EnergyPlus v8 PCM model with variable thermal conductivity (E+), EnergyPlus v8 PCM model without PCM (E+noPCM), previous version of EnergyPlus (v6) ........................................................ 22 Figure 16. Point 5 heat flux obtained from: experimental data (Experiment), EnergyPlus PCM model with variable thermal conductivity (E+), EnergyPlus PCM model without PCM (E+noPCM), and previous version of EnergyPlus (v6) ................................................................................................................. 23 Figure 17. Rendering of BEopt new house simulated ................................................................................. 24 Figure 18. 3-Day Cooling Energy use calculated with EnergyPlus using the CTF and CondFD algorithms. The green line represents differences between the algorithms, with values displayed on the right-Y axis. ........................................................................................................................................ 25
vii
Figure 19. Runtime for lightweight construction using EnergyPlus: v6 (E+v6), v8 (E+V8), v8 with a finer mesh (E+v8 dx/3), v8 with a 2-min (E+v8 2min), and a 4-min time step (E+v8 4min). The Y-axis represents CTFs without PCM (CTF), CondFD without PCM (CondFD), CondFD with PCM distributed in insulation (Insulation), CondFD with PCM between two insulation layers (Ins/PCM/Ins), and CondFD with PCM distributed in drywall (Drywall). ......................................................................... 28 Figure 20. Model evaluation results for annual cooling energy difference using legends as in Figure 19 ............................................................................................................................................ 29 Figure 21. Model evaluation results for monthly cooling electric energy difference for BEopt house using melting ranges specified in Table 9 for Phoenix, Arizona: upper half (Upper Attic) and lower half (Lower Attic) of the attic insulation with PCM, PCM concentrated at the middle of the attic insulation (RCRAttic), wall cavity with PCM distributed in insulation (Walls), PCM concentrated at the middle of the wall cavity insulation (RCRWall), PCM distributed drywall (Drywall) and combination of RCRWall and PCM-Drywall (RCRWall-DW) .............................................................. 30 Figure 22. Model evaluation results for monthly peak cooling electric difference for BEopt house using melting ranges specified in Table 9 for Phoenix, Arizona, using same captions as in Figure 21 ..... 31 Figure 23. Predicted cooling energy savings for multiple PCM strategies for a BEopt house in Phoenix .............................................................................................................................................. 32 Figure 24. Predicted peak cooling reduction for multiple PCM strategies for a BEopt house in Phoenix .............................................................................................................................................. 33 Figure 25. Predicted hourly energy savings from multiple PCM wall applications in April in Phoenix. Right Y-axis shows hourly energy use for house without PCMs (CoolingEner). ............................... 34 Figure 26. Predicted hourly energy savings from multiple PCM wall applications in July in Phoenix. Right Y-axis shows hourly energy use for house without PCMs (CoolingEner). ............................... 35 Figure 27. Predicted heating energy savings from different PCM strategies ............................................. 36
Tables
Table 1. Verification and Validation Procedure ............................................................................................ 5 Table 2. Properties of PCM Strategies Analyzed ........................................................................................... 7 Table 3. Properties of PCM Strategies Analyzed in Comparative Verification ........................................... 11 Table 4. Root Mean Square Error (RMSE) Compared to Heating 7.3 Values for PCM Distributed in Insulation ........................................................................................................................................... 14 Table 5. Differences in Net Heat Gain Over 12 Hours Between Heating 7.3 and Other Models ............... 14 Table 6. RMSE for PCM Distributed in Drywall Compared to Heating 7.3 .................................................. 14 Table 7. RMSE Compared to Heating 8.0 Explicit Solution Values for PCM Distributed in insulation ........ 19 Table 8. Modified Case 600 Materials Properties ....................................................................................... 26 Table 9. Properties of PCM Strategies Analyzed ......................................................................................... 26 Table 10. Thermal Storage of Composite PCMs for Modified House ASHRAE Standard 140, Case 600 .... 27 Table 11. Thermal Storage of Composite PCMs for BEopt New House ...................................................... 30
viii
1
Introduction
Energy can be stored in buildings via sensible, latent, or chemical means. Of these, latent storage using phase change materials (PCMs) has been the focus of multiple building studies and companies because of its greater potential thermal energy storage density compared to sensible storage. Multiple PCMs are commercially available that vary in type (salts, paraffins, fatty acids), encapsulation technology (micro and macro encapsulation), and melting temperatures (covering a range that is useful for building wallboard and enclosure applications (64°–104oF [18°–40oC]). PCMs represent a potential technology for reducing peak loads and heating, ventilation, and air conditioning (HVAC) energy consumption in buildings. Research on PCMs has considered many heat transfer applications during the last two decades, resulting in a considerable amount of literature about PCM properties, indoor temperature stabilization potential, and peak load reduction potential. Buildings PCM-oriented research has investigated two primary applications: passive and active building systems (Khudhair & Farid 2004; Pasupathy, Velraj & Seeniraj 2008; Tyagi & Buddhi 2007; Sharma, Tyagi, Chen & Buddhi 2009; Wang, Zhang, Xiao, Zeng, Zhang & Di 2009). Previous PCM studies have shown important benefits related to thermal comfort, energy savings, and perhaps HVAC downsizing when thermal storage is added into buildings (Zhu, Ma & Wang 2009). Early numerical studies analyzed PCM wallboards during the late 1970s and 1980s, mainly for PCM-impregnated wallboard applications (Drake 1987; Solomon 1979). Later numerical studies used PCM thermal properties obtained from differential scanning calorimetry techniques and from measurements of temperature profiles across impregnated PCM wallboard (Kedl 1990; Athienitis et al. 1997). More recent studies of PCM wallboards have analyzed building elements containing microencapsulated PCM. One study compared the performance of a detailed model considering a solid-liquid interface against a simpler model using an equivalent heat capacity model. Overall, the equivalent heat capacity method performed better compared to experimental data (Ahmad, Bontemps, Sallée and Quenard 2006). Another study found the optimum time and space steps for a specific PCM using the heat capacity method, differential scanning calorimetry material property data, and an implicit finite difference model (Kuznik, Virgone & Roux 2008). A follow up study concluded that hysteresis should be considered in the numerical simulations to improve the overall accuracy of the model (Kuznik & Virgone 2009). Numerical research about PCM-enhanced building enclosure systems has followed a similar approach to that used for the wallboard arrangements, analyzing a building enclosure system containing PCM between two layers of insulation (Petrie, Childs, Christian, Childs & Shramo 1997; Halford & Boehm 2007). These studies focused on understanding the physics behind PCMs, including validating models and investigating heat flux reduction potential using special laboratory and small-scale test rooms. Other studies have attempted to estimate potential energy savings through building energy simulation. Energy simulation studies analyzing energy and peak load benefits from PCMs have used commercial building energy simulation software such as CoDyBa (Virgone et al. 2009), ESP-r (Heim & Clarke 2004; Schossig, Henning, Gschwandera & Haussmann 2005; Heim 2010), and TRNSYS (Stovall & Tomlinson 1995; Koschenz & Lehmann 2004; Ibáñez, Lázaro, Zalba & Cabeza 2005). The implemented models varied from early PCM models (Tomlinson & Heberle 1990; Stovall & Tomlinson 1995), to empirical models using an
1
equivalent heat transfer coefficient (Ibáñez et al. 2005), to fully implemented finite difference models (Koschenz & Lehmann 2004; Pedersen 2007) and control volumes models (Heim & Clarke 2004). Predictions from these studies included no significant energy benefits (Pedersen 2007); improved thermal comfort and decreased peak load (Tomlinson & Heberle 1990; Stovall &Tomlinson 1995); and 90% reduction of heating energy demand during the heating season (Heim& Clarke 2004). Likewise, an energy simulation study focusing on building enclosure systems predicted 19%–57% peak load reduction for an attic system consisting of a PCM sandwiched between two conventional insulation layers (Halford & Boehm 2007). In conclusion, PCMs have different benefits depending on their quantity and type (phase change temperature, energy storage capacity), location (drywall, walls, attic, and floor) and climate (heating and/or cooling performance). Therefore, there are clear differences between the methods and results from previous research efforts as: (1) most of the reviewed building energy simulation studies did not perform comprehensive model PCM validation (except a TRNSYS model that works for certain exterior PCM applications) (Kuznik et al. 2008); and (2) previous studies do not cover a wide range of PCM types, locations, and climates. Thus, there is a simulation and analysis gap with respect to PCM benefits and modeling. As a result, the objective of this study is to verify, validate, and improve (if necessary) the EnergyPlus PCM model that has yet not been fully validated. This procedure will be performed using analytical and comparative verifications and empirical validation of three PCM applications: •
PCM distributed in drywall
•
PCM distributed in fibrous insulation
•
Thin, concentrated PCM layers.
2
2
EnergyPlus Phase Change Material Model
EnergyPlus can simulate PCMs only with the conduction finite difference (CondFD) solution algorithm. CondFD discretizes walls, floors, and ceilings into several nodes and uses an implicit finite difference scheme to numerically solve the appropriate heat transfer equations (EnergyPlus 2010). The CondFD algorithm in EnergyPlus uses an implicit finite difference scheme, where the user can select Crank-Nicholson or fully implicit. Equation 1 shows the calculation method for the fully implicit scheme for a homogeneous material with uniform node spacing. 𝐶𝑝 𝜌Δx
𝑗+1
𝑇𝑖
𝑗
−𝑇𝑖
Δ𝑡
= 𝑘𝑊
𝑗+1
𝑗+1
�𝑇𝑖+1 −𝑇𝑖 Δx
�
+ 𝑘𝐸
𝑗+1
𝑗+1
�𝑇𝑖−1 −𝑇𝑖 Δx
�
(1)
Where, 𝑘𝑊
𝑗+1
𝑗+1
j+1
j+1
+ 𝑘𝑖 �𝑘 = 𝑖+1 2
kE =
𝑘𝑖 =
�
�k i−1 + k i � 2
𝑗+1 𝑘�𝑇𝑖 �,
if thermal conductivity is variable
T = temperature i = node being modeled i+1 = adjacent node to interior of construction i-1 = adjacent node to exterior of construction j+1 = new time step j = previous time step Δt = time step Δx = finite difference layer thickness Cp = specific heat of material ρ = density of material
In the CondFD algorithm, all elements are divided or discretized automatically using Equation 2, which depends on a space discretization constant (c), the thermal diffusivity of the material (α), and the time step. Users can leave the default space discretization value of 3 (equivalent to a Fourier number (Fo) of 1/3) or input other values.
3
Δx = √c ∙ α ∙ Δt = �
α∙ Δt
(2)
Fo
For the PCM algorithm, the CondFD method is coupled with an enthalpy-temperature function (Equation 3) that the user inputs to account for enthalpy changes during phase change (Pedersen 2007). The enthalpy-temperature function is used to develop an equivalent specific heat at each time step. The resulting model is a modified version of the enthalpy method (Pedersen 2007). (3)
h = h(T) Cp∗ (T) =
j
j−1
hi −hi j
(4)
j−1
Ti −Ti
Where
h = enthalpy
4
3
Verification and Validation
Accurate modeling of PCMs requires validation of the PCM and CondFD algorithms. This validation work is being completed at the National Renewable Energy Laboratory (NREL) following American Society of Heating, Refrigerating and Air-Conditioning Engineers (ASHRAE) Standard 140 and NREL validation methodologies, which consist of analytical verification, comparative testing, and empirical validation (Judkoff & Neymark 2006). Fixes in EnergyPlus were gradually implemented as they were fixed: from version 5 to the 2012 release version 7.1. The final PCM model considered for verification and validation is a modified version of EnergyPlus 6.0.0.037 that includes all fixes from the CondFD verification (TabaresVelasco & Griffith 2011). This version will be referred as “v6” in this report. The new and improved PCM/CondFD model will be referred as version “v8,” or “v7.1” as the fixes that will be described later in this publication were not included in the 2011 EnergyPlus version 7 release due to time constraints. The fully validated model in EnergyPlus is included in v7.1. Validation was done in two levels (wall or building) with the two algorithms (CondFD and PCM), as shown in Table 1. Table 1. Verification and Validation Procedure Verification/Validation Level
Wall
CondFD Analytical: • Variable k • Composite wall • Const heat flux (2) • Periodic BC • Symmetry Comparative: • H7.3 transient variable k • H7.3 transient multilayer wall
Building
Comparative: • ASHRAE 140 Case 600 2 • BEopt retrofit house • BEopt new house 3
PCM Analytical: • Stefan Problem Comparative: • Heating 7.3 1 Empirical: • DuPont Hotbox
Evaluation: • ASHRAE 140 Case 600 • BEopt new house
3.1 Wall-Level Tests: CondFD The wall-level tests were very detailed tests that focused on a single wall subjected to particular boundary conditions on both sides for a relatively short time. Thus, the wall-level validation tested the ability of only the specific CondFD and PCM algorithms to accurately model building envelope applications). 1
Heating 7.3 is a multidimensional, finite difference heat conduction program that can simulate materials with variable thermal properties and other features. 2 ANSI/ASHRAE Standard 140-2004: Standard Method of Test for the Evaluation of Building Energy Analysis Computer Programs. 3 EnergyPlus models were generated using Building Energy Optimization (BEopt) according to the Building America 2010 Benchmark.
5
The wall-level tests shown in Table 1 for CondFD consisted of eight test cases that were found to be useful for quality control of energy simulation models. In these cases CondFD was examined, debugged, and verified using these test cases. All test cases relate to diagnosing errors in conduction heat flux algorithms and how they interact with respective boundary conditions. The test cases tend to resemble laboratory-based heat transfer experiments on a single surface rather than a full thermal zone that resembles a building or thermal test cell. The proposed test cases offer additional diagnostic power for repairing coding errors in the area of variable thermal conductivity, Neumann boundary conditions, and transient boundary conditions. These additional test cases complement ASHRAE 140 and ASHRAE 1052-RP and are useful additions to that standard method of test. Overall, more than six programming bugs were found and fixed that ranged from minor incorrect reporting of some variables to more serious problems in the CondFD model, including: (1) stability issues caused by the time marching scheme; (2) improper thermal conductivity evaluation when it is variable; and (3) incorrect timing for when the transient history terms are updated. The authors have also added to EnergyPlus version 7 the ability to control the following features: (1) the time marching scheme (Crank-Nicholson or fully implicit); (2) the value of the constant (“3” in Equation 1) used to set space discretization, by essentially making the inverse of the Fourier number an input; and (3) values for the maximum and minimum limits for convection surface heat transfer coefficients (Tabares-Velasco and Griffith 2011). Appendix B shows input settings for CondFD. 3.2 Wall-Level Tests: Phase Change Materials The wall-level tests shown in Table 1 for PCMs consisted of three test cases representing analytical verification, comparative testing, and empirical validation. Thus, the PCM model was verified using: (1) an analytical solution from the Stefan Problem as generalized by Franz Neumann (Carslaw & Jaeger 1959); (2) a numerical solution of a sine wave problem using a verified PCM model from Heating 7.3 (Childs 2005); and (3) experimental data from a hot box apparatus (Haavi, Gustavsen Cao, Uvsløkk & Jelle 2011). Moreover, the PCM model is tested for building envelope applications only, as heat diffusion and storage in the walls and attic were considered in the verification and validation. It is important to mention that: (1) the PCM model was not fully validated before; and (2) that the validation and verification process is not calibrating or evaluating the model, because the model input would not be changed or tuned as a result of the verification. As a result, the PCM verification and validation process found two programming bugs. The first caused stability problems with the EnergyPlus v6 PCM model and was fixed using an automatic under-relaxation factor. The other bug related to the simultaneous use of PCMs and variable thermal conductivity (Tabares-Velasco, Christensen & Bianchi 2012). 3.2.1 Analytical Verification: Stefan Problem The first verification test was the analytical solution to the “Stefan Problem” developed by Neumann for a semi-infinite wall. The solution assumptions are: •
The wall is initially at uniform temperature with PCM in the liquid form above the melting temperature (T(x,t)>Tmelting).
•
Suddenly at time = 0, the wall outside surface temperature drops to 0oC (T(0,t)= 0oC).
6
•
PCM density is equal and constant in both the liquid and solid phases.
•
PCM thermal conductivity and specific heat are constant in each phase and can differ between the solid and liquid phases.
•
PCM has a fixed melting temperature (no melting/freezing range) (Carslaw & Jaeger 1959).
The analytical solution was used to test the v6 PCM model for the three PCM applications, assuming the properties and characteristics shown in Table 2. Specific details include: (1) a simulated construction with one zone having only one wall; and (2) the walls were initially at a homogenous temperature of 50oC and had a melting temperature range of 29.4–29.6oC to approximate the fixed melting temperature assumption in the Stefan Problem. The semiinfinite wall was simulated by a thick wall, thus all surface temperatures were set in EnergyPlus using the “OtherSideCoefficient” feature; the indoor air temperature was set to the desired temperature and the inside convective heat coefficient was set to 1000 W/m2C. More details about similar approaches are in the literature (Tabares-Velasco & Griffith 2011). Table 2. Properties of PCM Strategies Analyzed Properties
PCM Distributed Insulation
PCM Distributed Drywall
Concentrated PCM Layer
% Weight of Microencapsulated PCM in Wall Layer
20%
30%
100%
Equivalent Latent Heat of Wall Layer
9.5 Btu/lb (34 kJ/kg)
14 Btu/lb (33 kJ/kg)
56 Btu/lb (130 kJ/kg)
Melting Temperature Range
84.9o–85.3oF (29.4o–29.6oC)
Thermal Conductivity
0.2337 Btu in./(h∙ft∙R) (0.0337 W/mK)
1.595Btu in./(h∙ft∙R) (0.23 W/mK)
1.109 Btu in./(h∙ft∙R) (0.16 W/mK)
Density
1.8 lb/ft3 (29 kg/m3)
62.4 lb/ft3 (1000 kg/m3)
53.1 lb/ft3 (850 kg/m3)
Specific Heat
0.229Btu/lb∙R (960 J/kg K)
0.334 Btu/lb∙R (1400 J/kg K)
0.597 Btu/lb∙R (2500 J/kg K)
Thickness
4 in. (0.105 m)
4/5 in. (0.020 m)
1/5 in. (0.005 m)
Default Node Spacing
2/3 in. (0.015 m)
1/5 in. (0.005 m)
1/5 in. (0.005 m)
As Table 2 shows, each PCM application was simulated in EnergyPlus as a wall with a thickness representative of typical material configurations. Further details follow: •
The distributed PCM in the insulation represents a 0.105-m layer of insulation that could be installed in a wall cavity or attic. In this study, the simulated wall was 1.5 m thick to meet the semi-infinite wall condition required by the Neumann solution. However, only the first 0.105 m was considered when comparing simulations to the analytical solution, as this represents thickness of a PCM-enhanced portion on a wall cavity. 7
•
The distributed PCM in drywall represents a 0.02-m layer of drywall. In this study, the simulated wall was 0.3 m thick to meet the semi-infinite wall condition required by the Neumann solution. However, only the first 0.02 m was considered when comparing simulations to the analytical solution, as this represents the PCM-enhanced portion of the wall.
•
The concentrated PCM represents a 0.005-m layer that could be installed between two layers of insulation or between insulation and drywall. In this study, the simulated wall contained only concentrated PCM and was 0.155 m thick to meet the semi-infinite wall condition required by the Neumann solution. However, only the first 0.005 m was considered when comparing simulations to the analytical solution, as this represents the PCM-enhanced portion of the wall.
All three numerical and analytical solutions show similar results; the PCM model also behaves similarly between cases. For this reason, detailed results are shown here for the PCM-enhanced insulation only. Figure 1 and Figure 2 show results for three node spacing values: 0.015 m (the default, dx), 0.005 m (dx/3), and 0.00167 m (dx/9), which are obtained using a Fourier number equal to 1/3, 3, and 26. These Fourier numbers seem high and would cause problems if an explicit scheme had been chosen. However, this study used the fully implicit scheme, which can work with higher Fourier numbers and steadily decays to convergence (Waters & Wright 1985; Hensen & Nakhi 1994). Figure 1 shows how the v6 PCM model solution for the coarsest grid (dx) oscillates around the analytical solution: the temperature from the PCM model suddenly increases, followed by almost constant or flat behavior around the analytical solution. This behavior was observed at the coarsest node spacing value in each solution for the three PCM applications. It was also observed in each solution for the three PCM applications, but with a lesser magnitude, in the other node spacing cases (dx/3 and dx/9). The reason for this oscillatory behavior is mainly numerical; the solution to this problem requires a fine mesh to properly simulate heat wave propagation through the PCM with a fixed melting temperature.
8
-10
Analytical
PCMv6 dx
PCMv6 dx/3
PCMv6 dx/9
Heat Flux (W/m2)
-30 -50 -70 -90
-110 -130 -150 1
11
21
31 Time (min)
41
51
Figure 1. Outside surface heat flux calculated using analytical solution (analytical) and PCM model v6 for three node spacing values (dx, dx/3, dx/9)
Analytical
PCMv6 dx
PCMv6 dx/3
PCMv6 dx/9
Temperature (oC)
50 48 46 44 42 40 1
11
21
31 Time (min)
41
51
Figure 2. Node temperature 0.105 m from outside surface calculated using analytical solution (analytical) and PCM model v6 for three node spacing values (dx, dx/3, dx/9).
This study also analyzed the model stability and convergence by recording the number of iterations required for the PCM model to converge. In the three discretization cases, the solution did not converge when a node entered or left the melting range. Thus, after CondFD passed the maximum allowable iterations, the solution did not meet the convergence criteria. Therefore, the 9
PCM model used the values from the last iterations and moved to the next time step even though it did not converge. This problem did not cause any significant accuracy issues for the three cases tested because of the small time step used, but did increase the runtime significantly, taking 6, 15, and 66 min to simulate the wall for 2 days in the dx, dx/3, dx/9 scenarios, respectively. The convergence problem was solved by adding an automatic and dynamic under-relaxation factor after a determined number of iterations. This new under-relaxation factor did not affect the accuracy of the PCM model and reduced the runtime 60%–90% relative to the v6 model. It is important to mention that the semi-infinite wall problem stated by the Neumann solution is very demanding and challenging from a numerical point of view. A very close match was obtained with only Heating 7.3, using a time step of 0.01 s and node spacing roughly 0.01 times the default size in EnergyPlus. These values are stricter than values that have been recommended in previous studies (Kuznik, Virgone & Johannes 2010); they are likely too strict and impractical for modeling more realistic PCM-enhanced wall configurations in annual building simulations. As a result, it is important to verify the PCM model with more realistic wall and boundary conditions. However, there is no analytical solution for this case, so comparative testing using another verified numerical model is needed. 3.2.2 Comparative Testing Against Heating 7.3 The analytical verification allowed for the detection of runtime issues and identification of node spacing requirements for an extreme circumstance with a large and sudden temperature drop. The last test is useful as a quality assurance tool but not for a performance-based tool. Thus, the next step in the verification process was comparative testing relative to the ideal PCM model in Heating 7.3. This model was also tested with the Neumann solution, thus proving the accuracy of the model at small time steps (0.01 s). The comparative verification consisted of a 24-h sine temperature wave test with amplitude of 30oC representing outside temperature variation during a day, and a 1-dimensional wall consisting of 1 cm wood, 10 cm fiber insulation, and 1.5 cm drywall. This test represents a more realistic wall configuration and boundary conditions than the analytical solution. Model space discretization and boundary conditions are: •
0.01second time steps
•
Node spacing 0.01 times the EnergyPlus default value
•
Indoor air temperature: 25oC t ≥0
•
Indoor convective heat transfer coefficient: hi=5W/m2K
•
Outside air temperature: 25°C at t=0; varying sinusoidal over 24 h with a range 10°–40oC
•
Outdoor convective heat transfer coefficient: hout=20W/m2K
•
Wall initial conditions: homogenous temperature of 25oC
•
Ideal/pure PCM with a fixed melting temperature.
The two wall applications verified in this test are shown in Table 3. This test evaluates only two applications, because no significant information was obtained from conducting three tests in the
10
analytical test. In addition, the concentrated thin PCM layer application will be tested with experimental data in Section 3.3. Table 3. Properties of PCM Strategies Analyzed in Comparative Verification Properties
PCM Distributed Insulation
% Weight of PCM in Wall Layer
20%
Equivalent Latent Heat
9.5 Btu/lb (34 kJ/kg) o
PCM Distributed Drywall 30%
o
14 Btu/lb (33 kJ/kg)
Melting Temperature
71 F (26 C)
69.6oF (25.05oC)
Thermal Conductivity
0.2337 Btu in./(h∙ft∙R) (0.0337 W/mK)
1.595 Btu in./(h∙ft∙R) (0.23 W/mK)
Density
3.1 lb/ft3 (50 kg/m3)
59.3 lb/ft3 (950 kg/m3)
Specific Heat
0.229 Btu/lb∙R (960 J/kg K)
0.20 Btu/lb∙R (840 J/kg K)
Thickness
4 in. (0.105 m)
3/5 in. (0.015 m)
Default Node Spacing
2/3 in. (0.015 m)
1/5 in. (0.005 m)
Figure 3 through Figure 5 show the results of the comparative verification for the distributed PCM in insulation. All figures show calculated values using Heating 7.3 (H73), EnergyPlus v8 PCM model with default space discretization and 1-min time step (E+), EnergyPlus v8 with no PCM and 1-min time step (E+NoPCM), EnergyPlus v8 PCM model with finer mesh (E+dx/3) and 1-min time step, EnergyPlus v8 PCM model using a 2-min time step (E+2min), and EnergyPlus v8 PCM model using a 4-min time step (E+4min). Simulations with 2- and 4-min time steps used the default space discretization values. All EnergyPlus simulations were performed using use the updated model (v8). Additionally, Figure 3 through Figure 5 show that discrepancies increase substantially when time steps ≥4 min (E+4min) are used. Thus, all simulations should use time steps