Ann. Geophys., 25, 779–784, 2007 www.ann-geophys.net/25/779/2007/ © European Geosciences Union 2007
Annales Geophysicae
VisAn MHD: a toolbox in Matlab for MHD computer model data visualisation and analysis P. Daum Department of Communication Systems, Lancaster University, LA1 4WA Lancaster, UK Received: 30 November 2006 – Accepted: 6 March 2007 – Published: 29 March 2007
Abstract. Among the many challenges facing modern space physics today is the need for a visualisation and analysis package which can examine the results from the diversity of numerical and empirical computer models as well as observational data. Magnetohydrodynamic (MHD) models represent the latest numerical models of the complex Earth’s space environment and have the unique ability to span the enormous distances present in the magnetosphere from several hundred kilometres to several thousand kilometres above the Earth surface. This feature enables scientist to study complex structures of processes where otherwise only point measurements from satellites or ground-based instruments are available. Only by combining these observational data and the MHD simulations it is possible to enlarge the scope of the point-to-point observations and to fill the gaps left by measurements in order to get a full 3-D representation of the processes in our geospace environment. In this paper we introduce the VisAn MHD toolbox for Matlab as a tool for the visualisation and analysis of observational data and MHD simulations. We have created an easy to use tool which is capable of highly sophisticated visualisations and data analysis of the results from a diverse set of MHD models in combination with in situ measurements from satellites and groundbased instruments. The toolbox is being released under an open-source licensing agreement to facilitate and encourage community use and contribution. Keywords. Magnetospheric physics (Magnetosphereionosphere interactions; Solar wind-magnetosphere interactions) – Space plasma physics (Numerical simulation studies)
Correspondence to: P. Daum (
[email protected])
1
Introduction
One of the most challenging tasks in solarterrestrial physics today is the visualisation and analysis of data from the diversity of instruments and models of our geospace environment. These models are capable of simulating processes on a large-scale. Measurements from ground-based and spaceborn instruments can only describe processes on a small scale, they can be used as indicators for large-scale processes (several RE ) but in order to describe the physical processes on a larger scale they refer to three dimensional numerical based models. Only with global simulations it is possible to model the large-scale structure of processes in the magnetosphere and the near Earth space. MHD models hereby represent the state of the art simulations to represent the complex processes in the geospace environment. All models are based on the simultaneous combination of the Navier-Stokes equations of fluid dynamics and Maxwell’s equations of electromagnetism. From the first global MHD simulation by Leboeuf et al. (1978), through to the first real three-dimensional MHD models (Brecht et al., 1982; Ogino, 1986), to the codes in their present states the models have developed and improved so that they can now be used to span the enormous distances present in the magnetosphere to fill the gaps left by the point-to-point small-scale in situ measurements. The present MHD codes are capable of simulating the geospace from several hundred kilometers above the Earth surface (namely the ionosphere) to several hundred thousand kilometers (namely the magnetosphere) and beyond. One constant among these models is their diversity. Most models have a unique numerical grid, a unique output file format and a unique method for examining the results of the simulations with little consideration for portability or ease of comparison with other models and data sets. Similarly, a diversity of analysis tools exist, which are also unique and tailored to meet the need of the original models and data, like AF Geospace by Hilmer (1999), VisBARD by Roberts
Published by Copernicus GmbH on behalf of the European Geosciences Union.
780
P. Daum: VisAn MHD
et al. (2003) or the Space Weather Explorer (SWX) based on OpenDX. The complexity and the need of high-capacity computer systems as well as the need of special visualisation and analysis software tools have confined the number of users until now. The Community Coordinated Modeling Center (CCMC) a multi-agency partnership provides the international research community access to modern space science models and frameworks like the Space Weather Modeling Framework (SWMF; T´oth et al., 2005). The CCMC executes MHD runs on demand and provides the community with output of the model runs in a standardised Common Data Format (CDF) which is a self-describing data format for the storage and manipulation of scalar and multidimensional data in a platform- and discipline-independent fashion. This simplifies the aspect of the data formats but the CDF data still include the unique numerical grid structure with the distributed physical parameters. Our approach to these problems has been the development of the VisAn MHD toolbox which processes the MHD model runs so that they can be used on a single processor machine platform-independent from all level of users. The toolbox extends the capabilities of Matlab which is used to ensure a transition between the small confined research community and the application community. The four major aspects of this transition are the ability to visualise the results from complex three dimensional physics based models and to compare the model output to in situ observations, the accessibility for all level of users and the compatibility of the toolbox to pre-existing software. The VisAn MHD toolbox for Matlab provides the users with the infrastructure for sophisticated three dimensional visualisations as well as the interfaces for model and instrument data analysis utilising common Matlab syntax. A main reason for choosing Matlab as base for the tool is that Matlab is widely known in industry and universities so many users are familiar with the syntax, this allows also novice users an uncomplicated start. We provide the users with a manageable set of functions for accessing and analysing numerical model outputs, time series data sets, as well as the access to the empirical models for comprehensive evaluations against the numerical models.
2
Overview of VisAn MHD
The VisAn MHD toolbox (Version 1.0) for Matlab is specially designed for MHD model run outputs in comparison with in situ measurements. The tool is designed to provide users an easy to use access to MHD models to substitute the boundary constrained empirical models (e.g. the T96 magnetic field model (Tsyganenko, 1995)) which are normally predominant in the application community. On the one hand VisAn MHD is a verification and validation tool for the research community by constraining and evaluate the models against in situ measurements, on the other hand it is a package that provides the application Ann. Geophys., 25, 779–784, 2007
community straightforward access to sophisticated simulations of the geospace environment. The current version of VisAn MHD incorporates interfaces for the following three global MHD simulations; the Block-Adaptive-TreeSolarwind-Roe-Upwind-Scheme (BATS-R-US model version 7.73; Powell et al., 1999), the Open Geospace General Circulation Model (OpenGGCM; Raeder, 2003), and the GEDAS model (Ogino, 1986) the next version will include interface handles for the Lyon-Fedder-Mobarry model (LFM; Lyon et al., 2004) and the GUMICS (Janhunnen, 1996) model. 2.1
Design goals
At the beginning of the project a number of design goals were set in order to fulfil the needs of the application and research community. The major aspects were to create a toolbox in a widely known and used programming environment as a multi-platform solution. The tool should be able to handle the complex model run outputs of the MHD models on a single or multiple CPU desktop computer; minimum requirements for the toolbox is a Pentium IV/AMD Sempron (or comparable Apple) with 1 GB RAM and Matlab 7 (in our case we are using a DELL OptiPlex 620, Pentium D 3.0 GHz, 2 GB RAM and Matlab 7.1 SP3). A modular approach was needed so that additional models or future versions of the models could be included when required. An extensible system was necessary so that additional functionality could be added without requiring the modification of existing program code or changing the syntax for the users. It was specified that the different data formats of the model runs were converted to the standard Matlab mat-file format, with this conversion it was fulfilled that the different data formats of the MHD models could be standardised. With this feature it is also possible to process the model run outputs from the diversity of models with the same analysis and visualisation routines. Matlab was chosen for the programming language for a number of reasons. It is widely known in both communities and for many years it has been one of the major programming languages for technical and physical calculations. Matlab is a multi-platform system, with well-tested and fast visualisation and analysis routines. Userdefined functions can be created either by writing Matlab code or by linking to external functions written in C, C++ or Fortran. Matlab has highdimensional matrix manipulation capabilities, bindings to the LAPACK libraries, this enables Matlab to perform fast calculations of the 3-D monotonic plaid matrices which represent a uniform Cartesian grid for the simulations. This type of grid is needed for the visualisation routines. In order to be able to interpolate the different numerical grids used in the models, VisAn MHD makes use of different interpolation techniques, which incorporate the characteristics of the numerical grids using a weighted octahedral interpolation method. The main visualisation routines of the toolbox feature the display of various slice planes, with user defined www.ann-geophys.net/25/779/2007/
P. Daum: VisAn MHD
781 Table 1. VisAn MHD core and add on functions.
Name
Description
readBATSRUS
read BATS-R-US global magnetospheric data (CDF)
readGGCM
read OpenGGCM global magnetospheric data (CDF)
readGEDAS
read GEDAS global magnetospheric data (BIN)
readLFM
read LFM global magnetospheric data (CDF/HDF)
readGUMICS
read GUMICS global magnetospheric data (HDF)
calcBATSRUS
interpolates the model output for given points in space
calc3DBATSRUS
interpolates the model output on an uniform Cartesian grid in a GSM frame
...
analogue for the other models; the calc functions automatically convert to GSM if the model is in a different reference frame
T96
create global magnetospheric data using the empirical Tsyganenko model ’96 (used for data comparison and validation)
coordtrans
coordinate transformation for GSM, GEO, GEI , GSE
ll2gsm
converts geographical latitude and longitude to GSM coordinates, can be used with trace to trace field lines over an arbitrary field of observation over the Earth surface (example tracing the field lines at the EISCAT radars)
trace
traces a field line from an arbitrary point of space to the Earth’s surface or to a model limiting boundary
sibeck3D
shows the Sibeck et al. (1991) inner magnetopause boundary as reticular grid
plot3DBfield
plots the open or closed field lines beginning a trace at 100 km height above the Earth surface
plot3DBtubes
same as plot3DBfield but uses 3-D tubes as magnetic field line representations instead of lines (example Fig. 2)
slice
displays orthogonal slice planes through volumetric data; can be used with all parameters produced with the calc3D functions, mostly used for the thermal pressure or density
slicelog
same as slice but calculates at first the log of the volumetric data
cappath
open-closed-field line boundary calculation
plotcappath
2-D plot of the specified hemisphere with open-closedfield line boundary
...
different 2-D visualisation and analysis tools strongly based on inbuilt Matlab functions for satellite time series data and list of data from ground-based instruments
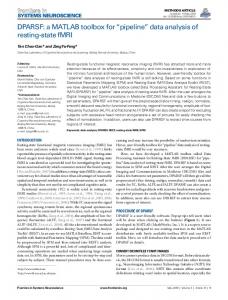
Fig. 1. VisAn MHD data flow diagram.
subdomains, streamline visualisations as ribbons, lines, or tubes, and volume plots using isosurfaces. 2.2
Software infrastructure
The inner core of the VisAn MHD toolbox contains the read and calc functions. The read functions of VisAn MHD are designed for the specifications of each MHD model output. In the current version of VisAn MHD the read functions can handle the Common Data Format (CDF), the Hierarchical Data Format (HDF), and the Binary Fortran File Format (BIN). Due to the modularisation of these functions the package can be easily adapted to new data formats or different model outputs by only substitute or adding these special modules. The calc functions can be used for interpolating the model outputs for specified points in space. Thus, the magnetic field components, the current components, the thermal velocity components, the thermal pressure, the density and the energy of a single point in space can be calculated. This can be done for a single point in space or a list of points e.g. along a satellite path, in this case the calc function produces two files, a time series list of data file in a txt-file format containing the interpolated values for the given points, the second file contains a Matlab struct object. This struct object contains the header information for the data e.g. MHD model name, original coordinate frame, time for each data point etc. A first simple data acquisition could look like >> rawdata = readbatsrus( filetoopen ) >> data = calcbatsrus( rawdata,... xpos,ypos, zpos ) The structure array data contains now the magnetic field components, the current components, the thermal velocities, the thermal pressure, and density for the given point xpos, ypos, zpos (this can be one single point as scalar value or a list of points n in form of a one dimensional matrix 1×n; only in this case the two files described above are produced) in a geocentric solar magnetospheric (GSM) reference frame. www.ann-geophys.net/25/779/2007/
An analogous syntax can be used for the other models. The other major core functions are the calc3D functions these functions interpolate the model output of the MHD runs on monotonic 3-D plaid grids for a given volume. This transformation step is necessary because of the different numerical grids of the models. Each model utilises a different method for solving the MHD equations, this is done on a diversity of numerical grids, in order to standardise these grids the calc3D functions interpolate the model outputs on a uniform Cartesian grid and writes the output in 3-D monotonic plaid matrices. These matrices are then stored in a mat-file format. As before the header information are stored in listfiles which also include a list of files with the names of the files for each time step. After this step each model output is Ann. Geophys., 25, 779–784, 2007
782
P. Daum: VisAn MHD
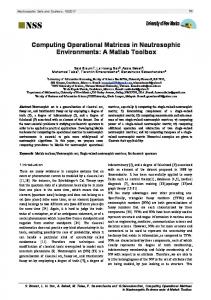
Fig. 2. 3-D representation of the magnetic field lines in a BATS-R-US run at the CCMC; (a) the shading represents the normalised thermal pressure in the (x, y)-, and (x, z)-planes, the thick solid lines are magnetic field lines traced with the VisAn MHD plot3DBtubes function; the plot shows the thickness of the magnetosheath between the inner magnetopause boundary and the inner bow shock region; (b) shows the complete representation of the field inside the magnetosphere.
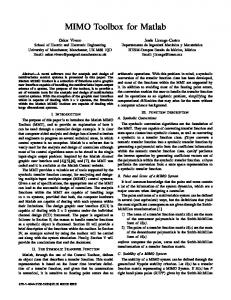
Fig. 3. 3-D representation of the global magnetic field lines of a BATS-R-US run for the 14 February 2001; 10:46 UT. The solid lines indicate the field line configuration, the red lines indicate the open magnetic field topology at the Cluster spacecraft position; the structure coincidents with the postulated structure by Russell and Elphic.
similar and can be processed with the same analysis and visualisation routines. An overview of the data flow is shown in Fig. 1. The VisAn MHD toolbox comes with a large number of functions which can work on the model outputs designed to provide tools for the novice and advance user. It is not practical to give detailed discussions of each of these functions in this paper. Table 1 provides a brief summary of the core functions and add ons included in VisAn MHD. Ann. Geophys., 25, 779–784, 2007
A key component of the VisAn MHD package is the transformation from the different numerical grids to the uniform Cartesian grid. With this transformation it is possible to make the original raw model data outputs useable for the inbuilt well-tested Matlab functions. These functions allow the use of a wide range of visualisation and analysis tools based on the fast matrix manipulation techniques of Matlab. VisAn MHD comes with numerous functions (see Table 1 and add ons) which provide documentation and examples of how to access the model data, utilise the different tools to conduct detailed analysis and sophisticated visualisations of the model outputs. Obviously we cannot cover all these functions in great detail, so we have chosen to highlight the capability of the toolbox by showing one published (Daum and Wild, 2006) example of the 3-D large-scale representation of an flux-transfer-event (FTE; Russell and Elphic, 1979) using the BATS-R-US model (see Fig. 3). 2.3
Analysis/visualisation/results
This simulation result shows the 3-D structure of the open magnetic field lines associated with an FTE reported by Wild et al. (2001). The FTE was seen simultaneous by the Cluster spacecraft during an outbound pass through the post-noon high latitude magnetopause region and the CUTLASS radars. The problem is that these in situ measurements only represent point-to-point measurements of the phenomena only by using global MHD models the complete structure of this phenomena can be represented. With VisAn MHD the analysis and visualisation of the structure of this process can be done by invoking just a few functions, here the slice, plot3DBtubes, and trace function was used to represent the thermal pressure, the magnetic field lines and the www.ann-geophys.net/25/779/2007/
P. Daum: VisAn MHD
783
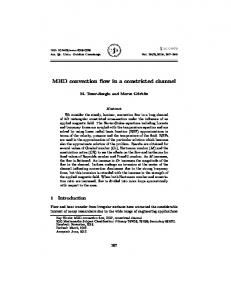
Fig. 4. 3-D representation of the global magnetic field lines of a BATS-R-US run for the 8 October 2005; 08:05 UT. The visualisation is done in a bounding box of 40 RE to 20 RE in x-direction and −22 RE to 22 RE in y- and z-direction with 1.5 Million interpolated cells. The 2-D slices show the colour coded dynamic pressure in a logarithmic scale. The volume plots show the two plasma cavities above and beneath the neutral sheet and the plasma concentration at the bowshock. The streamtubes represent the closed fieldline configuration.
magntic field configuration at the position of the Cluster spacecraft. By combining the functions shown in Table 1 novice and advance users will be able to create with a minimum effort excellent graphics as well as probe their data or data from another source for interesting results. Figure 4 shows the combination of just a few of these functions in order to represent isosurfaces and magnetic field tubes as well as the dynamic pressure. This kind of representation can then be used to create movies from a complete time interval to get a better overview of how the shape of the magnetosphere is influenced directly by the solar-wind, this allows a first inside of new data sets and new results obtained from the various kind of instruments. 2.4
Compatibility and further software packages
The VisAn MHD toolbox is fully compatible with any Matlab pre-existing software package and can therefore be easily adapted in projects. As add ons we also provide an open source toolbox for satellite orbit calculations and magnetic footprints (http://www.vissat.net.ms) based on the NORAD models (Hoots and Roehrich, 1980) and the T96/01 inner magnetosphere models. In future versions we plan to provide the users with direct interface functions for the EISCAT analysis tool GUISDAP (Lehtinen and Huuskonen, 1996), the Multi-Instrument Analysis toolbox MIA (Marple and Honary, 2004) and a generalised Cluster satellite data analysis tool based on the Cluster Active Achieve (CAA) data sets. Because of the simplicity and fully compatibility of the www.ann-geophys.net/25/779/2007/
VisAn MHD toolbox with the Matlab standard it is possible to customise the tool for any special need by integrating own data and software into the package or just using it as add on for pre-existing analysis tools. 3
Conclusions
In the study of solarterrestrial physics there is often the requirement to compare and combine data from different instruments by using computer simulations. In this paper we have presented an overview of the VisAn MHD toolbox for Matlab for visualising and analysing space science model outputs in combination with observational data from a diversity of ground-based and space-born instruments. The MHD models at the CCMC represent the most sophisticated models of the global geospace environment, the VisAn MHD toolbox opens up these models to a complete new community with a familiar easy to use syntax. Hereby the toolbox utilises the Matlab mat-file format to standardise the model outputs and uses general visualisation and analysis functions for all models. This makes it easy to compare the models against each other and in respect of in situ measurements by groundbased or space-born instruments. Our tool can be combined and adapted by existing software packages to fulfill the numerous needs of the space physics community. The current version of VisAn MHD contains handles for the BATS-RUS, the OpenGGCM, and the GEDAS model, the visualisation and analysis routine enclose functions from simple 2-D Ann. Geophys., 25, 779–784, 2007
784 visualisations of the Hall- and Pederson Conductivities over a specified geographical latitude and longitude, to 3-D visualisations of the magnetosphere with inner magnetopause boundary and field line traces. We are currently working on handles for the LFM and the GUMICS models. The add ons are under constant development and can be adapted for any special research need. The entire toolbox is being released to the community under an open-source licensing agreement. Interested users can download the toolbox and examples from http://www.visan.net.ms. The success of this project depends upon continued community contributions; we look forward to meeting the needs of the different communities through collaborative work to enhance the capabilities and areas of application for VisAn MHD. Acknowledgements. Simulation results have been provided by the Community Coordinated Modeling Center at Goddard Space Flight Center. The CCMC is a multi-agency partnership between NASA, AFMC, AFOSR, AFRL, AFWA, NOAA, NSF and ONR. Topical Editor I. A. Daglis thanks two referees for their help in evaluating this paper.
References Brecht, S. H., Lyon, J. G., Fedder, J. A., and Hain, K.: A time dependent three dimensional simulation of the Earth’s magnetosphere: Reconnection events, J. Geophys. Res., 87, 6098–6108, 1982. Daum, P. and Wild, J. A.: MHD Models for MultiSpacecraft/Ground-based Analysis and Conjunction Visualisations, in: Numerical Modeling of Space Plasma Flows, edited by: Pogorelov, N. V. and Zank, G. P., Conference Series, ASP, 359, 125–130, 2006. Hilmer, R.: AF Geospace Users Manual, version 1.4 and version 1.4P, U.S. Air Force Base, Hanscom, Mass., 1999. Hoots, F. R. and Roehrich, R. L.: Spacetrack Report No.3: Models for Propagation of NORAD Element Set, compiled and distributed by T. S. Kelso, 1980. Janhunen, P.: GUMICS-3 – A global ionosphere-magnetosphere coupling simulation with high iono-spheric resolution, Proc. Environmental Modelling for Space-Based Applications, 18– 20 September (ESTEC, The Netherlands, ESA SP-392, 1996), 1996. Leboeuf, J. N., Tajima, T., Kennel, C. F., and Dawson, J. M.: Global simulation of the time dependent magnetosphere, Geophys. Res. Lett., 5, 609–612, 1978.
Ann. Geophys., 25, 779–784, 2007
P. Daum: VisAn MHD Lehtinen, M. S. and Huuskonen, A.: General incoherent scatter analysis and GUISDAP, J. Atmos. Terr. Phys., 58, 435–452, 1996. Lyon, J. G., Fedder J. G., and Mobarray, C. M.: The Lyon-FedderMobarry (LFM) global MHD magnetospheric simulation code, J. Atmos. Space Phys., 66, 1333–1350, 2004. Marple, S. R. and Honary, F.: A Multi-Instrument Data Analysis toolbox, Adv. Polar Upper Atmos. Res., 18, 120–130, 2004. Ogino, T.: A three-dimensional MHD simulation of the interaction of the solar wind with the Earth’s magnetosphere: The generation of field-aligned currents, J. Geophys. Res., 91, 6791–6806, 1986. Powell, K. G., Roe, P. L., Linde, T. J., Gombosi, T. I., and DeZeeuw, D. L.: A solution-adaptive upwind scheme for ideal magnetohydrodynamics, JCP, 154, 284–309, 1999. Raeder, J.: Global Magnetohydrodynamics – A Tutorial, in: Space Plasma Simulation, edited by: Buechner, J., Dum, C. T., and Scholer, M., Lecture Notes in Physics, vol. 615, Springer Verlag, Heidelberg, ISBN 3-540-00698-2, 2003. Roberts, D. A., Rezapkin, V., Coleman, J., and Boller, R.: Vector and scalar field visualization techniques for multispacecraft space physics missions, Eos Trans. AGU, 84(46), Fall Meet. Suppl., Abstract SM42E-06, 2003. Russell, C. T. and Elphic, R. C.: ISEE observations of flux transfer events at the dayside magnetopause, Geophys. Res. Lett., 6, 33– 36, 1979. Sibeck, D. G., Lopez, R. E., and Roelof, E. C.: Solar Wind Control of the Magnetopause Shape, Location, and Motion, J. Geophys. Res., 96, 5489–5495, 1991. T´oth, G., Sokolov, I. V., Gombosi, T. I., Chesney, D. R., Clauer, C. R., De Zeeuw, D. L., Hansen, K. C., Kane, K. J., Manchester, W. B., Oehmke, R. C., Powell, K. G., Ridley, A. J., Roussev, I. I., Stout, Q. F., Volberg, O., Wolf, R. A., Sazykin, S., Chan, A., Yu, B., and K´ota, J.: Space Weather Modeling Framework: A new tool for the space science community, J. Geophys. Res., 110, A12226, doi:10.1029/2005JA011126, 2005. Tsyganenko, N. A.: Modeling the Earth’s Magnetspheric Magnetic Field confined within a realistic Magnetpause, J. Geophys. Res., 100, 5599–5612, 1995. Wild, J. A., Cowley, S. W. H., Davies, J. A., Khan, H., Lester, M., Milan, S. E., Provan, G., Yeoman, T. K., Balogh, A., Dunlop, M. W., Fornacon, K.-H., and Georgescu, E.: First simultaneous observations of flux transfer events at the high-latitude magnetopause by the Cluster spacecraft and pulsed radar signatures in the conjugate ionosphere by the CUTLASS and EISCAT radars, Ann. Geophys., 19, 1491–1508, 2001, http://www.ann-geophys.net/19/1491/2001/.
www.ann-geophys.net/25/779/2007/