Ergonomics Vol. 55, No. 9, September 2012, 1009–1027
Visual and memory search in complex environments: determinants of eye movements and search performance Lynn Huesteggea* and Ralph Radachb a
Institute for Psychology, RWTH Aachen University, Aachen, Germany; bGeneral and Biological Psychology, University of Wuppertal, Wuppertal, Germany
Downloaded by [Florida State University] at 08:00 09 October 2013
(Received 24 June 2011; final version received 25 April 2012) Previous research on visual and memory search revealed various top down and bottom up factors influencing performance. However, utilising abstract stimuli (e.g. geometrical shapes or letters) and focussing on individual factors has often limited the applicability of research findings. Two experiments were designed to analyse which attributes of a product facilitate search in an applied environment. Participants scanned displays containing juice packages while their eye movements were recorded. The familiarity, saliency, and position of search targets were systematically varied. Experiment 1 involved a visual search task, whereas Experiment 2 focussed on memory search. The results showed that bottom up (target saliency) and top down (target familiarity) factors strongly interacted. Overt visual attention was influenced by cultural habits, purposes, and current task demands. The results provide a solid database for assessing the impact and interplay of fundamental top down and bottom up determinants of search processes in applied fields of psychology. Practitioner Summary: Our study demonstrates how a product (or a visual item in general) needs to be designed and placed to ensure that it can be found effectively and efficiently within complex environments. Corresponding product design should result in faster and more accurate visual and memory based search processes. Keywords: visual search; memory search; saccade; eye movements; familiarity; saliency; search strategy
Previous research on visual search can be clustered into at least two groups, depending upon aims and corresponding experimental paradigms. One group comprises studies that primarily focus on early visual processing and covert attention (e.g. Treisman 1991, Wolfe 1994). Corresponding paradigms utilise basic visual stimuli such as tilted or coloured lines, typically varying in amount and with respect to selective features. The many fundamental contributions of this line of research to our understanding of attention processes can be instrumental in generating hypotheses about visual search in more complex environments. For example, the so-called ‘pop out’ effect demonstrates that search targets that are defined by one prominent feature can be found much faster compared to targets that are defined by a conjunction of two or more features (cf. Treisman 1991). Another, complementary, tradition of research aims at a better understanding of everyday visual search itself and often involves the measurement of eye movements, sometimes referred to as ‘overt attention.’ Since our environment is quite complex with objects and scenes varying not only in colour, size, and shape, but also with respect to language elements and other symbolic features, a number of recent studies examined search with more natural item materials, including letters, complex geometrical figures, or faces (e.g. Hooge and Erkelens 1999, Tong and Nakayama 1999, Findlay and Gilchrist 2003,) and by using photographs or videos (see Underwood et al. 2002, Henderson 2003, Underwood et al. 2003, Brockmole and Henderson 2006, Humphrey and Underwood 2009, for examples and reviews). Both lines of research certainly cannot be distinguished sharply, as they share common research topics, e.g. the role of memory processes during search (Horowitz and Wolfe 1998, Shore and Klein 2000, Von Mu¨hlenen et al. 2003, Klein and Dukewich 2006). However, it appears that even recent work in both traditions still tends to reduce the complexity of the real world to ensure sufficient experimental control, and thus experiments with high ecological validity and direct relevance for applied fields are still the minority (e.g. Beck et al. 2010, Pradhan et al. 2011, Kujala and Saariluoma 2011). More specifically, only few of these studies addressed the question of whether and how wellknown determinants of search performance as established in basic research mediate search performance in complex settings. Addressing this issue is specifically important from an applied perspective, for example as a guide to *Corresponding author. Email:
[email protected] ISSN 0014-0139 print/ISSN 1366-5847 online Ó 2012 Taylor & Francis http://dx.doi.org/10.1080/00140139.2012.689372 http://www.tandfonline.com
Downloaded by [Florida State University] at 08:00 09 October 2013
1010
L. Huestegge and R. Radach
deciding how to arrange products in shopping environments, both real and virtual. To help filling this gap, the present experiments examine effects of the search task and target attributes like its familiarity, saliency, and position in a complex environment that is nonetheless amenable to experimental control (see Zelinsky et al. 1997, for a similar approach). More specifically, we studied search for juice packages as a model environment for basic mechanisms of visual and memory search in complex search situations. Previous research showed that objects that are repeatedly presented as search targets (or share features with previous targets) are responded to faster (e.g. Maljkovic and Nakayama 1994), representing a typical top downinfluence on search performance. Top down processing usually refers to influences on performance beyond the current physical input, for example as a result of previous learning. Further research using more naturalistic stimuli confirmed that familiar search targets are located more efficiently than unfamiliar targets (see Mruczek and Sheinberg 2005). Familiarity has also been shown to affect attention in warning symbol comprehension (Lesch et al. 2011). However, it remained unclear how target familiarity interacts with other important factors, such as target saliency and target position in complex search scenes. To address this issue, we varied the familiarity of search targets by having subjects search for either familiar or unfamiliar juice packages. In addition to top down factors, the physical properties of a search array are also known to influence performance (bottom up processing). For example, Duncan and Humphreys (1989) proposed that target items are found faster the more they differ from surrounding distractors and the more such distractors are physically similar among each other (see also Guest and Lamberts 2011). Other research groups presented evidence that visual saliency (i.e. the visual distinctiveness of an item relative to neighbouring items based on physical features like brightness, colour and orientation) could influence fixation patterns during image viewing and dynamic scene perception (e.g. Parkhurst et al. 2002, Carmi and Itti 2006, Foulsham and Underwood 2009, but see Chen and Zelinsky 2006, Foulsham and Underwood 2007). To test for such saliency effects in complex search arrays, target items in the present experiments were divided into a rather homogeneous set (similarly shaped rectangular juice packages) and another set exhibiting more variability in shape (juice bottles with highly variable shapes). Previous research suggested that item shape is a prominent feature that strongly co-determines search performance (Malcolm and Henderson 2009). We reasoned that using an item from the homogeneous set as a search target should – everything else being equal – lead to lower mean target-distractor** heterogeneity compared to using an item from the heterogeneous set. As a consequence, it should be easier to search for the more salient item (i.e. bottle shaped) compared to a less salient item (i.e. rectangular shaped), given equal mean distractor saliency (here: a mixture of both bottles and rectangular packages). This reasoning regarding the targets’ saliency was backed up by both subjective and objective measures (see below). A third variable of high relevance in applied settings that has not received much attention in the basic research literature is the spatial position of targets within search arrays. Subjects usually prefer looking at informative regions during scene perception (Buswell 1935, Henderson et al. 2007), but this finding does not allow us to generate hypotheses about homogenous scenes, where informativeness is equally distributed across spatial locations. In an early study, Ford et al. (1959) found that fixations are less frequent at the very edge and in the centre of a homogenous display, compared to intermediate regions. More recent research reported better search performance at central (vs. peripheral) display positions (e.g. Carrasco et al. 1995, Wolfe et al. 1998) as well as a central fixation bias (Tatler 2007, Foulsham et al. 2011) and a leftward bias (Dickinson and Intraub 2009) in scene viewing. A further potential source of influence on the spatial distribution of attention within stimulus arrays may result from cultural habits (e.g. reading). Thus, although target position is a physical property of a search array and therefore qualifies as a bottom up influence on processing, its effects on performance may well reveal strategic top down effects (e.g. Proulx 2011). From an applied point of view, it seems essential to know about any attentional biases towards specific parts of a spatial array, for example in supermarket shelves or arrays of products in internet based shopping environments. In the present study, we therefore systematically varied target positions. Importantly, we also varied the specific search task as a further top down influence (e.g. see Mills et al. 2011). Taking the position of a customer entering a shop or an online-store, at least two different possible intentions can be considered realistic and representative for typical real-world behaviour. First, the customer may already know what to buy in advance and consequently try to find it as fast as possible. Alternatively, a potential customer may decide to explore shelves, memorising and comparing item features until some final decision is made. Two well-known experimental paradigms seem to reflect these different scenarios. First, the visual search paradigm introduced by Neisser (1967) reflects the search for a previously specified target. Second, the memory search paradigm introduced by Sternberg (1966) captures important aspects of a search task involving memorisation and comparison. However, research on memory search typically aimed at understanding
Downloaded by [Florida State University] at 08:00 09 October 2013
Ergonomics
1011
short-term memory, and was thus conducted with only few digits or letters. Our natural environment, however, usually by far exceeds our capacity for actively storing information. In the present study participants were therefore exposed to stimuli resembling typical supermarket shelves, offering a possibility to study memorisation processes in an ecologically valid, complex environment. Whereas in Experiment 1 (visual search) a target juice package was presented prior to a large search display of 16 packages, in Experiment 2 the same material was used with a reversed order of presentation within each trial. More specifically, we asked participants to memorise as many items as possible from the search array and then indicate whether a subsequently presented single item was part of the previously presented display (for similar manipulations see Schneider and Shiffrin 1977, Janiszewski 1998). While the literature reviewed above unanimously demonstrated that target familiarity, saliency, position and search task significantly affect performance in isolation, it has remained difficult to assess implications of these individual effects, including their potential interactions and relative importance in applied contexts. Note that all sources of influence discussed above are directly relevant in the context of marketing psychology: Familiarity is affected by advertisement measures, saliency is determined by product design, and it appears obvious that factors like placement (item position) and customer intentions (search task) should affect behaviour. Thus, the present study is aimed at filling a research gap between basic search studies and applied contexts (e.g. see Chung and Shorrock 2011) by studying the impact of and the interactions between these factors in a virtual shopping environment using real-life photographs of juice packs arranged in shelves. Experiment 1: visual search In Experiment 1, participants were asked to search for specified target items in large arrays of juice packages. Targets varied with respect to their familiarity, saliency and display position. Targets were initially classified as being of high versus low familiarity by the authors, and the classification was validated by conducting a familiarity ranking. For the saliency manipulation, juice packages were divided into two sets, one consisting of packages with similar, rectangular shape (low saliency), and the other set consisting of juice bottles with considerable variation in shape (high saliency). The saliency classification was again validated through a saliency ranking and a saliency computation based on the Itti and Koch (2000) algorithms. The position of the search target items varied systematically, so that they appeared at any of the 16 possible display positions. Unlike common visual search experiments in basic research, we did not manipulate the number of distracters in the search arrays (e.g. Treisman 1991). A variation of this kind is usually implemented to determine whether the search is performed serially (item-by-item) or in parallel. However, there is common agreement that complex multidimensional stimuli like those in the present study are scanned more or less sequentially, and a corresponding manipulation would probably not have substantially added to the understanding of search processes in natural environments.
Method Material Digital photos of existing juice packages (depicting products currently sold in German supermarkets) were processed using graphic software, resulting in the same overall surface area of the packages (in pixels) as well as in comparable colour scales, brightness and contrast. Some of the items were selected as potential search targets (target set), whereas the rest was used as distractors. The target set consisted of eight packages, which were subdivided according to a 2 6 2 design: Half of the targets were of high versus low familiarity, and of rectangular versus bottletype shape, respectively. Each of the four conditions was thus represented by two items. Four juices of the same brand and flavour were selected as they are available in both packaging versions (bottle/rectangular), allowing for a variation in shape without a corresponding change of brand name, flavour and overall design. To the extent possible, other potentially confounding variables like letter size and overall package design were also controlled. However, the area available for packaging design had to be generally larger for the rectangular items. To achieve a more realistic search environment resembling real (and potentially virtual) supermarkets, every package was arranged as a triplet of three identical juices. The distractor set consisted of eight rectangular shaped and eight bottle shaped packages also arranged as triplets, with the 16 items including six different brand names. Distractors were selected (based on subjective visual inspection) so that they were to a large extent comparable to the target stimuli with respect to form, familiarity, colour and flavour.
1012
L. Huestegge and R. Radach
We constructed 256 search displays, each containing 16 different package triplets arranged in racks (Figure 1). All displays contained one item from the target set, and these target items never appeared as distractors. Distractors were randomly assigned to display positions, so that on every trial, distractors would be a mix of the two shapes. Each trial consisted of a single search target located at a randomised position across the screen. Subsequently, the search display was presented. Half of the trials were ‘target present’ trials. Positions of target triplets in the display were equally distributed across all 16 locations in the display, resulting in eight ‘target present’ trials for each position. Participants Twenty university students took part in the experiment, seven male and 13 female, with a mean age of 25 years (SD ¼ 7.89). They had normal or corrected-to-normal vision and received credit for participation.
Downloaded by [Florida State University] at 08:00 09 October 2013
Apparatus Participants were seated 67 cm in front of a 2100 monitor with a keyboard and two response buttons in front of them. At this distance, the total search display subtended 22 deg of visual angle horizontally and 18 deg vertically. Accordingly, the area occupied by each stimulus triplet amounted to 5 deg horizontally and 4 deg (+0.5, depending on the specific stimulus) vertically. The spacebar of the keyboard was used during calibration routines. Eye movements of the right eye were registered using a head mounted Eyelink I infrared reflection system (SR Research, Canada), sampling at 250 Hz. A chin rest minimised head movements. The spatial resolution of the system (about 0.5 deg) allowed determining which item in the display was fixated.
Figure 1.
Example of a search display. Note that the display was coloured in the original experiments.
Ergonomics
1013
Downloaded by [Florida State University] at 08:00 09 October 2013
Procedure At the beginning of the session participants were welcomed and received a detailed instruction. The experiment consisted of 256 trials (50% ‘target present’) arranged in randomised order. Each trial started with the presentation of a target item at a random position on the screen (i.e. at one of the 16 item positions to control for initial fixation position on the search screen) for 2000 ms. Then the search display was presented until subjects indicated (as quickly and accurately as possible) whether the target was present in the display. Responses were given by pressing either a left (‘yes’) or right (‘no’) button with the index fingers of the left and right hand, respectively. After the response, the next trial started. No feedback was provided. 40 practise trials preceded the main experiment. The recording system was calibrated using a criterion of 0.5 deg for spatial accuracy. After each block of 20 trials, this procedure was repeated. The entire experimental session lasted about 50 minutes. After the experiment, an item recognition test was conducted by presenting 24 photographs (all eight targets, eight of the distractors and eight new items that never occurred during the experiment). Subjects indicated which items were present in the experiment. A backward counting task (about two minute), administered prior to the recognition test, served to eliminate the content of the last experimental trials from working memory. Finally, a questionnaire was administered to obtain information about shopping routines, and ranking data regarding the familiarity and saliency of all items were collected. To this end, subjects were provided with small colour photographs of all items. All photos were randomly spread out on a table and presented at the same time (since both familiarity and saliency are relative concepts). First, they were asked to rank order all stimuli with respect to saliency after a brief introduction into the psychological concept of saliency, highlighting that neither aesthetics nor familiarity should influence the rankings. Ranking was accomplished by ordering all photos from left to right, while shared ranks (vertical placement) were allowed. For the familiarity ranking, the same procedure was repeated (including random positioning of all photos on the table and an introduction into the concept of familiarity). The order of the two rankings was counterbalanced, and they were conducted at the end of the experiment so that the search task was not influenced by previous stimulus exposure. Although it can safely be assumed that item familiarity generally increased over the course of the experiment, we reasoned that this should not severely influence the (relative) rankings. Design The factors familiarity (unfamiliar vs. familiar), shape (rectangular vs. bottle) and position (upper vs. lower part of the display) were manipulated within participants. As dependent variables, we measured response times (RTs) and accuracy (in %). Eye movement parameters included mean fixation durations, saccade lengths and number of fixations. For the questionnaire analysis, mean ranks were computed. Statistical analyses were carried out by using t-tests and ANOVAs with a Type-I error criterion of 5%. For the ranking analyses, rank tests were conducted.
Results and discussion Questionnaire Eighty per cent of the subjects indicated to buy juices regularly. Fifteen per cent stated that they buy bottles more frequently than rectangular packages, whereas 55% reported to buy rectangular designs more frequently. The remaining subjects were indecisive. Regarding their juice buying strategies, 25% stated to predominantly look at all products and compare their features before making a purchasing decision. Thirty percent reported that they most often know in advance which product they desire and consequently search for this product as fast as possible. Forty per cent stated that both situations occur equally often. Overall, this pattern of results appears to represent a good mix of situations that may be present in real shopping scenarios. Participants ranked all items with respect to their familiarity and saliency, with smaller numbers indicating higher familiarity/saliency. As a result, the target items classified as being familiar by the authors were also ranked as being more familiar (mean rank ¼ 3.05, SD ¼ 1.67), compared to the unfamiliar items (mean rank ¼ 6.68, SD ¼ 1.23), z ¼ 3.57, p 5 0.001. The distractor items had a mean familiarity rank of 5.9 (SD ¼ 0.55). In line with our assumption, mean ranked saliency for bottle targets was higher (mean rank ¼ 4.15, SD ¼ 1.74) compared to rectangular targets (mean rank ¼ 9.96, SD ¼ 2.91), z ¼ 4.37, p 5 0.001. Familiar targets did not differ in their mean saliency rank from unfamiliar targets (mean rank ¼ 4.29, SD ¼ 5.6 and mean rank ¼ 4.85, SD ¼ 5.4, respectively), z 5 1. Distractors had a mean saliency ranking of 6.1 (SD ¼ 0.7).
1014
L. Huestegge and R. Radach
Downloaded by [Florida State University] at 08:00 09 October 2013
Beside these subjective ranking data, we also estimated the relative saliency of the items using the Itti and Koch (2000) saliency map model (source code available from http://ilab.usc). Typically, this model produces a saliency map (based on combined feature contrasts) and eventually a set of model-predicted fixations for a display. The saliency map is generated by assigning raw saliency values (scaled to a fixed range of 0–255) to each display coordinate. Here, we computed mean maximum saliency values for each of the 16 triplet positions across five (randomly sampled) displays. As a result, there was no overlap between mean maximum saliency values for rectangular (0–14) versus bottle (45–76) shaped items, and a corresponding t-test revealed a corresponding significant difference in maximum saliency between the shape categories, t(4) ¼ 12.39, p 5 0.001. Taken together, all three ways of determining item saliency (our own a priori categorisation, subjective ranking data from the participants and objective saliency algorithms) led to identical results. General search results Table 1 depicts overall mean RTs and accuracy. Overall, 84% of the trials were responded to correctly. For incorrect responses, we observed more misses (23.2% of target present trials) than false alarms (8.6% of target absent trials), t(19) ¼ 6.98, p 5 0.001. Response times for correct rejections (M ¼ 2984 ms) were about 900 ms longer compared to hits (M ¼ 2076 ms), t(19) ¼ 10.99, p 5 0.001, representing a pattern typical for search termination after target detection. An overview of cell means as a function of familiarity, shape, and position is provided in Table 2 for each dependent variable. To maximise readability interactions will only be reported when significant. Familiarity For the analysis of familiarity effects on response accuracy only target present trials were considered. For the analysis of RTs and eye movements only hit trials were included. About 63.4% (SE ¼ 1.4) of the unfamiliar search targets were found, compared to 89.8% (SE ¼ 1.3) of the familiar search targets, F(1,19) ¼ 322, p 5 0.001, indicating that unfamiliar items were quite often overlooked. Searching for unfamiliar items was slower (2198 ms, SE ¼ 122) compared to familiar items (2004 ms, SE ¼ 129), F(1,19) ¼ 7.87, p ¼ 0.011. Previous visual search theories do not easily account for such a familiarity effect in visual search (e.g. Treisman and Gelade 1980, Wolfe 1994), especially since the target is explicitly shown prior to the onset of the search display. To explain this effect, we split RTs into the time until the first fixation of the target (target locating time) and the time from the first fixation until the manual response (target processing time). Interestingly, both parameters were significantly affected by familiarity, F(1,19) ¼ 5.15, p ¼ 0.035, and F(1,19) ¼ 5.08, p ¼ 0.036. Presumably, the effect on target locating times arises from enhanced parafoveal processing of familiar items during search. Similar phenomena have been reported during reading, where the difficulty of a word following the currently fixated word can influence gaze durations on the currently fixated word (Inhoff et al. 2003, Kliegl et al. 2006). One potential explanation for this effect was proposed by Henderson and Ferreira (1990), namely that higher cognitive load may lead to a narrowed perceptual span. If a search for unfamiliar items is more difficult (higher cognitive load), this would narrow the perceptual span, making search processes less effective. This interpretation is corroborated by the fact that the initial saccade amplitude towards the target was of greater length for familiar targets (8.98) than for unfamiliar targets (8.18), F(1,19) ¼ 4.47, p ¼ 0.048.
Table 1. Mean frequency and RTs of ‘present’ versus ‘absent’ responses for target present and target absent trials in Experiment 1 (standard deviations in parentheses). Note that RTs for incorrect responses are less reliable due to the small number of observations. Response decision ‘present’ Target present Target absent
% Trials RT (ms) % Trials RT (ms)
76.8 2076 8.6 2433
(5.2) (535) (8.4) (979)
‘absent’ 23.2 2735 91.4 2984
(5.2) (835) (8.4) (844)
1015
Ergonomics
Table 2. Mean RT and target locating time (ms) for hit trials, mean % Correct for target present trials, and eye movement parameters for hit trials [mean number of fixations (N), mean saccade amplitudes (8), and mean fixation durations (ms)] in Experiment 1, as a function of familiarity, shape, and position of the target items. Standard errors are reported in parentheses. Low familiarity Mean RT (hit trials) Rectangular shape Bottle shape Mean target locating time (hit trials) Rectangular shape Bottle shape
Downloaded by [Florida State University] at 08:00 09 October 2013
% Correct (target present trials) Rectangular shape Bottle shape Number of fixations (hit trials) Rectangular shape Bottle shape Saccade amplitudes (hit trials) Rectangular shape Bottle shape Fixation durations (hit trials) Rectangular shape Bottle shape
High familiarity
Upper Lower Upper Lower
position position position position
2188 2359 2050 2197
(160) (150) (104) (142)
1912 2193 1878 2033
(158) (144) (122) (166)
Upper Lower Upper Lower
position position position position
1054 968 952 1235
(98) (128) (85) (98)
949 997 829 959
(139) (86) (62) (68)
Upper Lower Upper Lower
position position position position
42.4 43.7 82.2 85.3
(2.0) (1.8) (3.0) (2.1)
91.6 88.8 90.3 88.5
(1.7) (2.1) (1.7) (2.2)
Upper Lower Upper Lower
position position position position
8.77 10.27 8.27 9.09
(0.61) (0.62) (0.40) (0.48)
8.62 9.91 7.56 8.72
(0.59) (0.71) (0.37) (0.59)
Upper Lower Upper Lower
position position position position
5.98 6.53 6.85 7.49
(0.25) (0.37) (0.29) (0.25)
6.61 6.97 7.01 7.22
(0.27) (0.20) (0.36) (0.27)
Upper Lower Upper Lower
position position position position
242 236 241 238
(7.96) (6.15) (6.93) (6.90)
230 235 242 230
(4.81) (5.97) (8.39) (6.39)
Additionally, overall mean saccade amplitudes in searches for unfamiliar items were significantly shorter (M ¼ 6.718, SE ¼ 0.26) compared to searches for familiar items (M ¼ 6.958, SE ¼ 0.26), F(1,19) ¼ 5.25, p ¼ 0.034. This might represent a strategic response to the expectancy of a more difficult search, in which less information can be processed during each fixation. The mean number of fixations in a display did not differ significantly, with 9.1 fixations (SE ¼ 0.44) during a search for unfamiliar items and 8.7 fixations (SE ¼ 0.47) for familiar items, F(1,19) ¼ 2.70, p 4 0.10. Mean fixation durations also did not differ significantly, with 239 ms (SE ¼ 5.44) for searches for unfamiliar items and 234 ms (SE ¼ 5.45) for familiar items, F(1,19) ¼ 2.00, p 4 0.10. Saliency Rectangular packages were found in 66.6% (SE ¼ 1.4) of target present trials, whereas 86.6% (SE ¼ 1.4) of the bottles were found, F(1,19) ¼ 173, p 5 0.001, indicating a clear performance advantage in searches for bottles, likely due to the higher saliency of the much more heterogeneous bottle shapes. This finding is in line with other studies reporting dependencies between saliency and fixation patterns (e.g. Parkhurst et al. 2002, Carmi and Itti 2006). The accuracy data also revealed a significant interaction of familiarity and shape, F(1,19) ¼ 127.34, p 5 0.001, indicating that saliency only played a substantial role for targets of low familiarity. Specifically, rectangular targets of low familiarity were only found in 43% of target present trials, whereas bottles of low familiarity were found in 84% of target present trials. For targets of high familiarity there was no substantial accuracy difference between the two shape types (both about 90%). Probably, efficient top down processing (enabled by the search for highly familiar items) appears to be able to override effects more closely related to bottom up processing efficiency. Overall RTs did not significantly differ as a function of shape (rectangular: 2163 ms, SE ¼ 134, bottles: 2039 ms, SE ¼ 120), F(1,19) ¼ 2.29, p ¼ 0.15. However, although target locating times were also unaffected by shape, F 5 1, target processing time was shorter for bottles (1063 ms) than for rectangular targets (1225 ms), F(1,19) ¼ 10.69, p ¼ 0.004.
Downloaded by [Florida State University] at 08:00 09 October 2013
1016
L. Huestegge and R. Radach
A significant interaction between familiarity and shape for target processing times, F(1,19) ¼ 25.01, p 5 0.001, indicates that this shape effect was mainly present for targets of low familiarity. In line with the tendency observed with respect to RTs, the mean number of fixations was greater in the search for rectangular packages (9.39, SE ¼ 0.55) as compared to bottles (8.41, SE ¼ 0.38), F(1,19) ¼ 8.01, p ¼ 0.01. Mean fixation durations did not differ significantly between searches for rectangular packages (235.88, SE ¼ 4.73) and bottles (237.65, SE ¼ 6.42), F(1,19) 5 1. However, the initial saccade amplitude towards the target was significantly greater for bottles (9.28) than for rectangular targets (7.88), F(1,19) ¼ 19.76, p 5 0.001, indicating better parafoveal visibility of the more salient targets. Overall, the mean saccade amplitudes were shorter in searches for rectangular packages (6.52, SE ¼ 0.25) compared to bottles (7.14, SE ¼ 0.27), F(1,19) ¼ 32.50, p 5 0.001. The saccade amplitude data also revealed a significant interaction of shape and familiarity, F(1,19) ¼ 7.50, p ¼ 0.013, representing greater shape effects for targets of low familiarity. Since items in the present experiment were real juice packages, other confounding variables might principally be responsible for the overall advantage of the bottles, and some more prominent differences between shape types should be considered. The surface area for the package design was by far larger for the rectangular packages, leading to greater pictures of fruits and slightly larger print size. These larger cues for rectangular items obviously do not play an important role, since they should have created an advantage for the rectangular packages, whereas the opposite pattern was observed. Another explanation could be that the shape effect might be reduced to a familiarity effect, because subjects might be more familiar with bottles. However, the ranking data do not support this alternative explanation, and most of the subjects stated that they buy rectangular packages more often than bottles. The assumption that saliency, as a consequence of shape heterogeneity, is in fact responsible for the results is furthermore supported by the ranking data, as participants ranked bottles to be more salient than rectangular packages, and the most prominent bottom up feature that differs between both groups of items is the heterogeneity of shape in the set of bottles. Therefore, it is very likely that saliency is indeed the source of the observed shape effect. Another interesting observation is that the mean saccade amplitudes in the search for a rectangular item were significantly shorter than for a bottle search. This again might be a result of reduced parafoveal preview in more difficult searches as was already argued in the above discussion of the familiarity effect. Item position About 76.6% (SE ¼ 1.3) of target items in the upper part of the display (top two lines in Figure 1) were found, compared to 76.5% (SE ¼ 1.1) of targets in the lower part (last two lines), F 5 1, indicating that both parts of the display were scanned with equal care. Note that this finding is at variance with Previc’s (1990) prominent theoretical view of upper versus lower visual field processing, which predicts better memory encoding for items in the upper field for the purposes of planning future behaviour. However, targets in the upper part of the display were found faster (2007 ms, SE ¼ 119) compared to 2195 ms (SE ¼ 133) for items in the lower part, F(1,19) ¼ 6.66, p ¼ 0.018, suggesting that searches proceeded from top to bottom, presumably resulting from scanning strategies carried over from other sequential tasks like reading. There was no significant RT difference between items in the left versus right part of the display, t(19) ¼ 1.70, p 4 0.10, but items on the right hand side were found with greater accuracy (78.58%) than those on the left hand side (74.12%), t(19) ¼ 3.18, p ¼ 0.005. Targets in the upper part of the display were found after 8.31 fixations (SE ¼ 0.44), compared to 9.50 fixations (SE ¼ 0.49) for targets in the lower part, F(1,19) ¼ 13.56, p ¼ 0.002, reflecting the RT results. Fixation durations did not differ significantly, F(1,19) ¼ 2.81, p ¼ 0.156, with 238 ms (SE ¼ 5.77) for trials with targets in the upper part and 234 ms (SE ¼ 4.91) for trials with targets in the lower part. However, mean saccade amplitudes during searches for targets in the upper part were shorter, with 6.618 (SE ¼ 0.27) compared to 7.058 (SE ¼ 0.25) during searches for targets in the lower part, F(1,19) ¼ 15.64, p ¼ 0.001. Since targets in the lower part were on average found later, it is possible that the prolongation of the mean saccade amplitude results from few longer saccades at the end of the scanning sequence within each display. To determine spatial search preferences for specific regions in the display, fixation distributions in target absent trials were further analysed based on the mean number of fixations for each of the 16 positions in the display. For statistical purposes, the display was divided into an upper and lower part (height: first/second vs. third/fourth line in Figure 1), central and peripheral part (centrality: 12 outer target positions vs. four inner target positions) and left and right part of the search display (side). Corresponding means were calculated for each condition. A dependant sample t-test revealed no significant effect of height, t 5 1. However, positions on the left hand side were fixated more often than those on the right hand side, t(19) ¼ 6.39, p 5 0.001, and central positions were fixated more often
Downloaded by [Florida State University] at 08:00 09 October 2013
Ergonomics
1017
than peripheral positions, t(19) ¼ 8.13, p 5 0.001 (e.g. Tatler 2007). The side effect might be explained as a consequence of switches to the next line during a reading-like scanning sequence. If the display is scanned in a reading like fashion, such line switches are likely to appear, which are known to be followed by short correction saccades in reading, subsequently inflating the amount of fixations for the left display side. To examine the systematicity of search, saccade directions in target absent trials were analysed in more detail. Following an approach fist developed by Ponsoda et al. (1995; see also Huestegge et al. 2002, Gilchrist and Harvey 2006, Foulsham and Kingstone 2010), saccades were categorised with respect to their direction in the twodimensional search array according to a wind rose, resulting in eight different directions (North, Northeast, East, Southeast etc.). Relative frequencies were computed for each direction for all saccades in target absent trials as well as for only the first 2 (min. 364 saccades per subject), 5 (min. 554 saccades per subject) or 9 (min. 724 saccades per subject) saccades within a trial in order to delineate the time course of search systematicity. Results are shown in Figure 2. For statistical purposes, all horizontal and vertical saccades and all diagonal saccades were collapsed. Repeated measurement tests revealed that over all four conditions (2, 5, 9 and all saccades on the display), the number of horizontal and vertical saccades increased, F(3,17) ¼ 26.66, p 5 0.001, whereas the relative frequency of diagonal saccades decreased, F(3,17) ¼ 81.82, p 5 0.001. The analysis demonstrates a clear tendency for an increase in search systematicity over time. According to Ponsoda et al. (1995), less equally distributed saccade directions can be interpreted as a more systematic and therefore less random-like search. The present results indicate that participants incrementally tended to scan in a more reading like fashion, resulting in higher amounts of horizontal saccades over time. Recognition test The subsequent recognition test revealed nearly perfect target recognition (hit rate ¼ 99%), but also distractors were also recognised above chance level (p ¼ 0.034) with a hit rate of 67% (p 5 0.001 for the difference between targets and distractors). This suggests implicit learning of the (task-irrelevant) distractors. The false alarm rate for the nontargets amounted to 10%. In sum, the results of Experiment 1 provided clear evidence in favour of a familiarity effect, a saliency effect, and a substantial strategic modulation with respect to search systematicity based on cultural habits (reading-like pattern) and as a result of search demands (modulation of saccade amplitudes).
Figure 2. Relative frequency (in %) of saccade directions (according to a wind rose) on the search displays for target absent trials in Experiment 1 for the first 3, 5, 10 and all fixations per trial.
1018
L. Huestegge and R. Radach
Experiment 2: memory search In Experiment 2 we utilised the same materials and manipulations as in Experiment 1, thus enabling direct comparisons, but implemented different task demands. More specifically, we had subjects scan the display first to memorise as many items as possible. After that, a single probe item was presented, and participants indicated whether it was present in the previous display. Main differences are the reversion of the presentation order of single items and displays within each trial, the self paced inspection time for the displays, and the instruction to memorise as many items as possible during each display presentation in preparation to correctly responding to the following probe item.
Method
Downloaded by [Florida State University] at 08:00 09 October 2013
Material and apparatus The materials and apparatus were the same as in Experiment 1. Participants Twenty new university students took part in the experiment, four male and 16 female. Their mean age was 23;7 years (SD ¼ 1.75). All had normal or corrected-to-normal vision and received credit for participation. Procedure Experiment 2 consisted of the same 256 trials as in Experiment 1. Unlike Experiment 1, each trial started with the presentation of the stimulus array including 16 juice packaging triplets. Subjects were instructed to explore the display as long as they needed to memorise as many items as possible, and then press the space bar of the keyboard. Then, a single item was presented (probe), and subjects were asked to indicate as fast and precisely as possible whether the probe was present in the previously presented display. The probe remained visible until a response was executed, which triggered the next trial. In ‘target present’ trials (50%), the probe was present in the previously presented display. The set of probe items was the same as the set of target items in Experiment 1. All other procedural details remained the same as in Experiment 1. However, we did not administer the questionnaire. Design The design and dependent variables were identical to Experiment 1. Additionally, we examined display inspection times and fixation durations/frequencies with respect to the item in the display that corresponded to the probe. Results and discussion General results Table 3 presents overall RT and accuracy data. Seventy-two per cent of the probes were responded to correctly. This value is considerably lower than the accuracy achieved in the visual search task (Experiment 1), presumably because the display information exceeded working memory capacity. Incorrect responses included more misses (34.4% of target present trials) than false alarms (21% of target absent trials), t(19) ¼ 2.98, p ¼ 0.008. This difference possibly Table 3. Mean frequency and RTs of ‘present‘ versus ‘absent’ responses for target present and target absent trials in Experiment 2 (standard deviations in parentheses). Response decision ‘present’ Target present Target absent
% Trials RT (ms) % Trials RT (ms)
65.6 1176 21.0 1640
(11.6) (310) (17.1) (497)
‘absent’ 34.4 1298 79.0 1287
(11.8) (334) (17.0) (299)
1019
Downloaded by [Florida State University] at 08:00 09 October 2013
Ergonomics
results from the subjects’ tendency to only respond with ‘target present’ when they were certain about this decision. An analysis of RTs on the probe for correct responses revealed that ‘absent’ responses (1297 ms) were initiated later than ‘present’ responses (1176 ms), t(19) ¼ 3.50, p ¼ 0.002. Two different explanations may account for this difference. First, mental comparison of the probe with items in working memory could be conducted in a serial fashion (similar to visual search). A second explanation would be that the temporal distribution of ‘present’ responses includes some very fast responses for well encoded items, possibly in some cases based on very recent fixation of the respective items. Relatively long RTs were associated with false alarms (1640 ms), probably due to uncertainty whether the probe was present. Since accuracy might depend on the time spent on the displays, it appeared promising to further analyse display viewing times and the number of fixations on the display. Interestingly, shorter mean display viewing durations led to better performance, since in hit trials displays were inspected 9292 ms (SD ¼ 3188) compared to 8996 ms (SD ¼ 2871) for correct rejections, whereas wrong answers were preceded by display viewing durations of 10830 ms (SD ¼ 4143) for false alarms and 9810 ms (SD ¼ 2902) for misses, t(19) ¼ 4.93, p 5 0.001 for the overall RT difference between correct and false responses. This pattern is supported by corresponding differences in the mean number of fixations on the display, t(19) ¼ 4.84, p 5 0.001. Mean fixation duration did not differ between all four conditions, F 5 1. The mean saccade lengths were also comparable, with means ranging from about 78 to 7.58, t(19) ¼ 1.26, p 4 0.10 for the contrast between hits and misses. Table 4 presents a summary of these data. The performance advantage for shorter display viewing times may appear counterintuitive at first glance, as one would assume that longer viewing times should provide the possibility for better encoding (e.g. Zelinsky and Loschky 2005). However, the observed pattern might result from the complexity of the material. Longer viewing times led to an increased number of fixations, and maybe after the first scanning of a display, further fixations led to interference with items that were previously stored in working memory, resulting in an overall decline of performance (see also McCarley et al. 2003, for similar claims in the context of visual search). Furthermore, it was tested whether accuracy with respect to the probes depended on the time spent on the corresponding item in the search display within the same trial (for target present trials). However, it turned out that participants did not spend more time on these items in the display or fixated them more often in correct response trials (634 ms/2.84 fixations), as compared to incorrect response trials (641 ms/2.93 fixations), both ts 5 1. It appears that recognition performance for complex visual material is not primarily based on the amount of overt attention deployment on the items during encoding, but rather on later processes, presumably the retention of items in memory and/or the comparison of the probe with entries in working memory. Interestingly, recognition performance did not differ as a function of fixation recency, i.e., the number of fixations (1–5) between the last fixation of the target in the display and the onset of the probe item (see Irwin and Zelinsky 2002, Zelinsky and Loschky 2005), F 5 1. However, the absence of an effect here might be due to the fact that the present experiment was not explicitly designed to test this effect, and in some recency conditions the amount of observations was too small to reliably estimate the population means. Familiarity and shape Familiar items (75.5%) were remembered better than unfamiliar items (56.0%), F(1,19) ¼ 61.6, p 5 0.01. Bottles (76.5%) were remembered better compared to rectangular packages (55.5%), F(1,19) ¼ 73.6, p 5 0.001. These performance advantages for familiar and more salient items corroborate the findings from Experiment 1. The Table 4. Mean viewing times (ms), mean numbers of fixations (N), mean fixation durations (ms) and mean saccade amplitudes (8) on the displays for target present vs. absent trials as a function of response decision (standard deviations in parentheses). Response decision ‘present’ Target present
Target absent
Display viewing time (ms) Number of fixations (N) Mean fixation duration (ms) Mean saccade amplitude (8) Display viewing time (ms) Number of fixations (N) Mean fixation duration (ms) Mean saccade amplitude (8)
9292 35.1 238 7.26 10830 40.9 238 7.06
(3188) (12.5) (4.5) (0.26) (4143) (15.7) (5.0) (0.25)
‘absent’ 9810 36.8 238 7.17 8996 33.5 239 7.32
(2902) (11.8) (4.9) (0.24) (2871) (11.3) (4.4) (0.25)
1020
L. Huestegge and R. Radach
Downloaded by [Florida State University] at 08:00 09 October 2013
memory advantage for familiar items might at least partly be due to easier integration processes for familiar items into already existing memory representations. As in Experiment 1, the interaction of familiarity and shape was significant, F(1,19) ¼ 72.6, p 5 0.001, indicating that saliency is especially relevant for the memorisation of unfamiliar items (see Table 5). For the analysis of RTs in response to the probe items only hit trials were considered. Response times did not differ significantly as a function of familiarity, F(1,19) ¼ 1.28, p 4 0.10, but as a function of shape, F(1,19) ¼ 28.65, p 5 0.001, as RTs for bottles were about 150 ms faster than for rectangular packages. If RTs on the probe items reflect the process of comparing the probe with the memorised set of items, it may well be that the comparison of a more salient probe item with memorised items can be executed faster compared with less salient probe items. Item position For each of the 16 display positions, the mean number of fixations and the percentage of correctly remembered items in target present trials were determined. Similar to Experiment 1, the mean number of fixations was significantly greater for positions on the left side compared to the right side, t(19) ¼ 6.47, p 5 0.001. In line with previous research (e.g. Tatler 2007), there were also significantly more fixations at central compared to peripheral positions, t(19) ¼ 8.15, p 5 0.001, but no clear significant difference between upper versus lower parts of the display, t(19) ¼ 2.00, p ¼ 0.06. There were no significant differences regarding the percentage of correct responses, for the height contrast, t(19) ¼ 1.40, p ¼ 0.18, for the left-right contrast, t(19) ¼ 0.64, p ¼ 0.53, and for the contrast of central vs. peripheral positions, t(19) ¼ 1.80, p ¼ 0.09. Correlating the mean number of fixations and percentage of correct performance across all 16 positions yielded no significant result, r(15) ¼ 0.074, p ¼ 0.79. Items in the upper part of the display were not remembered significantly better than items in the lower part, instead, there was a marginal trend in the opposite direction, F(1,19) ¼ 3.24, p ¼ 0.09. However, probe RTs tended to be shorter for targets in the upper part (1165 ms) than in the lower part (1212 ms), F(1,19) ¼ 3.38, p ¼ 0.08. Overall, the analyses of fixation distributions in the display showed a pattern that was strikingly similar to Experiment 1, specifically a preference for fixating central items and items on the left hand side of the display. However, in spite of the differences in fixation distributions over the display, this had no impact on the memory accuracy calculated for the various positions, again strongly suggesting that recognition performance does not heavily depend on early encoding processes during memorisation. To examine search systematicity on the displays, the same procedure as in Experiment 1 was applied. The results are presented in Figure 2. For statistical purposes, all horizontal and vertical saccades and all diagonal saccades were collapsed. A repeated measurement comparison revealed that over time (first 2, 5, 9 and all saccades on the display), the relative number of horizontal and vertical saccades increased significantly, F(3,17) ¼ 49.85, p 5 0.001, whereas the amount of diagonal saccades correspondingly decreased accordingly, F(3,17) ¼ 46.33, p 5 0.001. A comparison between Experiment 1 and 2 revealed that subjects initiated more horizontal or vertical saccades in Experiment 2 compared to Experiment 1, t(38) ¼ 3.95, p 5 0.001, and, correspondingly, fewer diagonal saccades, t(38) ¼ 3.85, p 5 0.001. This is also the case when only the first three saccades per trial were taken into account, t(38) ¼ 2.97, p ¼ 0.005 for horizontal and vertical saccades, and t(38) ¼ 2.81, p ¼ 0.008 for diagonal saccades. As in Experiment 1, search systematicity increased over time, as suggested by an increase of the relative frequency of horizontal and vertical saccades (see Figure 3). Taken together, the saccade vector distributions show a similar increase of systematicity over the time as in Experiment 1, while scanning was generally more systematic in the memory search task compared to visual search on the same displays (see Figure 4).
Table 5. Correct responses (%) for target present trials towards the probe item in Experiment 2 as a function of target item familiarity, shape, and position. Standard deviations are given in brackets. Familiarity Shape rectangular bottle
low upper positions lower positions upper positions lower positions
37.0% 39.7% 72.7% 75.0%
(10.5) (11.1) (19.3) (14.8)
high 70.3% 73.3% 76.6% 80.8%
(17.1) (18.5) (16.7) (19.1)
Downloaded by [Florida State University] at 08:00 09 October 2013
Ergonomics
1021
Figure 3. Relative frequency (in %) of saccade directions (according to a wind rose) on the search displays in Experiment 2 for the first 3, 5, 10 and all fixations per trial.
Figure 4. Scanning patterns of 50 consecutive trials, sampled from two participants from Experiment 1 (visual search, left side) and Experiment 2 (memorisation, right side).
1022
L. Huestegge and R. Radach
Downloaded by [Florida State University] at 08:00 09 October 2013
Learning of the probe set? Since the set of potential probe items was limited to eight, it appears possible that subjects might have learned the probe set over the course of the experiment (‘superset learning,’ see Logan and Stadler 1991, Huestegge and Koch 2012). If this was indeed the case, subjects should have been able to search directly for these targets from the target set during the memorisation of the display, and thus the relevant aspects of effects reported in Experiment 1 should also be present, e.g., shorter inspection times for displays containing a bottle target, a familiar target, or a target at upper positions in the display. There were no effects of target familiarity on display inspection times, F(1,19) ¼ 2.76 p ¼ 0.11. However, the data show significant effects of shape, F(1,19) ¼ 10.40, p ¼ 0.004, and of height, F(1,19) ¼ 4.53, p ¼ 0.047, with shorter inspection times for displays containing target bottles compared to rectangular packages and shorter inspection times for displays containing targets in the upper part of the display. The significant effect of target shape on the inspection time is also reflected in the number of fixations, F(1,19) ¼ 11.79, p ¼ 0.003, with estimated means of 34.6 fixations during the memorisation of a display containing a target bottle and 36.7 fixations during the memorisation of a display containing a rectangular target. Taken together, the presence of the shape and the height effects implies that the probe set was learned to some extent, even though there was no significant difference between target items and distracters with respect to the total fixation time spent on each item type [412 ms vs. 436 ms, t(19) ¼ 1.30, p 4 0.10]. Interestingly, the familiarity effect was not present in the display inspection times. Probably, familiarity processing is linked to rather voluntary, strategic processes which participants did not apply here to the same extent as in Experiment 1. In sum, these results show quite convincingly that subjects reduced the amount of attention spent on redundant or uninformative information. It is therefore likely that the memorisation process was stopped when an item in the display matched one from the superset currently present in reference memory. Recognition test The subsequent recognition test revealed decent target recognition (hit rate ¼ 93%), and also distractors were recognised above chance level (p 5 0.001) with a hit rate of 86% (p ¼ 0.048 for the difference between targets and distractors). The advantage for the target (vs. distractor) items further corroborates the claim that probe set learning took place. The false alarm rate for the non-targets amounted to 11%. General discussion Two experiments were conducted to study how top down (target familiarity, search task) and bottom up (target position, target saliency) factors that are of high relevance from an applied point of view affect visual and memory search performance in a complex search setting. Unlike many previous studies that utilised abstract, meaningless stimuli (e.g. see Treisman 1991, Wolfe 1994), the present work focused on issues that can be more adequately addressed using more realistic stimuli (see also Zelinsky et al. 1997, Brockmole and Henderson 2006, Underwood et al. 2006), like the question of how target familiarity or cultural habits affect search processes. Recent research revealed that despite the overall complexity (see Walker et al. 2010, for a thorough discussion of the term ‘complexity’ in the field of ergonomics), visual search in real scenes can be highly effective (Wolfe et al. 2011). Here, displays with large arrays of juice packages were designed to create a setting that is to some extent similar to a real shopping situation but still amenable to tight experimental control. In both experiments, an identical set of real juice packages was used as stimulus material. The main difference between both experiments was the search task (visual vs. memory search), resembling two different purposes of visual processing in everyday life, namely either a search for a previously specified object, or the memorisation of complex visual material in preparation for later decision making (e.g. Baumgartner and Steenkamp 1996). Questionnaire data validated the assumption that both scenarios indeed commonly occur in the daily life of the participants. A comparison of the overall accuracy across both experiments indicated that Experiment 2 was more difficult than Experiment 1. This was to be expected: Working memory capacity was highly overstrained in Experiment 2, since participants were presented 16 different multidimensional items to memorise. In line with performance data, time spent on the displays was greater in Experiment 2 compared to Experiment 1, likely also due to the difference in overall task demands. In Experiment 1, displays were scanned for about 2 s and with up to ten fixations, indicating serial search processes. This is in harmony with previous research suggesting that scanning involving more than two saccades/fixations can be considered more or less serial (e.g. Binello et al. 1995, Findlay 1995, Brown et al. 1997, Williams et al. 1997, Zelinsky and Sheinberg 1997). One reason for the sequential nature of the search is likely to be
Ergonomics
1023
the high overall similarity of the multidimensional items in the display. Previous work has demonstrated that saccades in visual search are frequently guided towards items that are similar to the target (see Motter and Belky 1998, Hooge and Erkelens 1999, Pomplun et al. 2001, Findlay and Gilchrist 2003). Response times in response to the probe items in Experiment 2 were considerably faster than the display search times in Experiment 1, showing that memory retrieval processes are generally faster (albeit error-prone) than overt attentional scans of actual displays.
Downloaded by [Florida State University] at 08:00 09 October 2013
Bottom up processing One important manipulation with respect to targets in both experiments was the variation of target saliency as a typical bottom up feature. To this end, targets were designed as members of either a subset with more homogeneous (rectangular packages) versus heterogeneous (bottles) shapes. Searching for a target item belonging to the heterogeneous group was associated with a lower target-distractor similarity, and therefore a higher saliency of the target. The saliency concept refers to the idea that within the visual field all spatial locations are characterised by saliency values representing weighted compounds of basic visual features like colour and brightness contrast (Koch and Ullman 1985). In this framework the allocation of attention was assumed to be guided by saliency, provided otherwise equal conditions. Based on the assumptions of Duncan and Humphreys (1989), salient targets should lead to a faster search in Experiment 1, and probably also to better memory performance in Experiment 2. The results confirmed that search and memorisation was better for the more salient items, corroborating previous research showing that object shape is an effective cue for subsequent search performance (Malcolm and Henderson 2009; see also Hughes and Creed 1994, for colour effects in avionic displays). Experiment 2 also showed that the salient targets also led to faster probe RTs, indicating that the processes underlying the matching of the probe item with the items in working memory were more efficient for salient (vs. less salient) items. The present results are not quite in line with a previous study reporting that the saliency of a target item does not influence search efficiency (Foulsham and Underwood 2009), and that saliency is only influential in memory search tasks, and not in visual search tasks (Underwood and Foulsham 2006). Probably, these discrepancies are due to differences in the stimulus material, which in our case consists of a comparatively large number of items which are highly structured due to the grid-like layout of the displays. However, our results are quite in line with a number of other studies which reported evidence in favour of a substantial influence of saliency on basic visual search performance (e.g. Parkhurst et al. 2002, Carmi and Itti 2006) and on web page search (Ling and Van Schaik 2004, Thielsch and Hirschfeld 2010). Top down processing In contrast to the saliency effect, the substantial influence of familiarity in both experiments demonstrated that top down processing also plays a major role during search processes, again corroborating previous research (e.g. Mruczek and Sheinberg 2005, Chen and Zelinsky 2006). Most likely, the more frequent prior exposure to the more familiar items has eventually translated into more efficient processing of these items during search (Maljkovic and Nakajama 1994). While the previous studies already showed that target familiarity may decrease RTs, our results suggest that these effects tend to scale up in more lifelike environments, so that they have a huge impact on search accuracy and memory. Since in the visual search experiment participants only had to memorise one explicitly presented item, it appears highly unlikely that memory failure alone can explain the lower performance for unfamiliar items. Furthermore, participants did not appear to abandon search sooner for unfamiliar (vs. familiar) items. Thus, the most likely explanation here may be that item familiarity (similar to saliency) enhances peripheral visual processing of the targets, so that unfamiliar items are often ‘overlooked.’ This interpretation is corroborated by the faster target locating times for familiar targets. Due to the lack of feedback, participants were not able to compensate for this failure by even further increasing the search times. Additionally, familiar items were also processed faster once they were fixated, resembling familiarity effects in other domains like word reading (e.g. Kliegl et al. 2006). Another factor that has to be taken into account to explain the high miss rates is target prevalence. It has been shown that miss rates increase as target prevalence decreases (Wolfe et al. 2005), while at the same time search termination times on target-absent trials become shorter (Wolfe and Van Wert 2010, Ishibashi et al. 2012). These observations render it quite likely that higher target prevalence would also have resulted in smaller miss rates in our present design. As an important novel finding, we were able to show that target familiarity strongly interacts with target saliency. More specifically, target familiarity only seems to play a major role when the targets are of rather low
1024
L. Huestegge and R. Radach
Downloaded by [Florida State University] at 08:00 09 October 2013
saliency. A practical implication of this finding for the field of marketing psychology would be that unfamiliar products should at least be designed in a salient way to facilitate search and memory processes, whereas the saliency of familiar products is less relevant for performance. The eye movement data provided additional information about the mechanisms underlying the familiarity effect obtained in Experiment 1. The search for more unfamiliar items was associated with shorter saccade amplitudes for initial saccades to the targets, making it likely that the higher difficulty of the search for unfamiliar items resulted in a decrease of parafoveal processing efficiency. In turn, this may have triggered a general, strategic reduction of saccade amplitudes (see Henderson and Ferreira 1990). This finding is in line with previous research that also presented evidence for a strategic alignment of scan patterns as a function of visual search difficulty (Hooge and Erkelens 1996, 1998, 1999). The familiarity effect on memory performance in Experiment 2 was presumably due to enhanced encoding and/ or retention processes, since the lack of an RT advantage for familiar probe items suggested that retrieval processes were not substantially affected by the familiarity manipulation. Taken together, the familiarity effects in both experiments demonstrate how top down stimulus features modulate both search and memory efficiency. Scanning strategies Target position represents a physical characteristic of the display layout and therefore qualifies as a bottom up feature. Nonetheless its effects on scanning strategies can be seen as strong evidence for top down control of scanning patterns. Taken together, the results point to three distinct sources of influence on scanning strategies, namely current task demands, generalised cultural habits (see Figure 4), and specific purposes or motivations of a subject in a given situational context. The influence of current task demands was obvious in the analysis of the familiarity effect. Subjects that were engaged in a more difficult task, namely the search for unfamiliar items, reduced their saccade length, maybe in response to a decrease in the usefulness of parafoveal processing (see above). These effects are in line with other reports of search strategies, for example, in the context of baggage X-ray screening (McCarley 2009). Experiment 1 provided evidence for cultural influences of scanning patterns, namely a reading-like scanning strategy. This is represented in faster search times for targets in the upper part of the display, a higher amount of fixations on the left part of the display, and a dominance of horizontal saccades in both experiments, all of which are typical for reading-like scanning patterns. Furthermore, the data reveal a tendency of participants to increase search systematicity over time during the scanning of each display, indicating more thorough scanning when the target is not being found during the first few fixations. The larger number of fixations located in the centre of the display suggests that despite the overall homogeneity of the stimulus array, preferences for specific regions are quite common (Ford et al. 1959, Carrasco et al. 1995, Wolfe et al. 1998, Tatler 2007). Experiment 2 indicated that item position did not play a substantial role for memorisation accuracy. Interestingly, memory performance did also not depend on the time spent on the respective target during memorisation, and overall memory performance even decreased with an increase of time spent on a display. This may indicate that encoding strength does not strongly rely on early visual processes, but rather depends on consolidation and/or retrieval processes that might be adversely affected by interference with new incoming information. Evidence for an influence of the purpose of a subject comes from the observation that overall systematicity was greater in the memory search task compared to the visual search task, probably because participants attempted to strategically scan a display in a more thorough and systematic way when they are engaged in the rather difficult memorisation task. Overall, the results are in line with a recent study by Castelhano et al. (2009), who reported differences in spatial fixation distributions, increased number of fixations, and smaller saccade amplitudes for memory search (vs. visual search). Conclusion The results reported in this study should be of interest from both a basic research and applied perspective. Taking a basic research perspective, the present findings illuminate strong interactions between top down and bottom up aspects of processing, as evident, for example, in the interplay of familiarity and saliency effects. Search performance and visual scanning are mediated by distinct influences of generalised cultural habits, current task demands, and overall goals of the participants (see Radach et al. 2008, for a similar discussion in the neighbouring domain of reading). From a more applied point of view, the saliency effect implies an advantage of more creative (heterogeneous) product design. The familiarity effect can be taken to suggest that more advertising may directly
Ergonomics
1025
lead to a faster search and a better memory encoding of the respective products. However, if a product is new or was only sparsely advertised, a more salient product design might yield a specifically high impact on search and memorisation performance. The position effects clearly implicate that the positioning of items plays a role even when head and body movements are not involved, with a general advantage for central positions. Also, participants exhibited a tendency to scan complex but structured scenes in a reading like fashion. These results should also be highly relevant in the context of designing virtual shopping platforms in the internet, where it is unknown how information processing works compared to real shops, and for the implementation of so-called ‘shelf tests’ in marketing research that are frequently conducted to assess product acceptance. As a part of such a test, a product of interest is placed into real supermarket shelves to analyse customer behaviour under realistic circumstances. However, this method is effortful and costly, and new approaches such as the one introduced in the present work appear well suited to promote a new generation of applied research and product assessment using thoughtfully designed virtual product shelves. Our study demonstrates how a product (or a visual item in general) needs to be designed and placed to ensure that it can be found effectively and efficiently within a complex environment.
Downloaded by [Florida State University] at 08:00 09 October 2013
Acknowledgements The authors would like to thank Jeremy Wolfe, Richard So, and two anonymous reviewers for their helpful comments on earlier drafts of this manuscript.
References Baumgartner, H. and Steenkamp, J.-B.E.M., 1996. Exploratory consumer buying behavior: conceptualization and measurement. International Journal of Research in Marketing, 13, 121–137. Beck, M.R., Lohrenz, M.C., and Trafton, J.G., 2010. Measuring search efficiency in complex visual search tasks: global and local clutter. Journal of Experimental Psychology: Applied, 16, 238–250. Binello, A., Mannan, S., and Ruddock, K.H., 1995. The characteristics of eye-movements made during visual search with multielement stimuli. Spatial Vision, 9, 343–362. Brockmole, J.R. and Henderson, J.M., 2006. Recognition and attention guidance during contextual cueing in real-world scenes: evidence from eye movements. Quarterly Journal of Experimental Psychology, 59, 1177–1187. Brown, V., Huey, D., and Findlay, J.M., 1997. Face detection in peripheral vision: Do faces pop out? Perception, 26, 1555–1570. Buswell, G.T., 1935. How People Look at Pictures. Chicago: University of Chicago Press. Carmi, R. and Itti, L., 2006. Visual causes versus correlates of attentional selection in dynamic scenes. Vision Research, 46, 4333– 4345. Carrasco, M., et al., 1995. The eccentricity effect: target eccentricity affects performance on conjunction searches. Perception and Psychophysics, 57, 1241–1261. Castelhano, M.S., Mack, M., and Henderson, J.M., 2009. Viewing task influences eye movements during active scene perception. Journal of Vision, 9 (3), 6, 1–15. Chen, X. and Zelinsky, G.J., 2006. Real-world visual search is dominated by top-down guidance. Vision Research, 46, 4118–4133. Chung, A.Z. and Shorrock, S.T., 2011. The research-practice relationship in ergonomics and human factors – surveying and bridging the gap. Ergonomics, 54, 413–429. Dickinson, C.A. and Intraub, H., 2009. Spatial asymmetries in viewing and remembering scenes: Consequences of an attentional bias? Attention, Perception, & Psychophysics, 71, 1251–1262. Duncan, J. and Humphreys, G.W., 1989. Visual search and stimulus similarity. Psychological Review, 96, 433–458. Findlay, J.M., 1995. Visual search: Eye movements and peripheral vision. Optometry and Vision Science, 72, 461–466. Findlay, J.M. and Gilchrist, I.D., 2003. Active vision: the psychology of looking and seeing. Oxford: Oxford University Press. Ford, A., White, C.T., and Lichtenstein, M., 1959. Analysis of eye movements during free search. Journal of the Optical Society of America, 49, 287–292. Foulsham, T. and Kingstone, A., 2010. Asymmetries in the direction of saccades during perception of scenes and fractals: effects of image type and image features. Vision Research, 50, 779–795. Foulsham, T., Teszka, R., and Kingstone, A., 2011. Saccade control in natural images is shaped by the information visible at fixation: evidence from asymmetric gaze-contingent windows. Attention, Perception, and Psychophysics, 73, 266–283. Foulsham, T. and Underwood, G., 2007. How does the purpose of inspection influence the potency of visual salience in scene perception? Perception, 36, 1123–1138. Foulsham, T. and Underwood, G., 2009. Does conspicuity enhance distraction? Saliency and eye landing position when searching for objects. Quarterly Journal of Experimental Psychology, 62, 1088–1098. Gilchrist, I.D. and Harvey, M., 2006. Evidence for a systematic component within scanpaths in visual search. Visual Cognition, 14, 704–715. Guest, D. and Lamberts, K., (2011). The time course of similarity effects in visual search. Journal of Experimental Psychology: Human Perception and Performance, 37, 1667–1688. Henderson, J.M., 2003. Human gaze control in real-world scene perception. Trends in Cognitive Science, 7, 498–504. Henderson, J.M., et al., 2007. Visual saliency does not account for eye movements during visual search of real-world scenes. In: R.P.G. Van Gompel, M.H. Fischer, W.S. Murray and R.I. Hill, eds. Eye movements: a window on mind and brain. Amsterdam: Elsevier.
Downloaded by [Florida State University] at 08:00 09 October 2013
1026
L. Huestegge and R. Radach
Henderson, J.M. and Ferreira, F., 1990. Effects of foveal processing difficulty on the perceptual span in reading: Implications for attention and eye movement control. Journal of Experimental Psychology: Learning, Memory, and Cognition, 16, 417–429. Hooge, I.T.C. and Erkelens, C.J., 1996. Control of fixation duration in a simple search task. Perception & Psychophysics, 58, 969– 976. Hooge, I.T.C. and Erkelens, C.J., 1998. Adjustment of fixation duration in visual search. Vision Research, 38, 1295–1302. Hooge, I.T.C. and Erkelens, C.J., 1999. Peripheral vision and oculomotor control during visual search. Vision Research, 39, 1567–1575. Horowitz, T.S. and Wolfe, J.M., 1998. Visual search has no memory. Nature, 394, 575–577. Huestegge, L. and Koch, I., (2012). Eye movements as a gatekeeper for memorization: evidence for the persistence of attentional sets in visual memory search. Psychological Research, 76, 270–279. Huestegge, L., et al., 2002. Visual search in long-term cannabis users with early age of onset. Progress in Brain Research, 140, 377–394. Hughes, P.K. and Creed, D.J., 1994. Eye movement behavious vieweing colour-coded and monochrome avionic displays. Ergonomics, 37, 1871–1884. Humphrey, K. and Underwood, G., 2009. Domain knowledge moderates the influence of visual saliency in scene recognition. British Journal of Psychology, 100, 377–398. Inhoff, A.W., et al., 2003. Parafoveal Processing: Distinct subsystems for spatial and linguistic information. Quarterly Journal of Experimental Psychology: Human Experimental Psychology, 56, 803–827. Irwin, D.E. and Zelinsky, G.J., 2002. Eye movements and scene perception: Memory for things observed. Perception & Psychophysics, 64, 882–895. Ishibashi, K., Kita, S., and Wolfe, J.M., (2012). The effects of local prevalence and explicit expectations on search termination times. Attention, Perception, and Psychophysics, 74, 115–123. Itti, L. and Koch, C., 2000. A saliency-based search mechanism for overt and covert shifts of visual attention. Vision Research, 40, 1489–1506. Janiszewski, C., 1998. The influence of display characteristics on visual exploratory search behavior. Journal of Consumer Research, 25, 290–301. Klein, R.M. and Dukewich, K.R., 2006. Does the inspector have a memory? Visual Cognition, 14, 648–667. Kliegl, R., Nuthmann, A., and Engbert, R., 2006. Tracking the mind during reading: the influence of past, present, and future words on fixation durations. Journal of Experimental Psychology: General, 135, 12–35. Koch, C. and Ullman, S., 1985. Shifts in visual attention: towards the underlying circuitry. Human Neurobiology, 4, 219–222. Kujala, T. and Saariluoma, P., 2011. Effects of menu structure and touch screen scrolling style on the variability of glance durations during in-vehicle visual search tasks. Ergonomics, 54, 716–732. Lesch, M.F., et al., 2011. Age-related differences in warning symbol comprehension and training effectiveness: effects of familiarity, complexity, and comprehensibility. Ergonomics, 54, 879–890. Ling, J. and Van Schaik, P., 2004. The effects of link format and screen location on visual search of web pages. Ergonomics, 47, 907–921. Logan, G.D. and Stadler, M.A., 1991. Mechanisms of performance improvement in consistent-mapping memory search: automaticity or strategy shift? Journal of Experimental Psychology: Learning, Memory, and Cognition, 17, 478–496. Malcolm, G.L. and Henderson, J.M., 2009. The effects of target template specificity on visual search in real-world scenes: evidence from eye movements. Journal of Vision, 9, 1–13. Maljkovic, V. and Nakayama, K., 1994. Priming of popout: I. Role of features. Memory & Cognition, 22, 657–672. McCarley, J.S., 2009. Effects of speed-accuracy instructions on oculomotor scanning and target recognition in a simulated baggage X-ray screening task. Ergonomics, 52, 325–333. McCarley, J.S., et al., 2003. How much memory does oculomotor search have? Psychological Science, 14, 422–426. Mills, M., et al., 2011. Examining the influence of task set on eye movements and fixations. Journal of Vision, 11 (8), 17, 1–15. Motter, B.C. and Belky, E.J., 1998. The guidance of eye movements during active visual search. Vision Research, 38, 1805–1815. Mruczek, R.E. and Sheinberg, D.L., 2005. Distractor familiarity leads to more efficient visual search for complex stimuli. Perception and Psychophysics, 67, 1016–1031. Neisser, U., 1969. Cognitive psychology. New York: Appleton-Century-Crofts. Parkhurst, D., Law, K., and Niebur, E., 2002. Modelling the role of salience in the allocation of overt visual attention. Vision Research, 42, 107–123. Pomplun, M., Reingold, E.M., and Shen, J., 2001. Investigating the visual span in comparative search: The effects of task difficulty and divided attention. Cognition, 81, 57–67. Ponsoda, V., Scott, D., and Findlay, J.M., 1995. A probability vector and transition matrix analysis of eye movements during visual search. Acta Psychologica, 88, 167–185. Pradhan, A.K., et al., 2011. The effects of focused attention training on the duration of novice drivers’ glances inside the vehicle. Ergonomics, 54, 917–931. Previc, F.H., 1990. Functional specialization in the lower and upper visual fields in humans: its ecological origins and neurophysiological implications. Behavioral and Brain Sciences, 13, 519–575. Proulx, M.J., (2011). Individual differences and metacognitive knowledge of visual search strategy. PLoS One, 6 (10), e27043. Radach, R., Huestegge, L., and Reilly, R., 2008. The role of global top-down factors in local eye-movement control in reading. Psychological Research, 72, 675–688. Schneider, W. and Shiffrin, R.M., 1977. Controlled and automatic human information processing: 1. Detection, search, and attention. Psychological Review, 84, 1–66. Shore, D.I. and Klein, R.M., 2000. On the manifestations of memory in visual search. Spatial Vision, 14, 59–75. Sternberg, S., 1966. High-speed scanning in human memory. Science, 153, 652–654.
Downloaded by [Florida State University] at 08:00 09 October 2013
Ergonomics
1027
Tatler, B.W., 2007. The central fixation bias in scene viewing: selecting an optimal viewing position independently of motor biases and image feature distributions. Journal of Vision, 7 (14), 4, 1–17. Thielsch, M.T. and Hirschfeld, G., 2010. High and low spatial frequencies in website evaluations. Ergonomics, 53, 972–978. Tong, F. and Nakayama, K., 1999. Robust representations for face: Evidence from visual search. Journal of Experimental Psychology: Human Perception and Performance, 25, 1016–1035. Treisman, A. and Gelade, G., 1980. A feature integration theory of attention. Cognitive Psychology, 12, 97–136. Treisman, A., 1991. Search, similarity and the integration of features between and within dimensions. Journal of Experimental Psychology: Human Perception and Performance, 27, 652–676. Underwood, et al., 2003. Visual attention while driving: sequences of eye fixations made by experienced and novice drivers. Ergonomics, 46, 629–646. Underwood, G., Crundall, D., and Chapman, P., 2002. Selective searching while driving: the role of experience in hazard detection and general surveillance. Ergonomics, 45, 1–12. Underwood, G. and Foulsham, T., 2006. Visual saliency and semantic incongruency influence eye movements when inspecting pictures. Quarterly Journal of Experimental Psychology, 59, 1931–1949. Von Mu¨hlenen, A., Mu¨ller, D., and Mu¨ller, H.J., 2003. Sit-and-wait strategies in dynamic visual search. Psychological Science, 14, 309–314. Walker, G.H., et al., 2010. Translating concepts of complexity to the field of ergonomics. Ergonomics, 53, 1175–1186. Williams, D.E., et al., 1997. Patterns of eye movements during parallel and serial visual search tasks. Canadian Journal of Experimental Psychology, 51, 151–164. Wolfe, J.M., 1994. Guided Search 2.0: A revised model of visual search. Psychonomic Bulletin and Review, 1, 202–238. Wolfe, J.M., et al., 2011. Visual search for arbitrary objects in real scenes. Attention, Perception, and Psychophysics, 73, 1650– 1671. Wolfe, J.M., Horowitz, T.S., and Kenner, N., 2005. Rare items often missed in visual searches. Nature, 435, 439–440. Wolfe, J.M., O’Neill, P.E., and Bennett, S.C., 1998. Why are there eccentricity effects in visual search? Perception and Psychophysics, 60, 140–156. Wolfe, J.M. and Van Wert, M., 2010. Varying target prevalence reveals two dissociable decision criteria in visual search. Current Biology, 20, 121–124. Zelinsky, G.J. and Loschky, L.C., 2005. Eye movements serialize memory for objects in scenes. Perception and Psychophysics, 67, 676–690. Zelinsky, G., et al., 1997. Eye movements reveal the spatio-temporal dynamics of visual search. Psychological Science, 8, 448– 453.


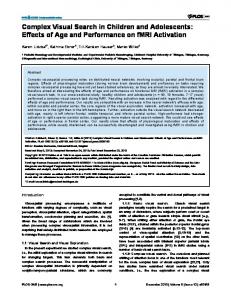


![Visual and semantic biases in memory search [PDF]](https://m.moam.info/img/260x300/visual-and-semantic-biases-in-memory-search-pdf_649aad19098a9e3f528b47fd.jpg)


